
Abstract
In the past decades, increasing attention in the public sector has been paid to the relationship between human resource management (HRM) practices and organizational commitment. The bureaucratic structure of public organizations has often been mentioned to have a negative impact on this relationship. To reduce red tape and increase goal clarity, governments worldwide have created semi-autonomous agencies that operate at arm’s length, expecting that they would operate under more business-like conditions with positive effects on organizational commitment. In this study, these positive expectations were tested using groups of employees working at central government, two types of agencies, and businesses. Using multigroup structural equation modeling with a Dutch data set containing 2,432 respondents, the findings provide little support for the notion that agencies are similar to businesses in terms of bureaucracy and ways to stimulate employee commitment, and even indicate that some agencies are more bureaucratic than central government.
Introduction
In the past years, increasing attention has been paid on ways to stimulate public employees’ commitment, as it has been argued to be critical for performance (Hansen & Kjeldsen, 2017; Organisation for Economic Co-operation and Development [OECD], 2016; Wright & Davis, 2003). In this respect, governments have increasingly adopted human resource management (HRM) practices, which were found to be beneficial in the private sector (Dunleavy, Margetts, Bastow, & Tinkler, 2005; Pollit & Bouckaert, 2011). However, scholars have questioned whether these practices would have a similar effect in public organizations (Brown, 2004; Diefenbach, 2009). A prevailing argument is that the bureaucratic structure of central government includes high levels of red tape and unclear goals, which is supposed to negatively impact the perceptions of HRM practices and alienate employees from their organization, leading to lower commitment (DeHart-Davis & Pandey, 2005; Hansen & Kjeldsen, 2017; Jung, 2014).
To circumvent these issues, semi-autonomous agencies—hereafter referred to as agencies—have been created, which operate at arm’s length of central government (Verhoest, Van Thiel, Bouckaert, & Laegreid, 2012). Thus, although they can still be viewed as governmental, agencies are organizationally distinct and, to a certain degree, independent from central government (Selin, 2015). Being created as less hierarchical, single-purpose organizations, agencies would operate under business-like conditions beneficial for HRM and employees (Dunleavy et al., 2005; Rainey, 2009). It was expected that agencies and their employees were less hindered by red tape and that their goals were less diverse and ambiguous, that is to say, more consistent with businesses. These expected benefits have been one of the motives for “agencification” in many countries, leading to the creation of numerous agencies (Van Thiel, 2012).
Despite the ubiquity of agencies nowadays, little is known about whether they are indeed able to better stimulate organizational commitment than central government, due to lower red tape and clearer goals. In this respect, previous literature suggests that many positive claims regarding agencies should be met with caution (Kim & Cho, 2014; Overman & van Thiel, 2015; Yamamoto, 2006). Therefore, the goal of this study is to put these positive claims to the test. More specifically, this study aims to compare the effects of perceived red tape and job goal clarity on satisfaction with HRM practices and organizational commitment among central government, two types of agencies, and businesses.
By presenting agencies as independent organizations, this study extends previous literature on public–private comparisons by more adequately reflecting the distinction between agencies and central governments found in practice. Over time, several studies have investigated public and private sector differences in HRM and organizational commitment (e.g., Vanhala & Stavrou, 2013; Wang, Bruning, & Peng, 2007; Zeffane, 1994). However, the evidence is mixed, and conclusions should be drawn with care (Baarspul & Wilderom, 2011). One of the possible explanations for these mixed findings could be related to an oversimplification of the public sector in research, by presenting the public sector as one unified sector. By disentangling central government and agencies in this study, we can get more insight into a prime example of the “blurring of the sectors” (Rainey & Chun, 2007; Verhoest et al., 2012).
To test the hypotheses, secondary survey data were collected in the Netherlands in 2014, containing information of employees from central government, agencies, and businesses. As previous research found nonidentical measurement models between sectors (Van Loon, 2017), multigroup structural equation modeling (SEM) analyses were conducted to control for measurement invariance across sectors before testing the hypotheses.
In the remainder of this article, the position of agencies in relation to central government and businesses is discussed first, followed by hypotheses on differences in employee perceptions of red tape and job goal clarity. Also, hypotheses are presented on differences in the effects of perceived red tape and job goal clarity on satisfaction with HRM practices and organizational commitment. Second, the methodology is described, followed by the results. Finally, the results, limitations, and suggestions for future research are discussed.
Theory
Central Government, Businesses, and the Position of Agencies
In the past decades, scholars have adopted different ways to distinguish between public and private organizations, most of them referring to either the core or dimensional approach (Bozeman & Bretschneider, 1994). In the core approach, public and private organizations are distinguished based on legal type (government-owned vs. privately owned), whereas in the dimensional approach, every organization is, to a certain degree, considered public. Although often studied separately, the two approaches are complementary, rather than alternatives, and have merit on their own (Antonsen & Jorgensen, 1997). In this study, the core approach is adopted to distinguish between government-owned (central government and agencies) and privately owned organizations (businesses). In addition, the dimensional approach is adopted to distinguish between central government and agencies, based on the agencies’ independence.
Albeit government-owned, agencies are expected to act as businesses and operate under business-like conditions. As mentioned before, agencies are organizationally distinct and independent from central government, although they remain under the political responsibility of (a department of) central government (Selin, 2015). Agencies are expected to operate under business-like conditions, have organizational autonomy, and sometimes have legal personality. Furthermore, while central government is primarily responsible for policymaking, agencies are primarily responsible for policy implementation (Kickert, 2001). Following the categorization of public organizations by Van Thiel (2012), three types of agencies can be identified based on their legal personality and managerial autonomy. The first two types are fully government owned and will be examined in this study. Type 1 agencies have some degree of managerial autonomy but no legal independence (see, for example, the Next Steps Agencies in the United Kingdom). Type 2 agencies, with legal independence and managerial autonomy, are the most common types of agencies in Europe (e.g., public establishments in France and Italy, and nondepartmental public bodies in the United Kingdom). Most agencies have been founded during the heydays of New Public Management (NPM) from the early 1980s until the early 2000s, although some agencies have existed much longer.
Differences in perceived red tape
Clearly, one of the most striking distinctions between government- and privately owned organizations is the absence of profitability and markets as sources of incentives and controls in the public sector (Rainey & Chun, 2007). Instead, governmental control often implies the extensive use of legal and formal constraints, leading to high perceptions of red tape (Pandey & Kingsley, 2000). Although early studies considered red tape as a relatively neutral concept, being sometimes detrimental or sometimes beneficial to the organization (Kaufman, 1977), today scholars generally agree that red tape is an organizational pathology (Borry, 2016; Bozeman, 2012; Tummers, Weske, Bouwman, & Grimmelikhuijsen, 2016). That is, red tape is always detrimental to the organization. Based on this notion, Bozeman (1993) defined red tape as “rules, regulations, and procedures that remain in force and entail a compliance burden but do not advance the legitimate purpose the rules were intended to serve” (p. 283).
Using this definition, many studies have measured red tape by asking respondents a single question to indicate the level of red tape in their organization from 0 to 10 (e.g., Kjeldsen & Hansen, 2018; Moynihan & Pandey, 2007; Pandey & Kingsley, 2000). Although commended for its simplicity, this measure of red tape has been criticized for its lack of multidimensionality (Bozeman & Feeney, 2011; Feeney, 2012). Another point of criticism toward this question is the fact that respondents are introduced to the term “red tape,” which has a negative connotation in popular culture, potentially creating bias (Bozeman & Scott, 1996). Building on these criticisms, scholars have recently developed red tape measures that try to capture its multidimensional nature. For example, Borry (2016) developed the Three-Item Red Tape (TIRT) scale that includes items measuring how burdensome, unnecessary, and ineffective rules are in the organization. Furthermore, Van Loon, Leisink, Knies, and Brewer (2016) developed a job-centered red tape scale that measures the lack of functionality and the degree of compliance burden of the organizational rules with which the respondents must comply.
One of the reasons why agencies were granted organizational autonomy was to overcome high levels of perceived red tape (Pollit & Bouckaert, 2011; Walker & Brewer, 2008), which was found to be higher among public than private employees (Feeney & Bozeman, 2009; Hansen & Kjeldsen, 2017). The disaggregation from central government allowed agencies to operate in a less politicized environment with less hierarchy and formal constraints. As a result, this would lead to lower levels of perceived red tape. However, agencies are also under political responsibility, which is accompanied by government control (Verhoest, Roness, Verschuere, Rubecksen, & MacCarthaigh, 2010). Given the presence of both organizational autonomy and government control in agencies, it can be expected that their employees perceive less red tape than employees in central government, but more than employees in businesses. Furthermore, as Type 1 agencies have less autonomy and no legal independence, it can be expected that they are confronted with more governmental control than Type 2 agencies. Therefore, it is expected that
Differences in job goal clarity
Another distinction between government-owned and privately owned organizations that is often mentioned is based on goal clarity, influenced by the absence of markets and the presence of politics (Chun & Rainey, 2005; Jung, 2011). As organizational goals signal what the organizational values are and enable employees to provide meaning and direction, a lack of clear organizational goals is detrimental to the existence of the organization (Stazyk, Pandey, & Wright, 2011). Moreover, organizational goals also affect employees because they are “a source of inspiration and direction at the strategic level that often cascades down to the operational level” (p. 612). In this respect, vague and conflicting organizational goals make it difficult to define behavioral and performance outcomes on the job level as well, leading to lower job goal clarity. Although several variations of clarity on the job level exist, such as job specificity (Wright & Davis, 2003) and role ambiguity (Rizzo, House, & Lirtzman, 1970), most share the idea that job goal clarity relates to the ability of employees to evaluate their own behavior or performance, which is increased when goals are highly specific and the relation between behavior and outcome is clear.
As organizational goals have been found to be less tangible and harder to measure in central government compared with businesses (Rainey & Jung, 2010), it is expected that job goal clarity is lower in central government as well. Agencies, in contrast to central government, are predominantly single-purpose organizations with a specific public task to carry out (Verhoest et al., 2012). Therefore, organizational goal clarity will be higher and, consequently, so will be job goal clarity. However, in comparison with profitability goals in businesses, setting goals in public organizations comes with unique challenges (Perry, Mesch, & Paarlberg, 2006). The production or delivery of public goods is generally accompanied with a broader scope of concern and is affected by political compromises, which is less the case for the production and delivery of private goods (Rainey, 2009). This complexity makes it more difficult to define clear performance goals in both central government and agencies than in businesses. Therefore, the following hypothesis is stated:
HRM Practices and Organizational Commitment
Over time, scholars have researched HRM practices using different sources of information (Boon, Den Hartog, & Lepak, 2019). On one hand, many studies on strategic HRM have focused on intended HRM practices (e.g., Farndale & Paauwe, 2007), which reflect the HRM policies that are developed and shared by top management (Becker & Gerhart, 1996). On the other hand, scholars testing the relation between HRM and employee outcomes have mostly focused on how HRM practices are perceived by employees (e.g., Boselie, 2010; Gould-Williams, 2007). Based on the idea that attitudes are mostly influenced by perceptions (Kinnie, Hutchinson, Purcell, Rayton, & Swart, 2005), many scholars have used social exchange theory to explain why perceptions of HRM practices influence employee outcomes (Blau, 1964; Jackson, Schuler, & Jiang, 2014).
According to social exchange theory, HRM practices affect employees because they signal the organization’s intentions toward their employees. In other words, employees make inferences about the intentions of their organization by interpreting its practices (Boselie, 2010). A positive perception of these intentions—that is higher satisfaction with HRM practices—will make employees feel obligated to reciprocate with positive work attitudes and behaviors (Gould-Williams, 2007). With its focus on the individual level, social exchange theory links to the behavioral perspective in HRM literature, which states that HRM practices are one of the primary tools to stimulate employee commitment (Jackson et al., 2014). In this respect, multiple studies found positive effects of satisfaction with HRM practices on employee attitudes, both in public and in private organizations (e.g., Borst, Kruyen, & Lako, 2017; Conway & Monks, 2008; Kinnie et al., 2005; Steijn, 2004).
Whereas employees across central government, agencies, and businesses can place greater value on one HRM practice over the other, the exchange relationship should not be different among organizations. That is, independent of the type of organization, higher satisfaction with HRM practices will be related to higher organizational commitment. Therefore, the following hypothesis is formulated:
Although the relation between satisfaction with HRM practices and commitment may not differ between organizations, scholars have pointed toward the negative impact of perceived red tape and unclear goals in central government on satisfaction with HRM practices and organizational commitment (Brown, 2004; Burke, Noblet, & Cooper, 2013; Rainey, 2009). Below, hypotheses on the different effects of perceived red tape and job goal clarity on satisfaction with HRM practices and organizational commitment in central government, agencies, and businesses are discussed.
Differences in impact of perceived red tape
When employees perceive rules and procedures as burdensome and meaningless, they can become alienated from their organization and work (DeHart-Davis & Pandey, 2005). In this respect, previous findings indeed indicate that perceived red tape is related to work alienation and lower organizational attachment (Pandey & Kingsley, 2000; Pandey & Welch, 2005). If employees are less attached to their organization, they will view their organization’s intentions in the form of HRM practices as less positive. In this respect, it can be expected that higher perceived red tape is related to lower satisfaction with HRM practices.
As discussed before, red tape is expected to be higher in government-owned organizations than privately owned organizations, which results in higher alienation among employees and, hence, lower satisfaction with HRM practices. Furthermore, as the level of red tape is expected to be higher in central government than in both types of agencies, the effect is expected to be stronger in central government than in both types of agencies. Finally, based on the higher levels of red tape in Type 1 than Type 2 agencies, the effect is expected to be stronger in Type 1 than in Type 2 agencies as well. Therefore, the following hypothesis is formulated:
In addition to lower satisfaction with HRM practices, higher perceived red tape may also lead to lower organizational commitment. Scholars have argued that employees who experience burdensome rules and procedures are less committed, because these rules alienate the employee from what they believe are purposeful tasks in their job (Aiken & Hage, 1966; Stazyk et al., 2011). Red tape decreases their opportunity to meaningfully contribute to their organization, which will decrease their organizational commitment. Furthermore, higher perceived red tape further reduces organizational commitment through lower satisfaction with HRM practices. Given the expectations on the levels of red tape across central government, both types of agencies, and businesses, the following hypothesis is formulated:
Differences in impact of job goal clarity
To be effective, many HRM practices rely on goals. For example, Tannenbaum and Yukl (1992) argued that clear objectives or goals are essential for training to be effective. In a similar vein, many motivation-enhancing practices, such as performance-related pay or performance management, are often linked to achieving concrete goals or targets (Ferreira & Otley, 2009). As such, goals have a signaling function in portraying an organization’s intentions toward their employees. Clear goals help employee perceive the organization’s intentions, resulting in higher satisfaction with HRM practices. Lack of clarity, consequently, can lead to lower satisfaction with HRM practices.
Given the ambiguous nature of goals in government-owned organizations, it is expected that job goal clarity has a stronger effect in businesses than in central government and both types of agencies. Similarly, the effect is stronger in both types of agencies than in central government. Given the expectations on the degree of job goal clarity in central government, agencies, and businesses, the following hypothesis is stated:
If employees perceive clear goals, they are able to better perceive the organization’s intentions, leading to higher feelings of attachment to the organization (Hansen & Kjeldsen, 2017; Jung, 2014; Meyer, Stanley, Herscovitch, & Topolnytsky, 2002). Reversely, goals that are vague and conflicting may alienate employees from their work, which, in turn, lowers their organizational commitment. Therefore, it is expected that higher job goal clarity is directly related to higher organizational commitment. Furthermore, higher job goal clarity enhances organizational commitment via satisfaction with HRM practices. Therefore, the following hypothesis is stated:
Method
Data
For this study, secondary survey data collected in 2014 by the Dutch Ministry of Internal Affairs (2015) in the so-called “Personnel and Mobility Survey” were used. Public-sector employees from central, regional, and local government, judiciary, education and research institutions, university hospitals, and legal authorities were invited by letter to fill in a web-based survey using a personal code. In addition, people employed in the private sector were invited as a reference group. In total, 24,334 public-sector employees (response rate: 28%) and 2,227 employees working in businesses filled in the survey. Unfortunately, the response rate for the private sector is unknown.
Participants Selection
From the secondary data set collected by the Dutch government, participants from specific organizations were selected to create four groups. First, the group central government consisted of employees working at the core department of a ministry—also known as ministerial departments, government departments, bureaus, or secretariats. Second, the group Type 1 agencies consisted of employees working at an Agentschap, which is the most common Type 1 agency in the Netherlands (Yesilkagit & Van Thiel, 2012). These agencies perform a variety of public tasks, such as the management of public works and water infrastructure (Rijkswaterstaat) and the payment of student loans (DUO). As Type 1 agencies do not have legal independence, their terms of employment are similar to central government (civil service), their financial records are included in that of their parent ministry, and they are not risk bearers for social and unemployment benefits. Third, the group Type 2 agencies consisted of employees working at a Zelfstandig bestuursorgaan (ZBO), which is the most common Type 2 agency in the Netherlands (Yesilkagit & Van Thiel, 2012). Like Agentschappen, ZBOs carry out different tasks, ranging from the payment of social benefits (UWV) to the protection of person data (Autoriteit Persoonsgegevens). Most Type 2 agencies also have the same terms of employment as central government, although around 25% arrange their own collective labor agreement or follow a sector-wide agreement (De Leeuw, 2013). Furthermore, they must keep their own financial records and they are risk bearers for social and unemployment benefits.
Because the aim of this study was to test expectations of the positive effects regarding NPM, only agencies were selected that were established in 1980 or later. This specific year of establishment was chosen, because it is generally considered to be the beginning of NPM reforms (Van Thiel, 2004). Finally, the group businesses consisted of employees who were selected based on the type of work and industry that best matched the other groups. Therefore, only white-collar employees working in the service sector were selected, for example, in an administrative or financial position. Using this categorization, the final data set contained 502 respondents from central government, 788 from Type 1 agencies, 313 from Type 2 agencies, and 829 from businesses.
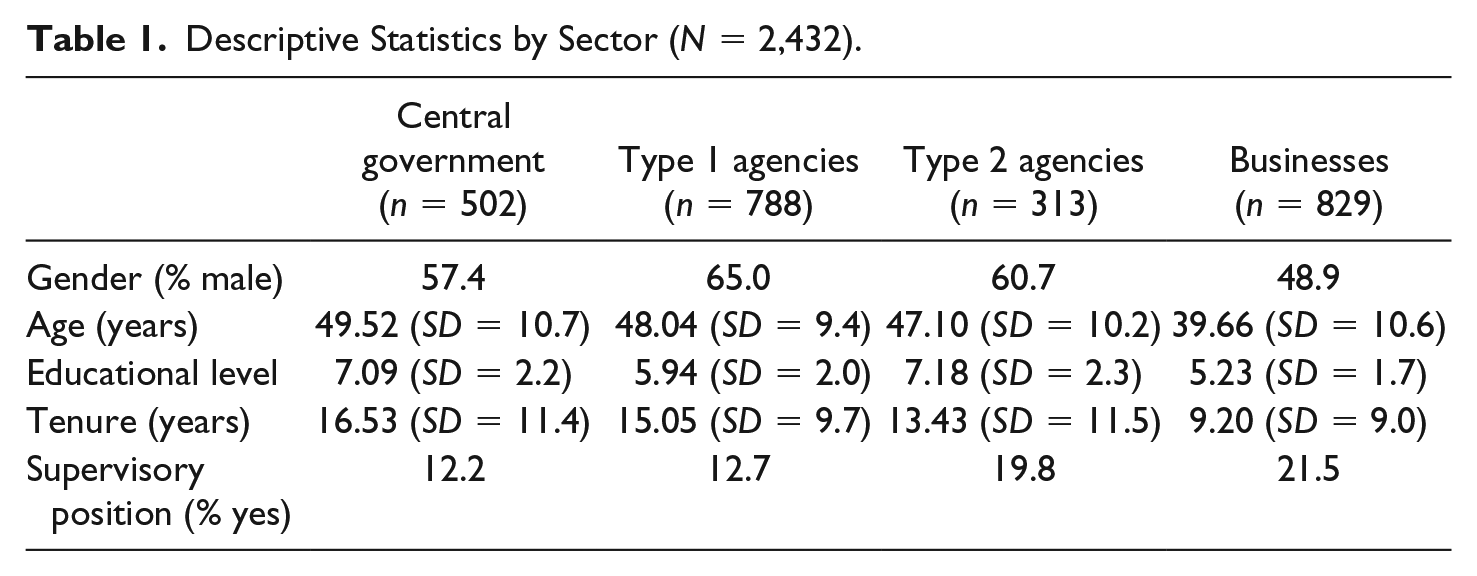
Table 1 shows descriptive information of the sample on various background characteristics that are used as controls in the analyses. As can be seen, there are more females in businesses compared with the other three groups in this sample, and the highest percentage of males is found in Type 1 agencies. Furthermore, in this study’s sample, average age, educational level, and tenure appear to be lowest in businesses, whereas minor differences exist between the other three groups. Finally, a higher percentage of managers is present in Type 2 agencies and businesses compared with central government and Type 1 agencies.
Descriptive Statistics by Sector (N = 2,432).
Measures
For the survey, the Dutch government either developed own scales based on academic literature or adopted existing and validated scales. All items were answered on a 5-point Likert-type scale and represent employee perceptions. With the exception of satisfaction with HRM practices, all scales ranged from 1 (totally disagree) to 5 (totally agree). In Table 2, means, standard deviations, and correlations between all study variables are presented. The questionnaire items are found in Appendix A.
Means, Standard Deviations and Correlations.
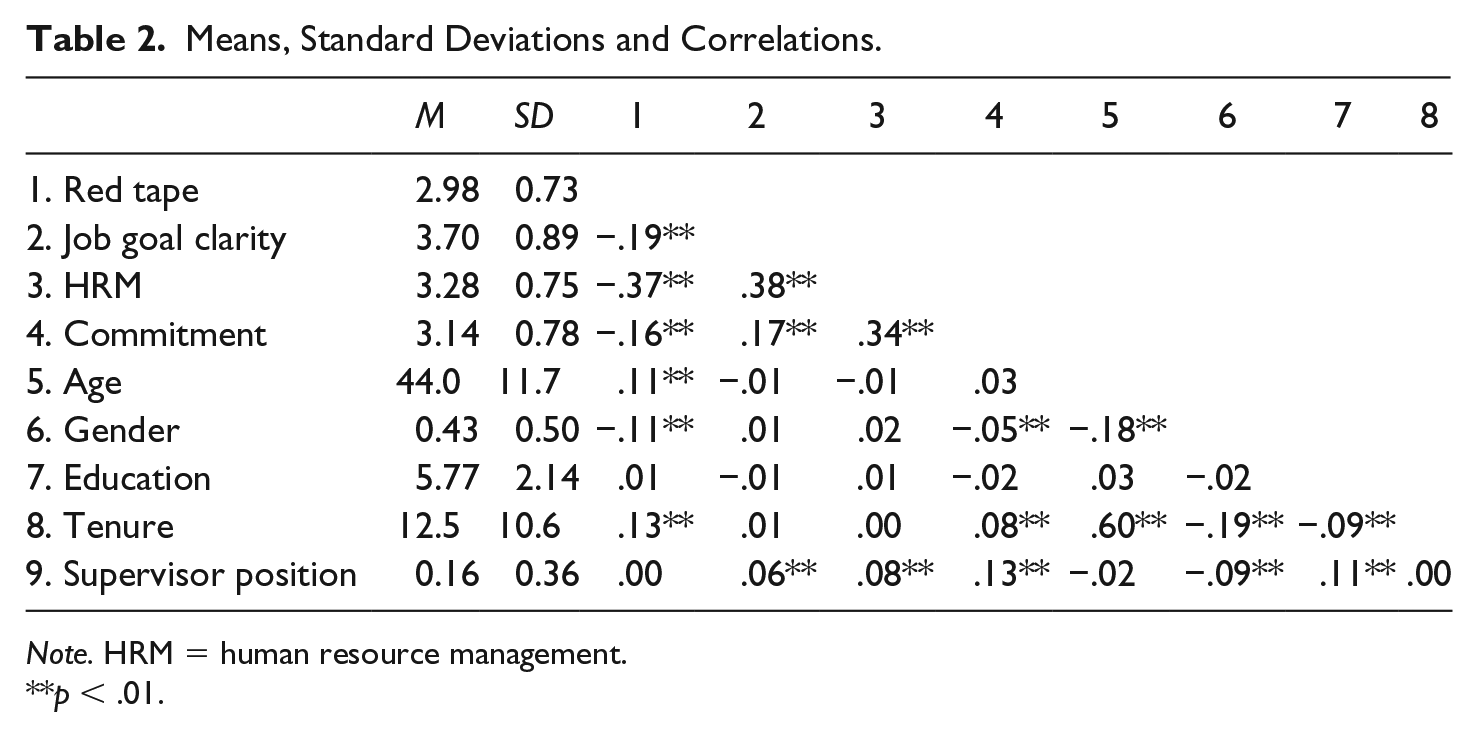
Note. HRM = human resource management.
p < .01.
Red tape
Red tape was measured using six items developed by the Dutch government, which have been applied previously (Borst et al., 2017; Vermeeren & Van Geest, 2012). Although not developed in research, the items are in line with the notion of red tape as a multidimensional construct (Borry, 2016; Van Loon et al., 2016), including both burdensome (e.g., “Complying with all the rules and procedures within my organization takes a lot of time”) and ineffective (e.g., “Rules and procedures in my organization make it difficult to do my job well”) dimensions. The scale showed adequate reliability (α = .83).
Job goal clarity
To measure the degree of job goal clarity, the Dutch government developed two items that focus on the specificity (“My performance goals are easy to measure”) and feasibility of job-level goals (“My performance goals are realistic”). Although these dimensions are only measured by one item each, the items show considerable overlap with (reversed) items from validated scales on job goal specificity (e.g., “My responsibilities at work are very clear and specific”; “It is difficult to evaluate success or failure on my job”; Wright & Davis, 2003) and role constructs (e.g., “I have enough time to complete my work”; “I receive an assignment without the manpower to complete it”; Rizzo et al., 1970). Reliability for this two-item scale, using the Spearman–Brown coefficient (Eisinga, Grotenhuis, & Pelzer, 2013), was adequate (.73).
Satisfaction with HRM practices
In the survey, people were asked to indicate how satisfied they are with various HRM practices (Ministry of Internal Affairs, 2015). In total, six items were used to measure satisfaction with HRM practices, similar to those used in previous literature (e.g., Caillier, 2011; Gould-Williams & Mohamed, 2010; Knies & Leisink, 2014). The items measured satisfaction with career development, communication and information sharing, rewards, performance management, performance appraisal, and work–life balance (α = .82).
Organizational commitment
Organizational commitment was measured using four items derived from a scale developed by Meyer, Allen, and Smith (1993), which has been applied in previous research (e.g., Hansen & Kjeldsen, 2017; Meyer et al., 2002). An example item is, “I experience problems of this organization as my own problems” (α = .83).
Measurement model of the latent constructs
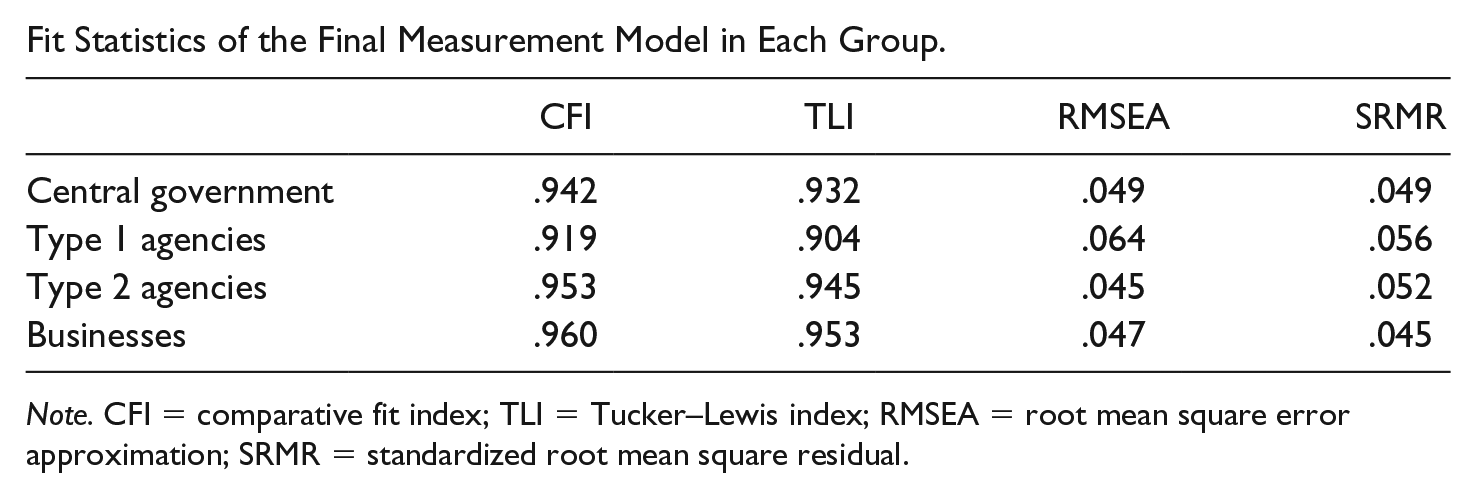
To test whether the latent constructs fit together, a confirmatory factor analysis (CFA) with a robust maximum likelihood (MLR) estimator was conducted, including satisfaction with HRM practices, red tape, job goal clarity, organizational commitment. The results showed adequate model fit (comparative fit index [CFI] = .94; Tucker–Lewis index [TLI] = .93; root mean square error approximation [RMSEA] = .06; standardized root mean square residual [SRMR] = .04). The measurement model also showed adequate fit for each of the four groups separately (see Appendix B for fit statistics per group).
Given the fact that the data come from a single source, common-method variance (CMV) may be an issue (Podsakoff, MacKenzie, Lee, & Podsakoff, 2003). However, the fact that the hypotheses are mainly focused on group differences and as multiple independent variables are included indicates that CMV is not problematic in this study (Siemsen, Roth, & Oliveira, 2010). Furthermore, a Harman’s single factor test was performed in which all items loaded onto one factor. Although criticized, this test can be used to indicate the possible presence of CMV (George & Pandey, 2017). This model had a significantly worse fit compared with the measurement model (CFI = .48; TLI = .43; RMSEA = .15; SRMR = .13).
Control variables
Next to the main variables of interest, gender, age, educational level, tenure, and supervisory position were included as control variables in the analyses. Age and tenure were expressed in number of years. Educational level included 11 subsequent categories ranging from primary education to postgraduate education. Supervisory position was included as a dichotomous variable indicating whether respondents have managerial responsibilities.
Data Analysis
To test the hypotheses, several analytical steps were taken. A series of increasing stringent measurement models using multigroup SEM analyses were tested to establish measurement invariance across all four groups (Van de Schoot, Lugtig, & Hox, 2012). First, establishing configural invariance means that the factor structure is similar across groups, allowing all parameters to be freely estimated. Second, establishing metric invariance means that the meaning attributed to the latent factor by the respondents is similar across groups. In this model, factor loadings are fixed to be equal across groups while the intercepts are freely estimated. Finally, establishing scalar invariance means that the latent factor and the level of the items are similar across groups. In this model, both the loadings and intercept are fixed to be equal across groups. Cut-off criteria of ≤–.005 in CFI and ≤.01 in RMSEA were used for indications of invariance (Chen, 2007).
After establishing measurement invariance, Hypotheses 1 and 2 were tested for differences in latent means across the four groups. Significance in latent mean differences was tested using the Wald test statistic, which equals to a z test in case of a bivariate comparison.
Third, a structural model consistent with the conceptual model was fitted to compare the structural paths to test Hypotheses 3, 4, 5, 6, and 7. Consistent with the results from the measurement invariance tests, the loadings and intercepts of the latent variables were fixed to be equal across groups. Next, regression coefficients between two groups were compared using the Wald statistic. All analyses were conducted using the lavaan package in R (Rosseel, 2012).
Results
In this section, the results from the measurement invariance analyses are presented first. Next, the latent means are compared, followed by the comparisons of the regression coefficients according to the conceptual model.
Measurement Invariance
The results of the multigroup SEM analyses are presented in Table 3. The fit indices of the configural and metric model both showed adequate fit and the metric model was not significantly worse than the configural model (Chen, 2007). Although the scalar model showed adequate fit, the fit indices were significantly worse than the metric model. This lack of scalar invariance indicates that there is a systematic bias in the item intercepts and comparing means using this model is pointless as the latent constructs do not share the same origin or intercept across groups. Thus, full measurement invariance was not established. However, to compare latent means, partial measurement invariance is adequate as well if at least two loadings and intercepts for each latent variable are fixed to be equal across groups (Van de Schoot et al., 2012). After freeing the intercepts of two items of the HRM construct, one item of the commitment construct and one item of the red tape construct, partial invariance was established of the scalar model. This model was used in the subsequent analyses to compare latent means and regression coefficients.
Measurement Invariance Results.
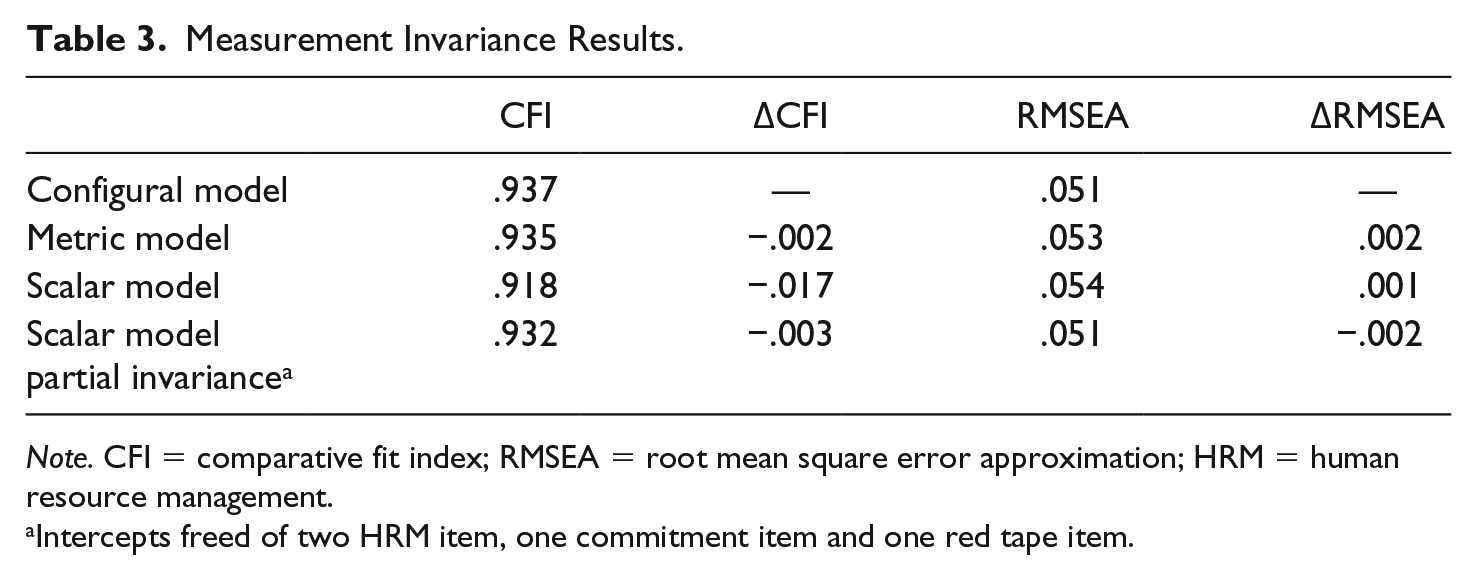
Note. CFI = comparative fit index; RMSEA = root mean square error approximation; HRM = human resource management.
Intercepts freed of two HRM item, one commitment item and one red tape item.
Comparing Latent Means
Using the partial invariance scalar model, latent means of perceived red tape and job goal clarity were compared to test Hypotheses 1 and 2. In Table 4, the latent means and standard errors are shown.
Latent Means and Standard Errors Across Sectors.
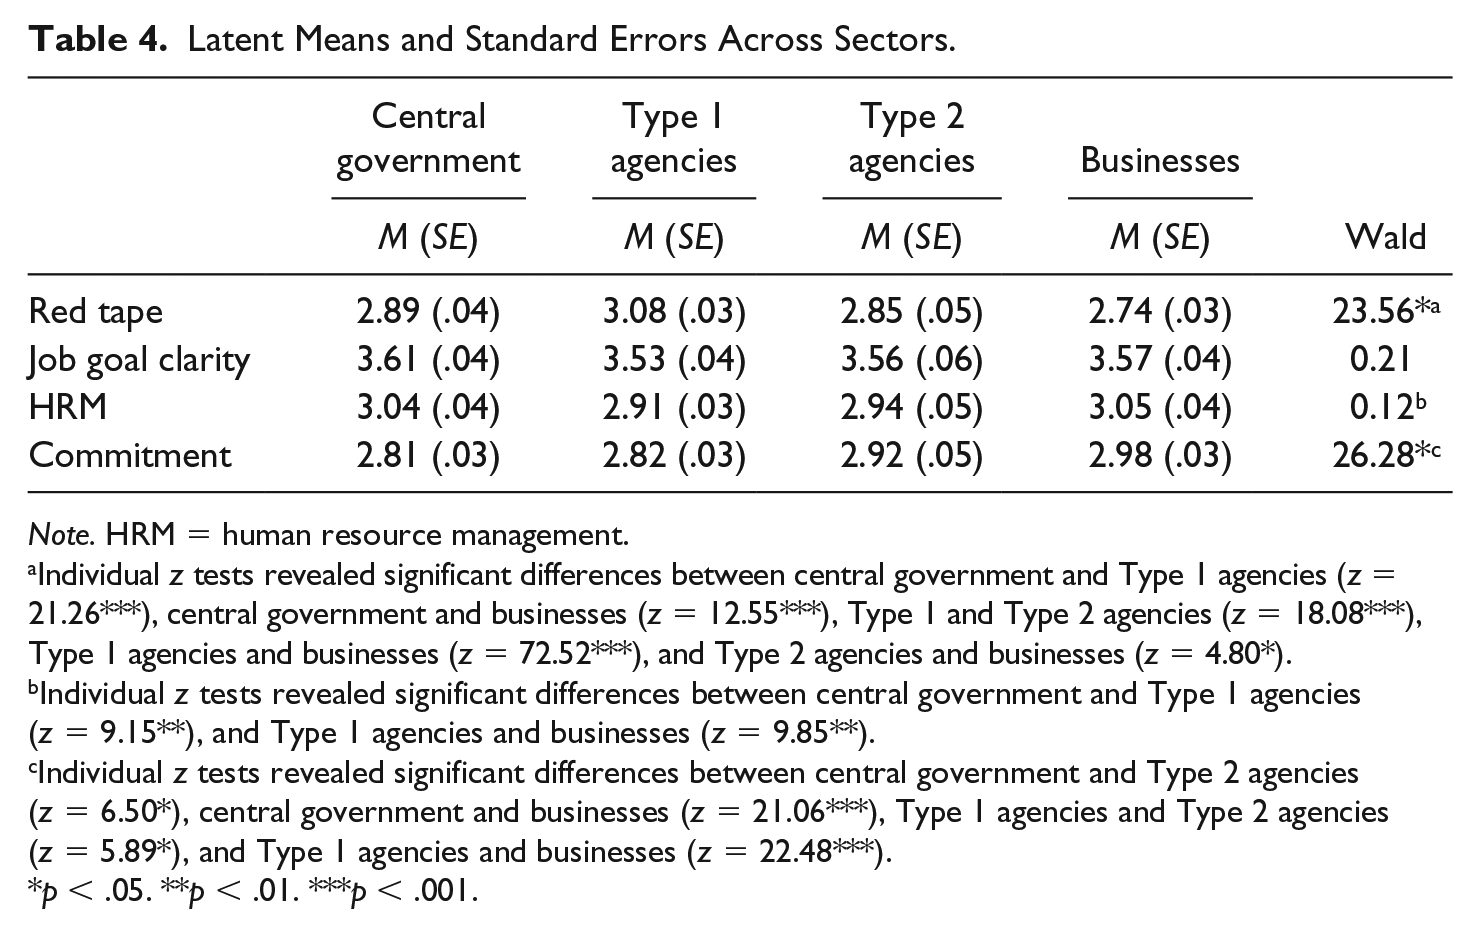
Note. HRM = human resource management.
Individual z tests revealed significant differences between central government and Type 1 agencies (z = 21.26***), central government and businesses (z = 12.55***), Type 1 and Type 2 agencies (z = 18.08***), Type 1 agencies and businesses (z = 72.52***), and Type 2 agencies and businesses (z = 4.80*).
Individual z tests revealed significant differences between central government and Type 1 agencies (z = 9.15**), and Type 1 agencies and businesses (z = 9.85**).
Individual z tests revealed significant differences between central government and Type 2 agencies (z = 6.50*), central government and businesses (z = 21.06***), Type 1 agencies and Type 2 agencies (z = 5.89*), and Type 1 agencies and businesses (z = 22.48***).
p < .05. **p < .01. ***p < .001.
For perceived red tape, the results showed that employees in Type 1 agencies perceive significantly higher red tape than employees in the other groups. Furthermore, employees in businesses perceive significantly lower red tape than employees in the other groups. No further significant differences were found. Therefore, Hypothesis 1 is only partially supported. For job goal clarity, no significant differences were found. Therefore, Hypothesis 2 is rejected. In addition to perceived red tape and job goal clarity, several significant differences were found for the other latent variables. Employees in Type 1 agencies are significantly less satisfied with HRM practices than employees in central government and businesses. Furthermore, employees in central government are significantly less committed than employees in Type 2 agencies and in businesses. Similarly, employees in Type 1 agencies are less committed than employees in Type 2 agencies and in businesses.
Structural Model
To compare the regression coefficients between groups, a full structural model was fitted with parameters fixed to be equal across groups consistent with the partial invariance scalar model. A model consistent with the conceptual model and with the inclusion of the control variables showed adequate fit (CFI = .92, TLI = .91, RMSEA = .05, SRMR = .05). Across sectors, the model explains 21.5% to 46.7% of the variance in satisfaction with HRM practices and 12.8% to 25% of the variance in organizational commitment. The results of the structural path analyses are found in Table 5.
Structural Path Analyses.
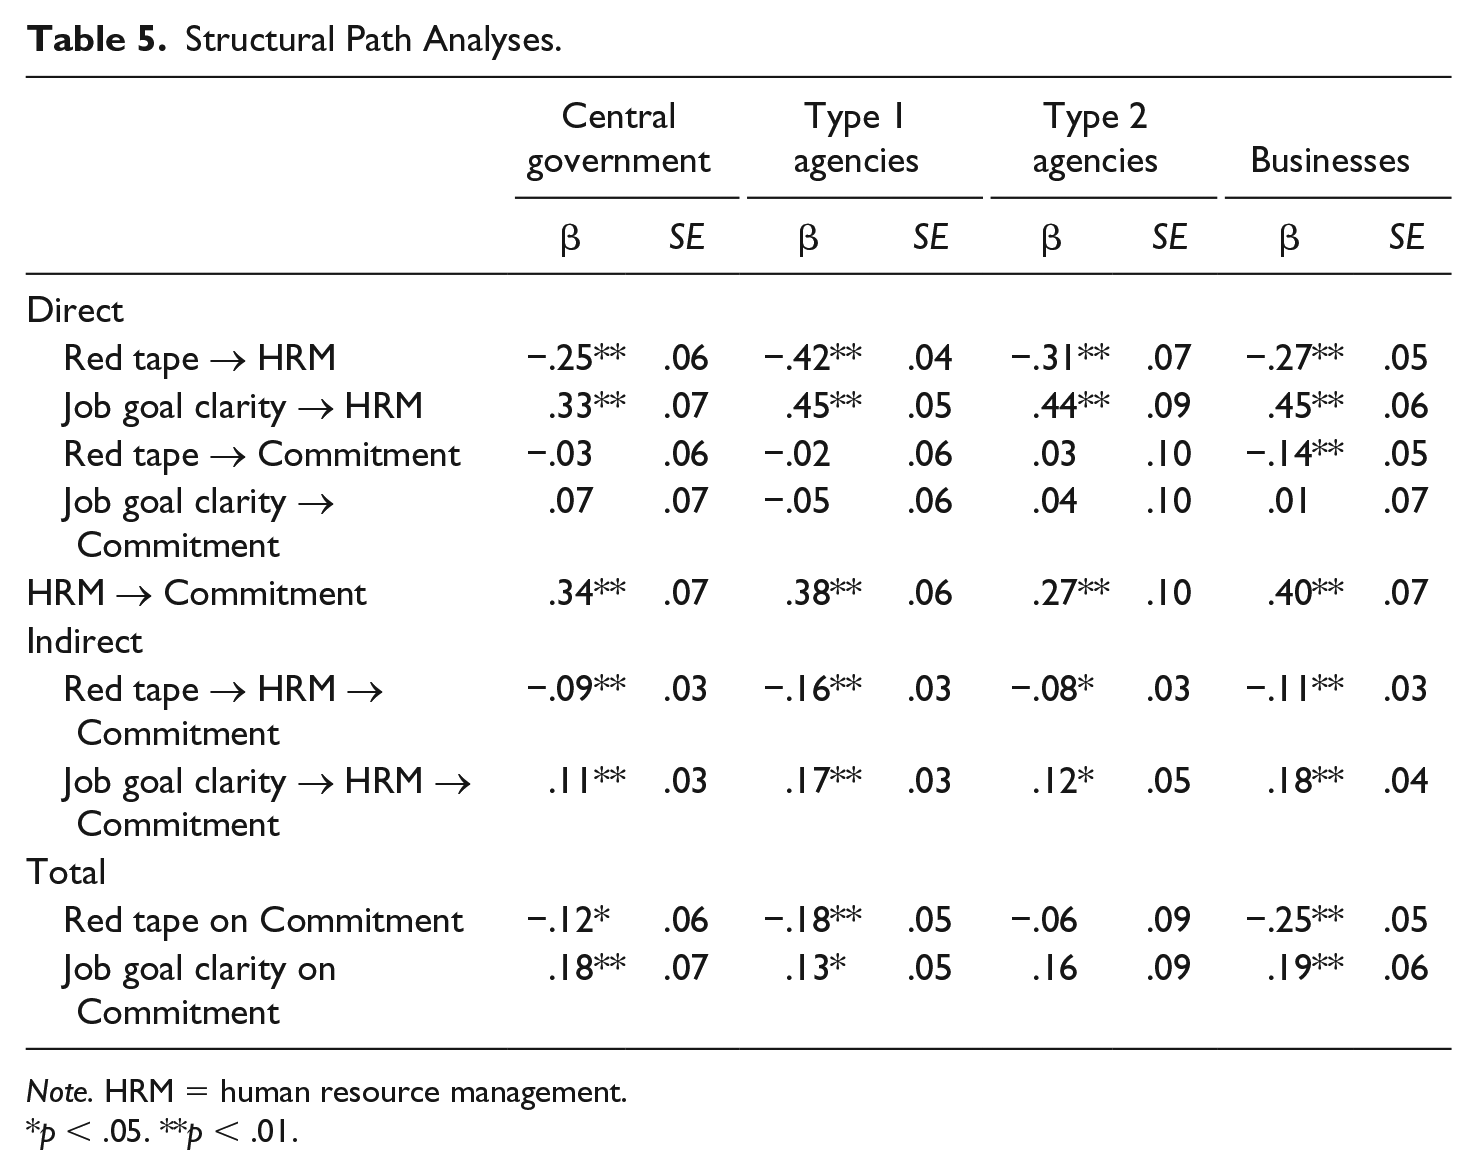
Note. HRM = human resource management.
p < .05. **p < .01.
As expected, satisfaction with HRM practices is positively related to organizational commitment (β = [.27, .40]) in all four sectors, although the effect sizes differ slightly. Therefore, Hypothesis 3 is supported. Perceived red tape has a significant negative effect on satisfaction with HRM practices in all four groups (β = [–.25, –.42]). The strongest effect was found in Type 1 agencies, which is significantly stronger than in central government (βdiff = .17, p < .05) and in businesses (βdiff = −.15, p < .05). No other significant differences were found. Of these findings, only the stronger effect of perceived red tape in Type 1 agencies compared with businesses was expected. Therefore, Hypothesis 4 is only partially supported.
Contrary to the expectations, perceived red tape only has a significant effect on organizational commitment in businesses (β = −.14, p < .01). Perceived red tape does have a significant effect on organizational commitment through satisfaction with HRM practices (β = [–.08, –.16]) in all groups. No significant differences on the total effect of perceived red tape on organizational commitment were found between groups. Therefore, Hypothesis 5 is rejected. Job goal clarity has a significant positive effect on satisfaction with HRM practices in all groups (β = [.33, .45]). However, no significant differences were found among the groups. Therefore, Hypothesis 6 is rejected.
Finally, job goal clarity has no significant effect on organizational commitment in either one of the groups. Similar to red tape, job goal clarity has a significant effect on organizational commitment through satisfaction with HRM practices (β = [.11, .18]). The total effect of job goal clarity is stronger in businesses than in Type 2 agencies (βdiff = .21, p < .05). No other significant differences in total effects were found. Therefore, Hypothesis 7 is partially supported.
Discussion
The aim of this study was to empirically test the effects of perceived red tape and job goal clarity on satisfaction with HRM practices and organizational commitment across central government, two types of agencies, and businesses. As such, this study adds to previous studies that compared the public and private sector by including agencies as distinct organizations from central government. Furthermore, this study contributes to literature testing the expected benefits of creating agencies that operate at arm’s length of central government (e.g., Kim & Cho, 2014; Overman & van Thiel, 2015). In general, the findings showed little evidence that agencies resemble businesses in terms of bureaucracy and their ability to stimulate employee commitment. In fact, some results even suggest that agencies are more bureaucratic than central government.
This study showed that employees in government organizations (both central government and agencies) perceive more red tape than employees in businesses (Feeney & Bozeman, 2009; Pandey & Kingsley, 2000). This finding confirms the notion that the public sector is associated not only with necessary rules and procedures, but also with rules that are viewed as burdensome and ineffective by employees. In addition, employees in Type 1 agencies perceive more red tape than employees in central government and Type 2 agencies. Although these agencies have been created to increase flexibility and to decrease hierarchy (Dunleavy et al., 2005; Kickert, 2001), it appears that this has not resulted in less perceived red tape. A possible explanation for this finding is that the autonomy granted to Type 1 agencies is accompanied with stricter governmental control, also referred to as the “agencification paradox” (Smullen, Van Thiel, & Pollit, 2001; Verschuere, 2007). Given the lack of legal independence, it may not be surprising that this paradox seems to be present in Type 1 agencies, but not in Type 2 agencies.
In contrast to the clear public–private distinction on the level of perceived red tape, the effect of perceived red tape on satisfaction with HRM practices and organizational commitment is less straightforward. First, in line with the high levels of perceived red tape in Type 1 agencies, the negative effect on satisfaction with HRM practices is also stronger than in the other types of organizations. Thus, in cases of an “agencification paradox,” the relatively high degree of control does not only affect the organization, but also has negative consequences for employees. However, despite the higher levels of perceived red tape in central government and Type 2 agencies compared with businesses, the effect is equally negative across these three groups. Perhaps employees in many government organizations have learned coping mechanisms to deal with high levels of perceived red tape (Feeney & Bozeman, 2009), and stronger negative effects are only found when a certain threshold is passed, as in the case of Type 1 agencies.
Second, the finding that perceived red tape only has a small negative effect on organizational commitment in businesses is not in line with the notion that red tape alienates employees from work (DeHart-Davis & Pandey, 2005), but it is in line with findings from Hansen and Kjeldsen (2017). A possible explanation can be found in the motivation to serve the public interest that employees in government organizations possess more strongly than employees in businesses (Taylor, 2010). As employees are motivated to serve the public interest, feeling committed to the organization is probably more directly related to the ability of government organizations to fulfill this need than to other organizational determinants. This explanation is further strengthened by the finding that job goal clarity is not related to organizational commitment either.
Given the positive relation between satisfaction with HRM practices and organizational commitment in all four groups, this study corroborates with previous research stating that government organizations can benefit from the adoption of “business-like” HRM practices (Blom, Kruyen, Van der Heijden, & Van Thiel, 2018). In addition, this study shows that this positive relation is further enhanced when there is a high degree of job goal clarity, a finding which holds for all organizations. In contrast, perceived red tape is negatively related to satisfaction with HRM practices, indicating that perceived red tape is detrimental for organizational commitment indirectly. Given previous findings on the important role of satisfaction with HRM practices in other employee outcomes, such as satisfaction with work–life balance (Conway & Monks, 2008) and turnover intentions (Borst et al., 2017), perceived red tape and job goal clarity are probably important antecedents that should be taken into account in research and practice.
Limitations and Suggestions for Future Research
One of the main limitations of this study is the cross-sectional nature of the data. Although common-method bias may influence the study’s main effects, the focus on group differences makes this issue less problematic. Nevertheless, the data make it impossible to compare organizations over time. Type 1 agencies are usually established by hiving off a unit from central government. So, it may be possible that differences in perceived red tape and organizational commitment existed before the “agencification.” Therefore, longitudinal research, examining the process of “agencification,” would be better able to attribute any changes in employee outcomes to changes in organizational structure.
As the survey was not specifically developed for this study, some measures were not optimal. Only the measure for organizational commitment was adopted from previous research, although items from the other constructs were based on academic literature. Nevertheless, items for red tape and job goal clarity seemed to adequately capture dimensions posed in previous studies. However, more attention should be given to the measurement of satisfaction with HRM practices. This measure is limited to the six practices discussed above, whereas there are numerous other HRM practices that might be worth to include (Posthuma, Campion, Masimova, & Campion, 2013). Although it could be expected that the exchange relationship between satisfaction with HRM practices and organizational commitment does not change, the strength of the relationship could vary depending on the specific HRM practices used. Future research should examine differences in the effects of other practices, such as recruitment and selection, employee participation, and talent management, to show whether they have similar effects.
In this study, only hypotheses regarding perceived red tape and job goal clarity were tested. These are key concepts in debates on public–private distinctions and often used as motives for governments to create semi-autonomous agencies. However, there are other concepts that may play an important role in explaining differences between organizations. For example, it has been argued that government employees exhibit higher levels of public service motivation (PSM) than business employees, and that PSM has an impact on other attitudes and behavior (Kjeldsen & Hansen, 2018; Taylor, 2010). Also, scholars have shown differences in organizational values across sectors, which have a possible impact on employee outcomes (Buelens & Van den Broeck, 2007; Van der Wal & Huberts, 2008). It would be valuable if future research examines whether and how these other concepts differ in agencies compared with both central government and businesses.
Footnotes
Appendix A
Appendix B
Fit Statistics of the Final Measurement Model in Each Group.
| CFI | TLI | RMSEA | SRMR | |
|---|---|---|---|---|
| Central government | .942 | .932 | .049 | .049 |
| Type 1 agencies | .919 | .904 | .064 | .056 |
| Type 2 agencies | .953 | .945 | .045 | .052 |
| Businesses | .960 | .953 | .047 | .045 |
Note. CFI = comparative fit index; TLI = Tucker–Lewis index; RMSEA = root mean square error approximation; SRMR = standardized root mean square residual.
Declaration of Conflicting Interests
The author(s) declared no potential conflicts of interest with respect to the research, authorship, and/or publication of this article.
Funding
The author(s) received no financial support for the research, authorship, and/or publication of this article.