
Abstract
How do individuals’ network selection decisions create unique network structures? Despite broad sociological interest in the micro-level social interactions that create macro-level network structure, few methods are available to statistically evaluate micro-macro relationships in social networks. This study introduces a general methodological framework for testing the effect of (micro) network selection processes, such as homophily, reciprocity, or preferential attachment, on unique (macro) network structures, such as segregation, clustering, or brokerage. The approach uses estimates from a statistical network model to decompose the contributions of each parameter to a node, subgraph, or global network statistic specified by the researcher. A flexible parametric algorithm is introduced to estimate variances, confidence intervals, and p values. Prior micro-macro network methods can be regarded as special cases of the general framework. Extensions to hypothetical network interventions, joint parameter tests, and longitudinal and multilevel network data are discussed. An example is provided analyzing the micro foundations of political segregation in a crime policy collaboration network.
Micro-macro network analysis is concerned with how individuals’ network selection decisions (micro-level) create unique network structures (macro-level). Micro-macro questions have inspired core theoretical work in sociology and have spurred a large research program in the social sciences (Coleman 1990; Granovetter 1973; Hedstrom and Bearman 2011), yet few methods are available to statistically evaluate the effect of network selection processes (e.g., homophily 1 and reciprocity) on unique network structures, such as segregation and clustering. Prior studies have primarily developed statistical models that treat the entire network as the dependent variable (Butts 2008; Frank and Strauss 1986; Snijders 2001). These models enable researchers to test the micro selection mechanisms that affect tie formation, but they are not designed to evaluate the effects of such mechanisms on unique, macro-level network structures.
Yet foundational sociological theory emphasizes the effects of specific network structures on individual and group outcomes. Contact theory, for example, argues that network segregation increases group prejudice and discrimination by decreasing the quality and quantity of intergroup contact (Allport 1954). “New” economic sociology theory emphasizes how exchange structures, such as consolidation, brokerage, and clustering, affect performance in competitive markets (Burt 1992; Granovetter 1985; White 1981). Putnam (2001) argues that decreases in network cohesion contribute to alienation and lower civic engagement.
Because specific network structures are implicated in a broad range of theory, recent studies have dedicated substantial empirical attention to exploring the micro foundations of specific network structures (Arvidsson, Collet, and Hedstrom 2021; Block 2018; Goldenberg et al. 2022; Huang and Butts 2023; McMillan, Kreager, and Veenstra 2022; Melamed et al. 2020; Schaefer et al. 2023). Bearman, Moody, and Stovel (2004) provide a classic example in adolescent romantic networks. They study how strong norms that discourage adolescents from dating their exes’ current partner’s exes create expansive chain-link structures that optimize sexually transmitted disease diffusion. Block (2023) used job mobility networks to show that 18 percent of occupational sex segregation in the United Kingdom can be explained by men leaving feminizing professions. The common thread in these studies is that the outcome of interest is a unique network structure—brokerage, clustering, chain-link structures, or segregation—rather than the presence or absence of a tie.
In this study, I introduce a general methodological framework for the statistical evaluation of micro-macro network effects. The framework is intended to address questions that treat a specific network structure as the dependent variable. I use the term “macro” to refer to network statistics calculated on either nodes, groups, or the complete network. These statistics may represent individual outcomes like brokerage positions or individual network embeddedness (see Uzzi 1997), group outcomes like the composition of a densely clustered subgroup, or global outcomes like segregation. “Micro” processes refer to the individual selection decisions that determine whether two nodes are connected. They are represented by statistics at the dyad level, such as whether two individuals are the same race, gender, or age. The framework can be used to address questions such as the following: How do firms obtain brokerage positions in competitive markets (see Burt 1992)? How much clustering in friendship networks is explained by preferences for socially similar peers? What selection processes create political segregation in policy networks?
Prior studies have introduced simulation-based methods for micro-macro network analysis (Robins, Pattison, and Woolcock 2005; Snijders and Steglich 2015). I synthesize and build on these approaches to make several contributions. First, whereas prior methods have been developed within model-based frameworks for cross-sectional data, our approach is general; it can be applied to a wide range of models and data structures. Second, prior methods do not define a numeric estimand that captures the strength of the micro-macro relationship, complicating statistical inference and effect size interpretation (see Lundberg, Johnson, and Stewart 2021). We address this limitation by (1) introducing the micro effect on macro structure (MEMS) as a quantity of interest, (2) developing a new flexible estimation algorithm, and (3) outlining assumptions necessary to interpret the MEMS. Third, our framework can be used to evaluate hypothetical interventions, conduct joint parameter tests, and analyze multilevel and longitudinal network data, each of which are increasingly examined in applied research but have received limited attention in the methodological literature on micro-macro analysis. The method is implemented in the netmediate R package available in the Comprehensive R Archive Network (https://cran.r-project.org/web/packages/netmediate/index.html).
Micro-Macro Analysis in Networks Research
A large body of social science research examines micro-macro network relations (e.g., Arvidsson et al. 2021; Block 2023; Henry, Pralat, and Zhang 2011; Huang and Butts 2023; McMillan and Felmlee 2020; McMillan and Schaefer 2021; McMillan et al. 2022; Melamed et al. 2020; Robins et al. 2005; Snijders and Steglich 2015). Perhaps the most famous example is the relationship between segregation and homophily (McPherson, Smith-Lovin, and Cook 2001; Melamed et al. 2020). Social networks are characterized by group segregation, but segregation may not result from individuals’ choice-based preferences to befriend similar peers (homophily). Segregation may be shaped by avoidance of different group members (Henry et al. 2011), propinquity, tendencies to befriend friends’ friends (Goodreau, Kitts, and Morris 2009), or social exclusion (Lee and Butts 2020). Thus, the empirical task is to determine which selection mechanism, or combination of mechanisms, among many possible mechanisms is responsible for segregation.
Prior work has advanced two methods for examining micro-macro relations in cross-sectional networks. Robins et al. (2005) developed a method for the exponential random graph model (ERGM) framework that involves prespecifying ERGM parameters and then simulating a distribution of graph statistics using a Metropolis-Hastings algorithm. The resulting graph distribution provides a hypothetical account of what a macro statistic might be if a network parameter were held at a given value. Snijders and Steglich (2015) proposed a similar approach for stochastic actor-oriented models (SAOMs); they show that researchers can calibrate SAOM parameters to cross-sectional networks by specifying an artificially large rate parameter and allowing the SAOM to converge to the cross-sectional network. Researchers can then initiate an agent-based simulation using the SAOM parameters to explore which macro outcomes are sensitive to specific parameter values.
These methods rely on visual inspections of simulated graph distributions from prespecified model parameters but do not specify a formal quantity (estimand) that captures the strength of the observed micro-macro relationship in empirical settings. As a result, many practitioners rely on ad hoc procedures. The most common practice is a variant of what Huang and Butts (2023) referred to as “knock out” experiments (see Block 2018, 2023; McMillan and Felmlee 2020; McMillan et al. 2022). First, a researcher simulates a distribution of networks on the basis of a fitted model. Second, the researcher simulates a second distribution while holding a focal parameter at zero. This creates a counterfactual scenario where the micro process of interest makes no contribution. The two graph distributions are then compared.
These methods provide important tools for micro-macro analysis, but current practices are limited by a lack of formal specificity. Specifically, current methods do not define an estimand, outline its desirable properties, or discuss necessary assumptions. The lack of formal specificity creates three common problems in micro-macro network analysis.
The first problem is that changing a parameter value may yield a numerically large but statistically nonsignificant change in the macro outcome focal to the analysis. Current methods manipulate the value of model parameters when simulating networks but do not account for uncertainty (variance) in those parameter estimates. Consequently, current practices can favor the largest effects in the model, even if those coefficients are nonsignificant or have a highly variable effect on the macro outcome. Because prior methods do not define an estimand or estimate its variance, empirical applications are limited in their ability to systematically account for spuriousness when interpreting micro-macro network effects.
A second problem is that logically implied micro-macro relations can be misleading and thus require formal evaluation. Arvidsson et al. (2021), for example, showed that recruitment through personal networks decreases labor market segregation by increasing retention of underrepresented groups. This finding challenges the theoretical expectation that network recruitment increases labor market segregation because of homophily in employee personal networks. Goldenberg et al. (2022) found that political segregation in social networks (“echo chambers”) arises from tendencies to affiliate with other individuals who hold more extreme political views (acrophily), rather than views that closely match one’s own views (homophily).
The third problem relates to effect size. Because current micro-macro network methods do not specify target quantities, effect size assessments are typically conducted on an ad hoc basis with limited comparison with alternative explanatory mechanisms. Researchers currently have little guidance on determining how much a micro mechanism contributes to an aggregate outcome or how the effect of a focal mechanism compares to alternative mechanisms. Because multiple micro mechanisms can generate the same network structures (Faust 2007; Goodreau et al. 2009), researchers would ideally be able to interpret numeric quantities that enable them to directly assess the overall and relative contributions of multiple mechanisms to the macro outcome focal to the analysis and to test the statistical significance of those relationships.
Figure 1 illustrates these issues using a conceptual example of political segregation in policy networks. The most commonly posited mechanism for political segregation in policy networks is political homophily, or choice-based preferences to form social relationships with members of the same political party (Desmarais et al. 2015; Neal 2020). However, because of strong racial, gender, and age homogeneity within each party—the Republican Party is dominated by older white men, whereas the Democratic Party is younger and more diverse—homophily on race, gender, or age could create political segregation even in the absence of political homophily. Prior studies have also documented reliance on third-party affiliates and norms of reciprocity to guide policy collaborations (Brandenberger 2018; Cranmer and Desmarais 2011). Either of these mechanisms could create political segregation, even without homophily, by increasing clustering within political groups.
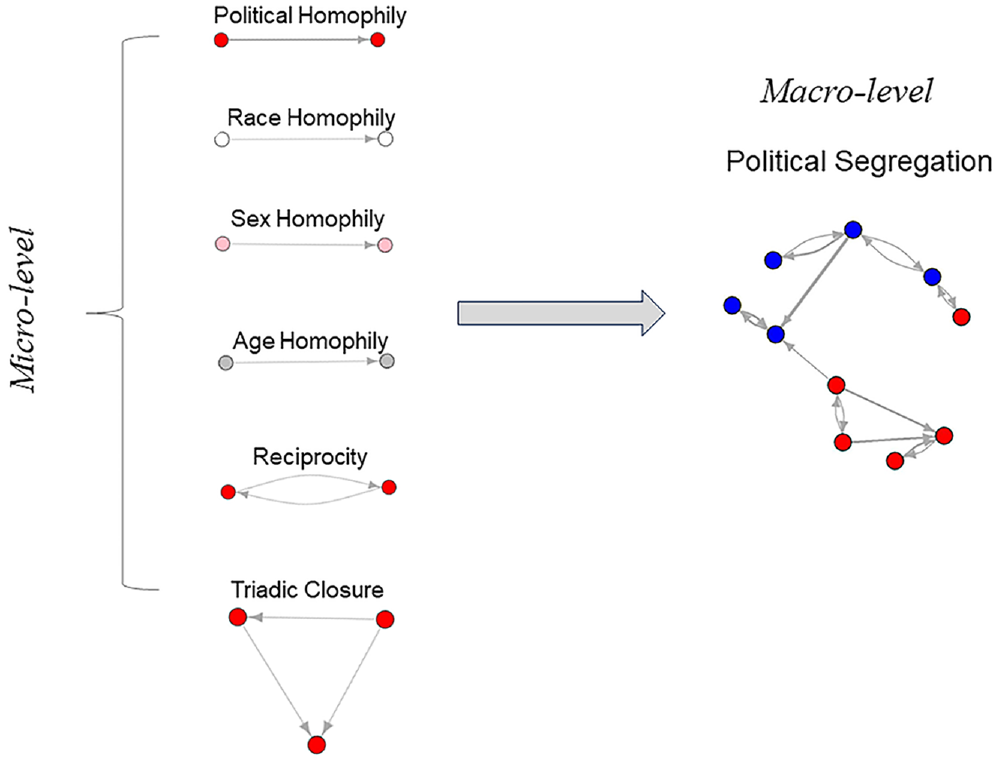
Micro foundations of political segregation in policy networks.
In summary, statistical evaluation of micro-macro network effects has been hampered by a lack of formal specificity. This lack of specificity problematizes statistical inference, can support misleading results, and inhibits effect size comparisons. I synthesize and build on insights from prior research to advance a general methodological framework for micro-macro network analysis. The framework defines an estimand, clarifies assumptions necessary for interpretation, introduces a new estimation algorithm, and has straightforward extensions to hypothetical interventions, joint parameter testing, and longitudinal and multilevel network data.
The Micro Effect on Macro Structure
Model Requirements
Following prior studies, I situate the micro-macro analysis in a postestimation framework that assumes a statistical network model. I represent the model using generic notation to preserve the generality of the method. I begin by assuming a single cross-sectional network A, which may be either binary or valued; we later extend the framework to multilevel and longitudinal network data.
The generative model for A is a function of a statistic representing a micro process of interest X and a vector of statistics Z that represent the potentially confounding covariates not focal to the analysis:

Equation (1) presents a statistical network model for A. X is a statistic representing the micro process of interest with parameter
The generic function
Defining the Micro Effect on Macro Structure
I begin by assuming a single global macro outcome before generalizing to node and subgraph measures. Let M represent a macro statistic calculated on A. M may be a measure of segregation such as the Freeman index, a measure of social cohesion like size of the largest clique, or a measure of clustering like transitivity. M may also be a complex function of multiple measures. For example, M may capture the “small-worldness” of a network with the small-world ratio, which is the global clustering coefficient divided by the mean geodesic distance (Cho and Fowler 2010; Watts and Strogatz 1998). The quantity of interest is the portion of M explained by X, which we refer to as the MEMS.
To start, we can reexpress M as a function of the observed network,
The portion of M explained by X is the change in M under the counterfactual condition when X has no effect on tie formation. Denote the counterfactual with

The MEMS captures the increase or decrease in M when X contributes to network structure compared with when it does not. The notation
The MEMS represents the portion of M that is explained by X. For example, if M is a measure of segregation and X is a statistic representing triadic closure (e.g., a geometrically weighted edgewise partnership term), the MEMS represents the change in segregation that would be expected if triadic closure had no effect on network selection. A larger MEMS suggests a greater share of M can be explained by X. In practice, estimates are sensitive to baseline values of M. For example, measures of clustering, such as transitivity, often scale with network size, meaning the MEMS will usually be smaller for a large network compared with a small network. Relativity can be captured by interpreting the MEMS with respect to

This represents the percentage of M explained by the micro process focal to the analysis.
Researchers are often interested in treating node and subgraph measures as the outcome variable. For example, organizational researchers examine how individuals become brokers in organizational settings (Burt 1992). Recent statistical methods have been developed to examine why actors select into and create groups of varying size and composition (Hoffman, Block, and Snijders 2023). In these instances, the theoretical question is not about a single, network-level statistic (e.g., segregation), but about the composition and size of groups and individuals’ relative positions within social networks.
We can accommodate node and subgraph outcomes by using the change in a node or subgraph statistic under the counterfactual described above. Node-level outcomes may include measures of brokerage like betweenness centrality, measures of individual embeddedness like the local clustering coefficient, or measures of individual influence like Bonacich centrality. Subgraph outcomes may include group-level measures like the size of a densely clustered community (e.g., Newman 2006), the composition of a network component, or the average number of collaborations within a political party in a policy network.
Let i = 1, 2, . . . n index the subglobal unit of analysis. This may be a node, network component, community, or other subglobal unit specified by the researcher.

Equation (4) can be interpreted as the mean change in M when a selection mechanism contributes to tie formation compared with when it does not. It represents the effect of X on the mean value of
An appealing property of equation (4) is that it reduces to equation (2) when n = 1. Thus, calculation of the MEMS is constant for node, subgraph, and global statistics. The percent change is

In addition to providing an intuitive interpretation, an advantage of the MEMS is that it can be used to compare effect sizes. The MEMS represents the total contribution of each network selection mechanism to a macro outcome, so the difference in the MEMS for two micro processes represents the difference in the total contributions of each selection mechanism to a focal network structure (Indlekofer and Brandes 2013). For example, if we are interested in the effect of preferences for politically similar alters (homophily) as opposed to politically extreme alters (acrophily) on political segregation in social networks (Goldenberg et al. 2022), we could estimate the MEMS for homophily and acrophily separately, treating political segregation as the outcome variable. A larger MEMS for acrophily compared with homophily would indicate that preferences for politically extreme alters contribute to a larger portion of political segregation than do preferences for politically similar alters.
Assumptions
The formal specification above defines a quantity of interest that can be generically obtained from a wide range of parametric network models. Interpretation of the MEMS is consistent across research settings, meaning researchers can use the MEMS in empirical applications to test hypotheses when the outcome variable of theoretical interest is a global, group-level, or individual-level network measure. We now discuss assumptions necessary to obtain informative values of the MEMS. The key assumption in our framework is that M can be expressed as a function of
Because the MEMS assumes that
For this reason, a related assumption is that
Distinct models have distinct capabilities for handling endogeneity issues. In longitudinal network models, this problem is usually handled by conditioning network change on prior observations (Butts 2008; Snijders 2001), such that any triadic closure at an earlier time point is sequentially exogenous (i.e., temporally prior) with respect to clustering at a later time point. In cross-sectional data, ERGM handles this problem by considering the potential outcome networks implied by a change in the level of triadic closure for all dyads. However, some models, such as generalized linear models, do not address this type of endogeneity. For example, if
A related problem is endogeneity between actor attributes and network characteristics. Some macro outcome variables are a function of both individuals’ network connections and the attributes of actors nested within networks. Common examples include measures of segregation, group composition, and behavioral similarity. For example, similarity in delinquent behavior in adolescent networks may arise because adolescents select into peer groups with similar levels of delinquency or because peer delinquency influences individual delinquency (Hirschi 1969; Sutherland 1942). If a researcher specifies
This problem can be handled with proper model selection for the macro outcome focal to the analysis. In longitudinal data, the SAOM for the coevolution of behaviors and networks disentangles selection and influence processes (Steglich, Snijders, and Pearson 2010). In cross-sectional data, Fellows and Handcock’s (2013) exponential random network model allows endogeneity between individual attributes and network ties. Either of these models would be appropriate for examining similarity in delinquent behavior within the MEMS framework.
The main point here is that appropriate model selection and specification is necessary to interpret the MEMS. If the functional form of
Estimation Algorithm
I now introduce a flexible parametric algorithm that can be used to estimate the MEMS. The estimation algorithm has four goals. First, the MEMS estimates should account for the variance of parameter estimates. Second, we want to estimate the variance of the MEMS to permit statistical evaluation. Third, the algorithm should make flexible assumptions to allow a wide range of parametric network models. Fourth, the algorithm should be relatively computationally inexpensive to use in even large networks.
The algorithm builds on algorithms commonly used in computational statistics to accomplish each of these goals (Imai, Keele, and Tingley 2010; King, Tomz, and Wittenberg 2000). The general logic of our algorithm is to use the parameter and variance estimates from a fitted model to create a distribution of potential outcome networks. The algorithm the model parameters follow a multivariate normal distribution and that the distribution can be approximated using the model parameter and variance estimates.
3
I use hat notation to denote estimates.
Pseudocode for Estimation Algorithm.
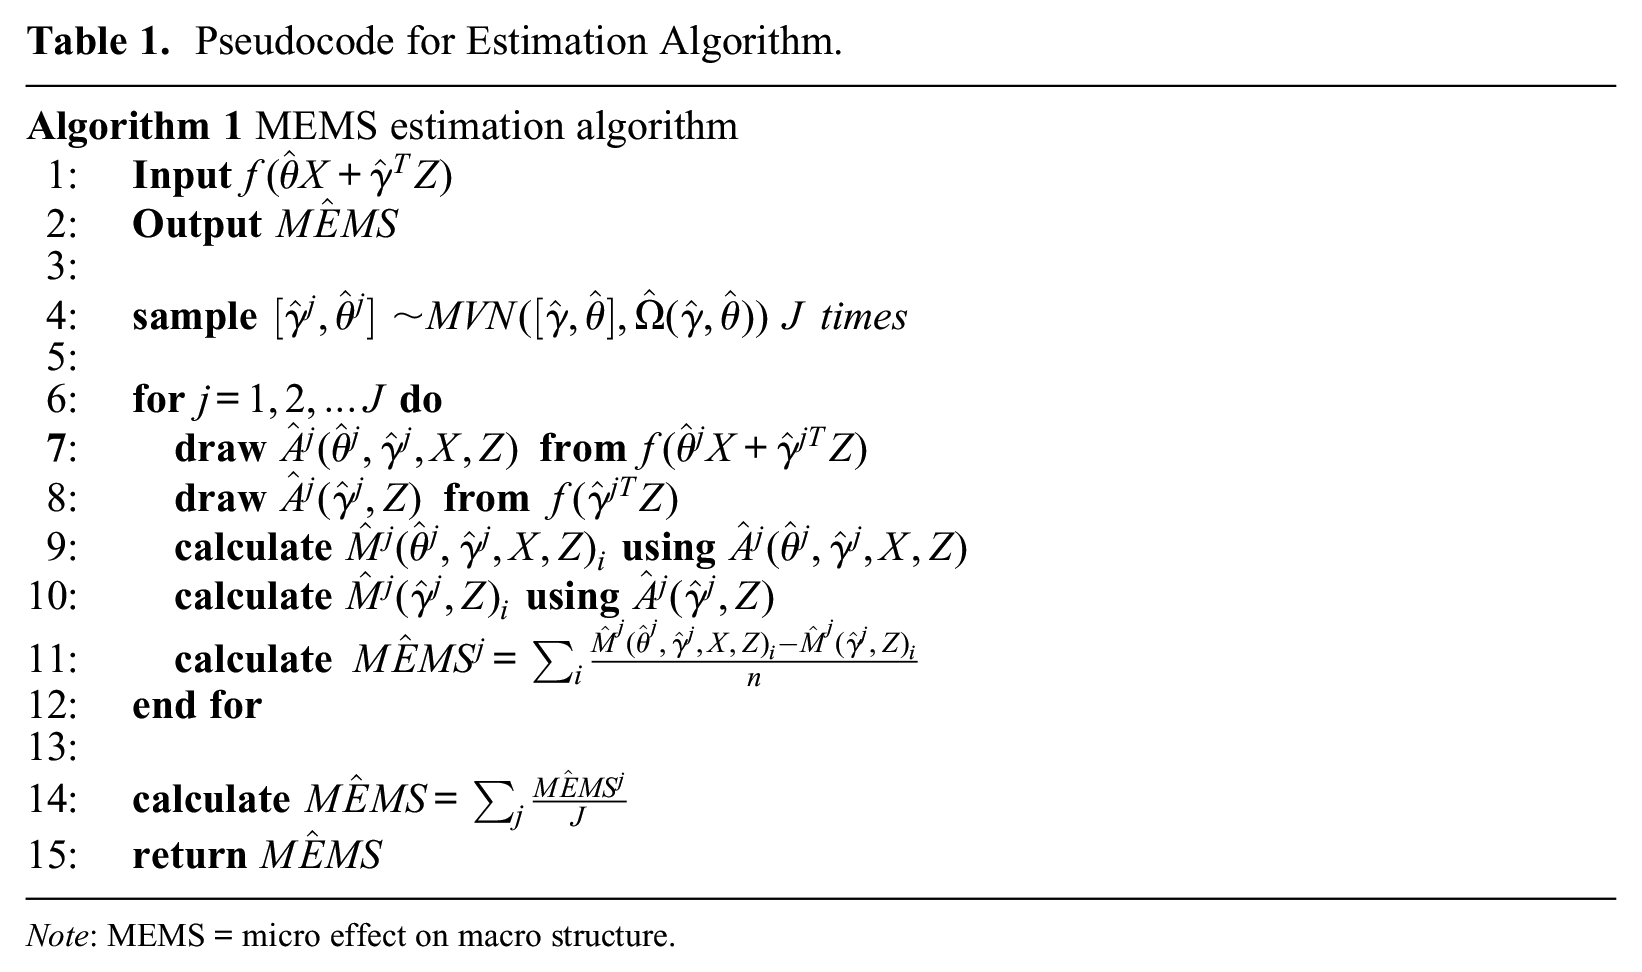
Note: MEMS = micro effect on macro structure.
The algorithm proceeds in four steps. In the first step, the researcher fits a parametric network model of the form
In step 3, we draw two model-implied networks from

and store the value. This provides one Monte Carlo draw of the MEMS. Step 3 repeats J times, once for each value of j.
In the final step, calculate the MEMS point estimate:

The standard deviation of the sampling distribution provides the standard error. Percentile p values and confidence intervals are calculated from the sampling distribution. Visual inspection of the MEMS sampling distribution can be used to assess skewness that may affect estimates. In cases of skewness, the MEMS point estimate can be calculated using the median as opposed to the mean; percentile p values and confidence intervals can still be used.
Relationship to Existing Methods
Existing simulation methods for micro-macro network analysis can be regarded as cases of the proposed framework. Robins et al.’s (2005) method uses prespecified ERGM parameters to simulate distributions of macro network statistics. Thus, if ERGM is the chosen model, each draw from our algorithm is equivalent to simulating a single network using a different parameter value with Robins et al.’s method. In this case, the estimation algorithm is akin to repeating Robins et al.’s method J times using the ERGM estimates to dictate parameter selection in each iteration. Similarly, if we use an SAOM to initiate an agent-based simulation with Snijders and Steglich’s (2015) method, a single simulated network using the cross-sectional SAOM parameter estimates can be regarded as a single Monte Carlo draw from our algorithm. Because Snijders and Steglich recommended considering multiple parameter values to assess the sensitivity of simulation results, our practice of using variance estimates to obtain
Extensions
Hypothetical Network Interventions
Micro-macro analyses are often used to probe hypothetical network interventions. Arvidsson et al. (2021), for example, examined how much of an increase in workers’ recruitment through personal networks would have to occur to reduce labor market segregation. We expand on the earlier formulation of the MEMS to specify a general equation that can accommodate hypothetical network interventions:

In this formulation,
In terms of estimation, our algorithm accommodates the tuning parameters in two ways. First, one might want to explore hypothetical interventions while holding variance constant. If this is the case, we simply multiply
Joint Parameter Test
Substantively informative processes may operate collectively, creating aggregate network features. These types of joint parameter contributions are often of interest in micro-macro network analyses. Block (2023), for example, examined how the combined effects of female workers’ tendency to remain in predominantly female occupations and male workers’ tendencies to leave those occupations increase occupational sex segregation.
Joint parameter tests are straightforward to implement within our framework. Let
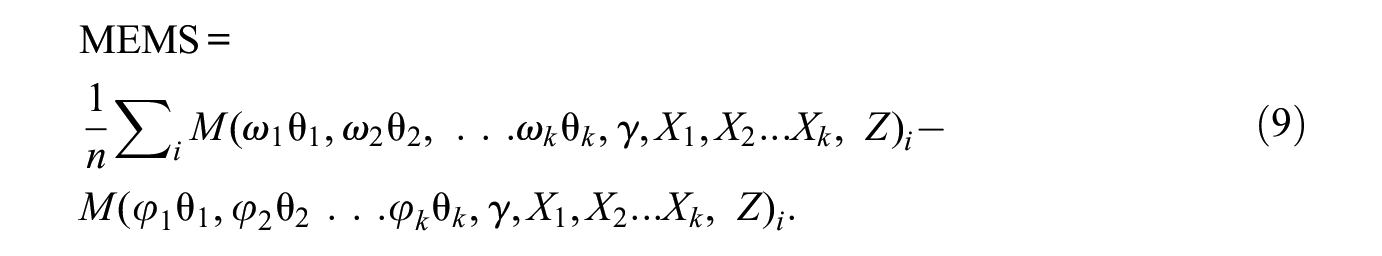
It can be interpreted as the total contribution of the micro mechanisms to the macro outcome of interest. The joint test is estimated using the same algorithm as the single parameter test. This allows researchers to examine the collective contributions of multiple micro processes to aggregate changes in a macro outcome. Equation (9) allows distinct tuning parameters if researchers are interested in assigning different weights to each micro process.
Longitudinal Network Data and Samples of Networks
Prior methods have been developed for cross-sectional network data (Robins et al. 2005; Snijders and Steglich 2015), although researchers are often interested in micro-macro relations in longitudinal and multilevel networks (Block 2018). We detail two strategies for estimating the MEMS in these settings: the isolation method and the pooling method.
The main problem in longitudinal and multilevel network data is heterogeneity. MEMS estimates may vary across time periods or network samples. The simplest way to account for heterogeneity is to estimate distinct MEMS for each network or network panel. We denote the individual networks or network panels with p = 1, 2, . . . P:

In multilevel networks, estimation entails running a separate algorithm for each network. A single vector of parameter estimates can be provided from a multilevel or a pooled network model, such as in the case of block diagonal or multilevel estimation of ERGM or SAOM (e.g., Koskinen and Snijders 2013; Schweinberger and Handcock 2015; Vega Yon, Slaughter, and de la Haye 2021). If a researcher uses meta-regression to combine estimates from P lower-level models (e.g., An 2015; Snijders and Baerveldt 2003), the network-specific parameters

where
In longitudinal network data, individual estimation is more complicated. Each observation represents a snapshot of the same network at a different point in time. In network panel data, a natural procedure is to estimate
The isolation method is beneficial when the number of nodes varies between networks or network panels. It also allows heterogeneity, where the MEMS is not assumed to be constant across time or across distinct networks. However, researchers may hypothesize a homogenous effect. For example, we may expect homophily creates highly clustered friendship networks regardless of the social environment and want to test this hypothesis by pooling estimates from multiple networks. The pooling method allows for this by averaging over the model-implied changes in M. We write the pooled MEMS:

This provides a single value that can be interpreted as the mean change in M attributable to X. The percent change is calculated with equation (5). As above, we can replace
Estimating equation (12) involves first calculating the change in M for each network or network panel and then averaging over the change statistics. Because the pooling method calculates the change in M for each network prior to aggregation, estimation can incorporate network-specific estimates of
In summary, I introduced a general methodological framework for statistically evaluating micro-macro network effects. The framework enables researchers to address questions that implicate a unique macro-level network structure as the dependent variable. The MEMS can be estimated using a broad range of parametric models for cross-sectional, longitudinal, and multilevel network data. The estimation algorithm is computationally tractable, enabling usage in large networks and complex models. I now provide an empirical example to illustrate how estimation of the MEMS can provide unique insights.
Empirical Example: Political Homophily and Political Segregation in Crime Policy Collaboration Networks
A growing body of research uses network methods to measure political polarization in policy environments. Network perspectives are advantageous as they capture relational aspects of political polarization that manifest in worsened party relationships, including sharper ideological divides (Poole and Rosenthal 2001), greater animosity (Iyengar, Sood, and Lelkes 2012), and stronger teamsmanship (Lee 2009). This research operationalizes political polarization as political segregation in policy network data (Desmarais et al. 2015; Moody and Mucha 2013; Neal 2020; Porter et al. 2005). Underlying this measurement is an assumption regarding the micro-level mechanisms that create political segregation—namely, that political segregation reflects political homophily, or choice-based preferences to collaborate with members of the same party and to avoid collaboration with members of the opposing party.
I formally evaluate this assumption in an analysis of crime policy collaboration networks. Research in the sociology of punishment documents sustained increases in crime policy passage and prison populations beginning in roughly the 1970s (e.g., Garland 2001). The growth of the U.S. prison system is the outcome of sustained policy activity that coincided with increases in political polarization. Yet whereas research on polarization suggests political homophily has increased, research on mass incarceration argues that the flurry of crime policy between the 1990s and early 2000s was the result of political alignment, sometimes called the “purpling of punishment” (Beckett 1997; Gottschalk 2006; Hinton 2016; Murakawa 2014; Page 2011; Simon 2007). Landmark crime legislation proposed between 1980 and the early 2000s drew increasing support from politicians from both parties, and politicians were increasingly punished for being perceived as “soft on crime.” These apparently contradictory streams of research raise two questions: Did political segregation increase in crime policy collaboration networks? And if so, how was political segregation able to increase despite bipartisan alignment on crime policy?
I examine this research question using relational event data on crime legislation cosponsorships in the U.S. Senate. Cosponsorship networks are the dominant method for measuring policy collaboration (Aref and Neal 2021; Brandenberger 2018; Fowler 2006; Kirkland 2011; Kirkland and Gross 2014; Neal 2020). Crime legislation cosponsorship networks represent collaborative relationships between senators on crime legislation. Cosponsorships occur when a focal senator endorses crime legislation sponsored by a second senator by signing it as a cosponsor, forming a directed relationship between the two senators. The senate data contain information on 297 unique senators and daily measures of the timing of 14,815 cosponsorships on 2,917 pieces of crime legislation between 1973 and 2005.
Because each cosponsorship is a discrete occurrence in continuous time, we model the evolution of the senate crime legislation cosponsorship network using relational event models (REM; Brandenberger 2018; Butts 2008). An REM is a hazard model for relational event data that models the frequency and time to occurrence of each crime legislation cosponsorship. Senators enter the risk set when they propose a piece of crime legislation and exit the risk set after a floor vote. For legislation that never advances to a vote, senators remain at risk until the final date of a congress. Because senators can propose multiple pieces of legislation simultaneously, they may appear in the risk set multiple times in overlapping time windows. The risk set is time varying, containing only the 100 active senators in any given congressional session.
I capture political segregation using the generalized Freeman index for political party (Bojanowski and Corten 2014). I focus on the Freeman index because it accounts for the number of senators in each party and because it can incorporate information on edge weights—in this case, the number of cosponsorship ties between a pair of senators. The measure ranges between −1 and 1, where positive values represent political segregation and negative values capture integration. The main MEMS analysis pools the cosponsorship network into a single network snapshot, but I also report trend analyses that induce unique networks for each congressional session (two-year period).
The analysis focuses on three mechanisms that may create political segregation: political homophily, network effects (e.g., reciprocity), and demographic homophily (see Figure 1). I capture political homophily by measuring whether a pair of senators belongs to the same party. Demographic homophily is captured with same race, same sex, and age similarity terms. Age similarity is the absolute difference in two senators’ age. I include three network mechanisms: reciprocity (whether a cosponsorship returns a prior incoming cosponsorship), triadic closure (the number of shared cosponsorships with a third senator between a focal pair of senators), and inertia (the number of prior cosponsorships between two senators). Because network effects may be idiosyncratic to policy areas or informed by collaborative relationships that span policy areas, I calculate two measures for each network effect, one using only crime legislation and one using all legislation. I account for temporal recency by assigning a half-life parameter of 20 and by calculating all network statistics within a six-year rolling time window (Lerner et al. 2013; Stadtfeld and Block 2017). This means more recent cosponsorships exert greater weight on network parameter estimates than do temporally distal cosponsorships.
In addition to primary explanatory variables, I control for sponsors’ and cosponsors’ degree centrality (activity rates), gender, political party, age, and race, and whether two senators represent the same state. We include linear and quadratic time parameters to control for time trends. I also include a vector of fixed effects for each congressional session to account for electoral cycles, changes in chamber composition, and institutional rules.
I begin by reporting trends in political segregation. Consistent with prior research that finds increases in political segregation since the 1970s, the percentage of same-party crime legislation cosponsorships increased from 63 percent between 1979 and 1981 to 77 percent between 1995 and 1997 (see Figure 2). The Freeman index also increases from 0.30 to 0.55 during this period, reflecting greater political segregation. Table 2 reports REM and MEMS results. REM results support network effects, political homophily, and age homophily. The hazard ratio of crime legislation cosponsorship increases by 49 percent (exp[0.040] = 1.49) for senators belonging to the same party compared with different parties. We also find positive effects from both reciprocity terms, both triadic closure terms, and crime legislation inertia. Although the REM does not support hypotheses on race and gender homophily, the absolute difference in age coefficient indicates that senators are more likely to cosponsor crime legislation if it is sponsored by a senator of a similar age. Collectively, these results reveal that political segregation increased in the senate crime legislation cosponsorship network, and they provide preliminary support to hypotheses on political homophily, network effects, and age homophily.
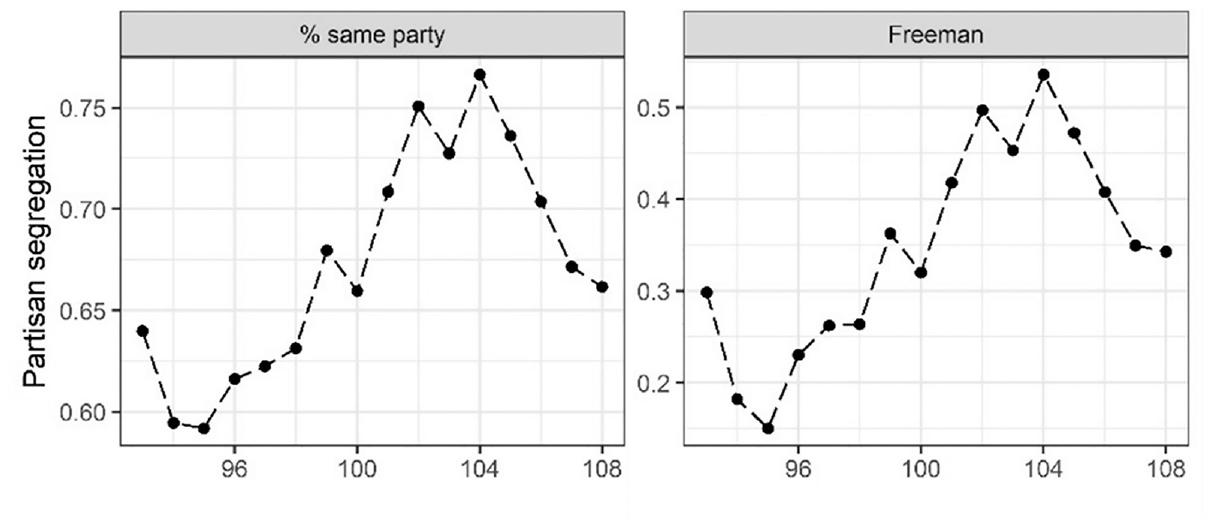
Political segregation in senate crime legislation cosponsorship network.
Results from REMs and MEMS Estimation That Treats the Generalized Partisan Freeman Index as the Outcome.
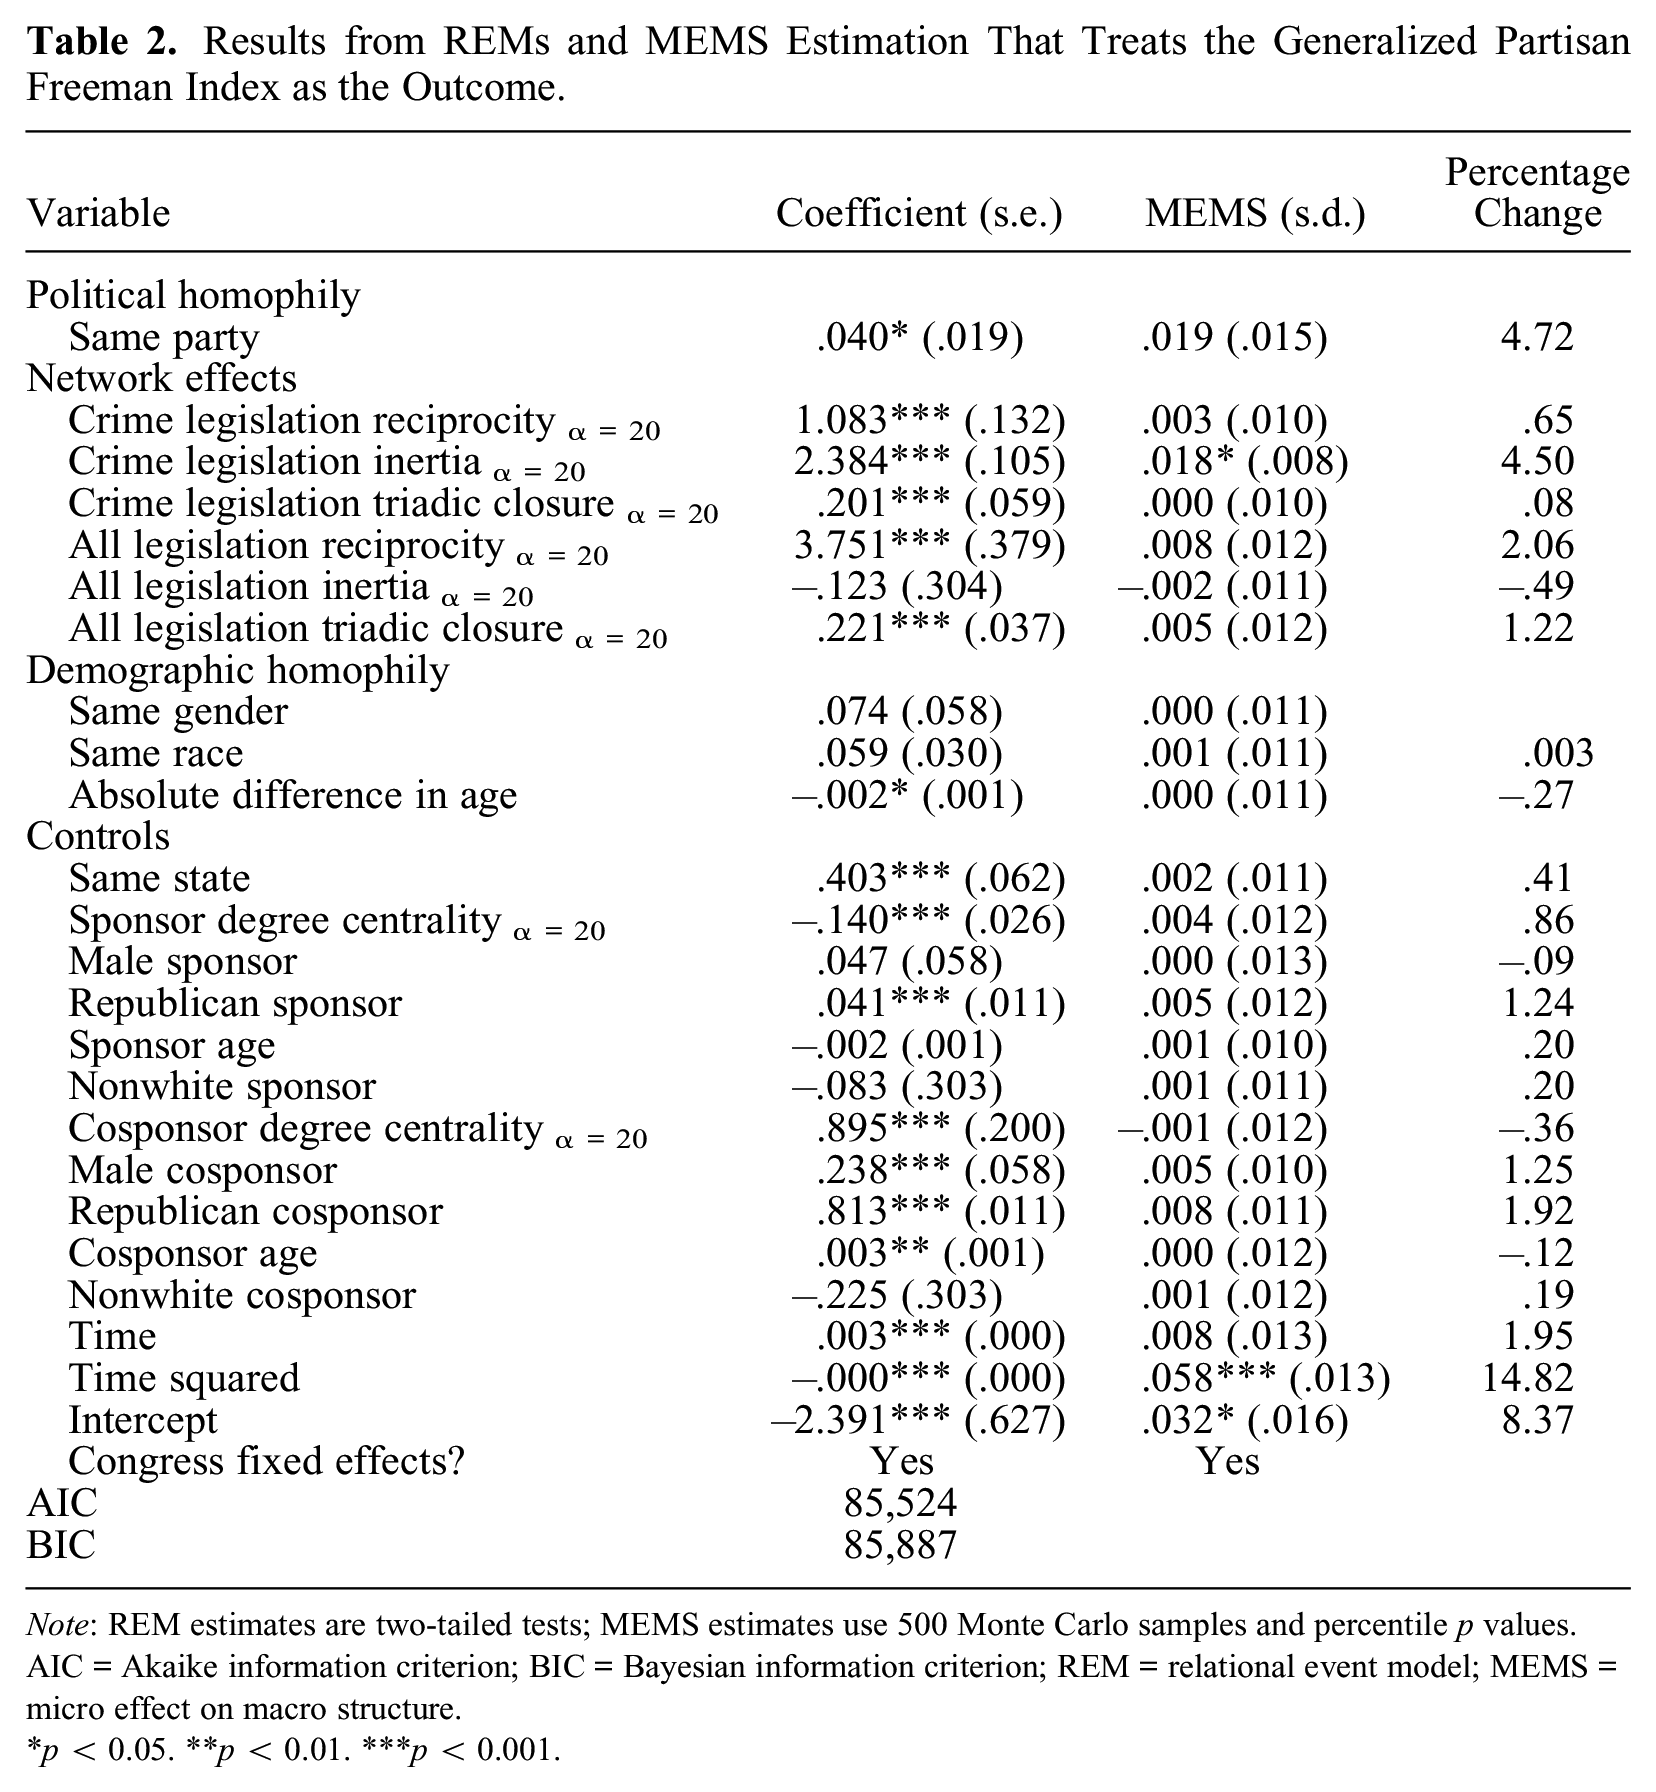
Note: REM estimates are two-tailed tests; MEMS estimates use 500 Monte Carlo samples and percentile p values. AIC = Akaike information criterion; BIC = Bayesian information criterion; REM = relational event model; MEMS = micro effect on macro structure.
p < 0.05. **p < 0.01. ***p < 0.001.
I now turn to MEMS results to formally evaluate which selection mechanisms are associated with political segregation (Table 2). The MEMS for the intercept is 0.032, indicating that 8.37 percent of the partisan Freeman index is explained by random chance. Interestingly, although the same-party parameter can explain 4.72 percent of the partisan Freeman index and is significant in the REM, the MEMS is nonsignificant. This indicates that the effect of political homophily on political segregation is too variable to yield consistent increases in the partisan Freeman index. Thus, although the REM provides evidence of same-party preferences at the micro-level, the effect of these preferences is too weak to produce increases in political segregation at the macro-level. This result departs from prior political polarization research that interprets political segregation as evidence of political homophily, but it aligns with research on personal networks that finds political homophily has a weaker effect on political segregation in personal social relationships than do alternative selection mechanisms (Goldenberg et al. 2022).
Turning to network effects, crime legislation inertia accounts for 4.5 percent of the partisan Freeman index (p = 0.04); the remaining network effects are nonsignificant. The MEMS for the same gender, same race, and absolute difference in age are nonsignificant, indicating that gender, race, and age homophily do not account for a statistically significant portion of the partisan Freeman index. These results suggest that tendencies to repeat prior crime legislation cosponsorships (crime legislation inertia) is associated with greater political segregation; we find little evidence that alternative network effects, political homophily, or demographic homophily are linked to political segregation.
Primary findings from MEMS analysis provide little support to political and demographic homophily explanations for political segregation; they provide only weak evidence of network effects (crime legislation inertia) on political segregation. I now turn to joint parameter tests to explore two possible explanations for this weak evidence. The first is that the effect of political homophily on political segregation increased over time as policy environments grew more polarized. The second is that the effects of network mechanisms and forms of demographic homophily operate collectively to yield greater increases in political segregation than are documented in single parameter estimation (e.g., Block and Grund 2014).
Table 3 evaluates each possibility with joint parameter tests. I assess the time-varying effect of political homophily by interacting the same-party term with linear and quadratic time and estimating a joint parameter test. The MEMS decreases compared with earlier estimates that exclude interactions, and the joint MEMS is nonsignificant. This suggests the effect of political homophily on political segregation did not increase over time in the senate crime legislation cosponsorship network. Alternatively, while single parameter tests for network mechanisms are mixed, the combined effect of all network parameters is relatively large. The joint test of all network mechanisms explains 8.6 percent of the partisan Freeman index (p < 0.001), roughly twice as much as crime legislation inertia operating in isolation. Consistent with earlier results, the joint test of race, gender, and age homophily terms is nonsignificant, suggesting demographic homophily has little effect on political segregation.
Joint Parameter Tests of Political Homophily, Network Effects, and Demographic Homophily.
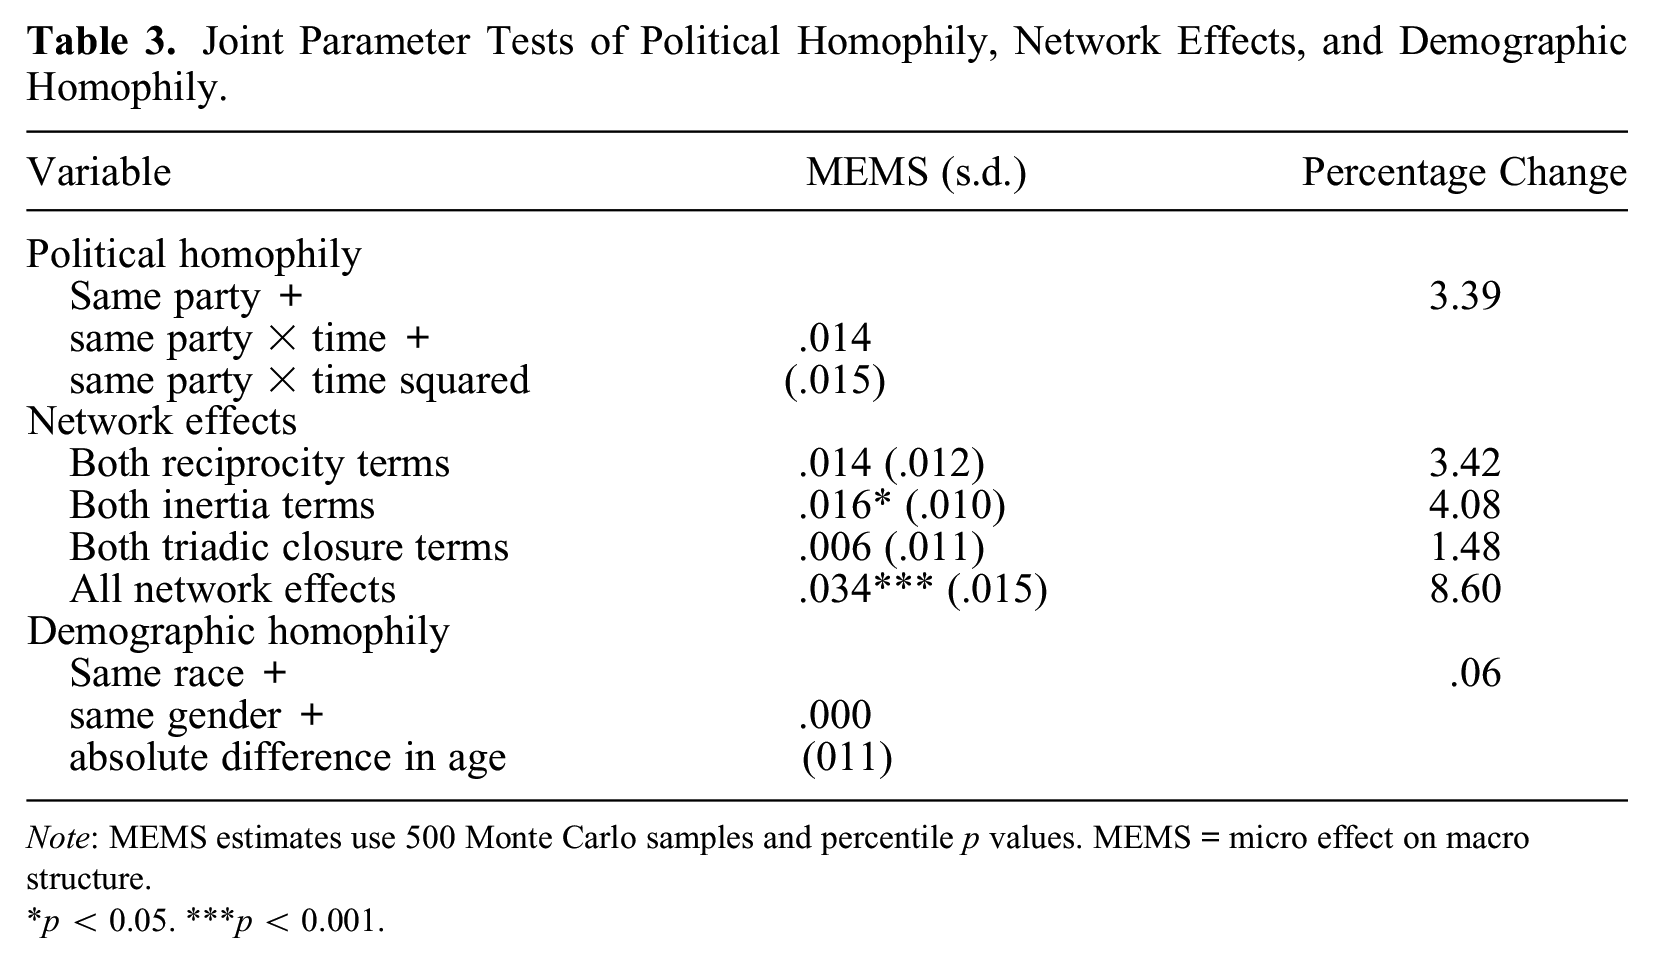
Note: MEMS estimates use 500 Monte Carlo samples and percentile p values. MEMS = micro effect on macro structure.
p < 0.05. ***p < 0.001.
How has each mechanism affected trends in political segregation? I evaluate this by inducing distinct network snapshots for all crime legislation cosponsorships in a congressional session and estimating the MEMS for each snapshot. Consistent with primary findings, joint tests of political and demographic homophily are nonsignificant for all observations (see Figure 3). In contrast, network mechanisms have positive effects in most congresses. The MEMS for network effects is greatest between 1979 and 1981, where the combined effect of all network mechanisms can account for roughly 30 percent of the partisan Freeman index.
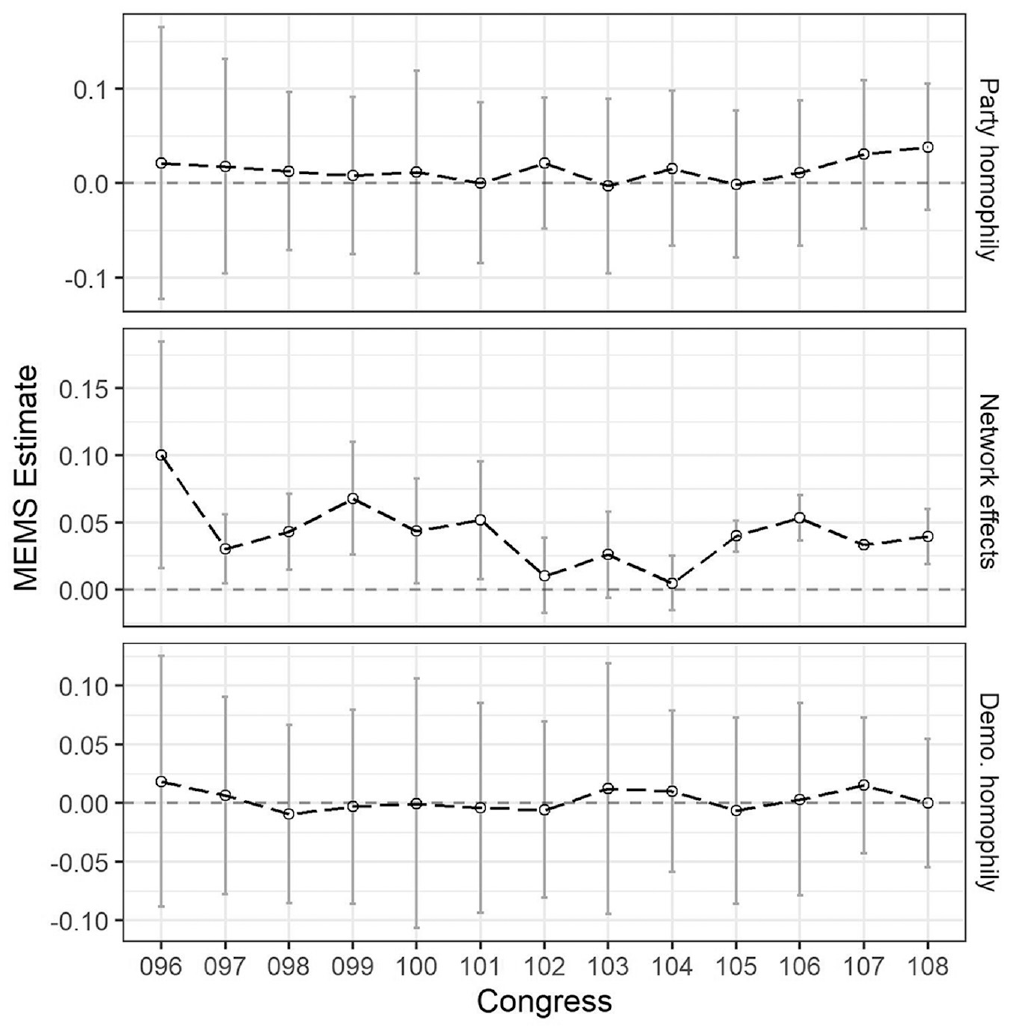
Joint micro effect on macro structure tests treating each congressional session as a distinct network snapshot.
How large would the effect of political homophily have to be to increase political segregation? I evaluate this question using tuning parameters. I incrementally increase the same-party coefficient by 10 percent of its baseline value using fixed variance. Figure 4 demonstrates that the effect of political homophily does not become significant until the same-party parameter increases by 120 percent, at which point its effect is comparable with the combined contributions of all network mechanisms. The effect of political homophily on crime legislation cosponsorship would have to more than double in size to yield an increase in political segregation comparable with the combined effect of reciprocity, triadic closure, and inertia.
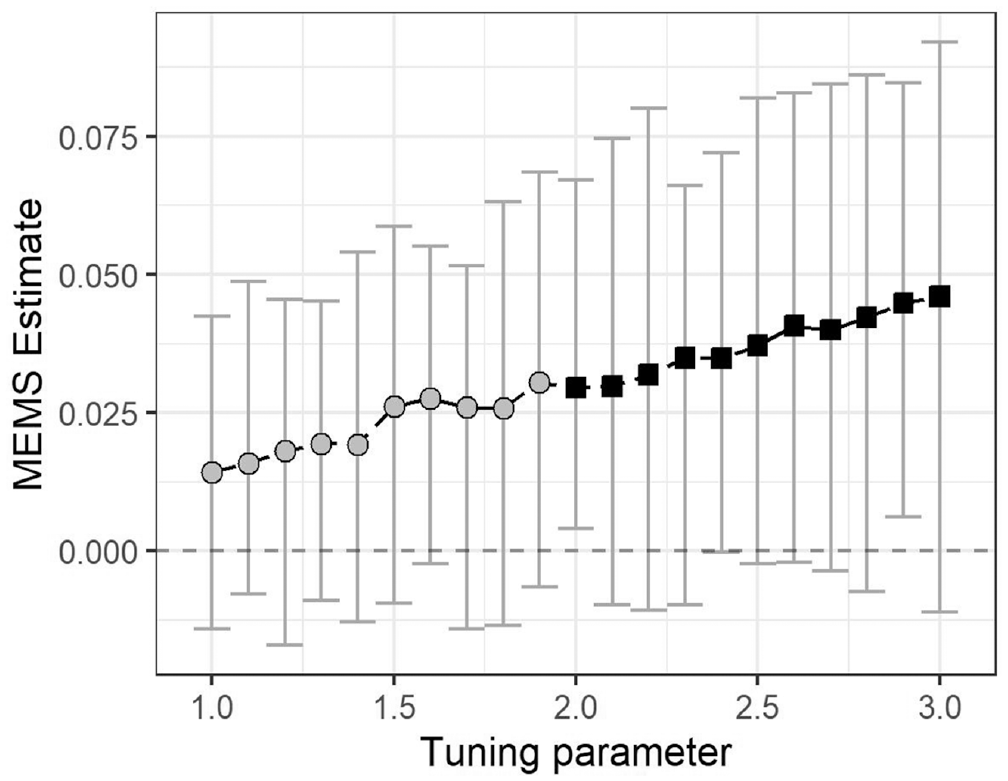
Network interventions increasing strength of same-party parameter.
In summary, prior studies interpret political segregation in policy networks as evidence of political polarization. This measurement requires an assumption regarding the micro foundations of political segregation that has not been previously tested. Using the case of crime policy, MEMS results show that the micro mechanisms that create political segregation in the senate crime legislation cosponsorship network have little to do with same-party preferences. There is limited evidence that political homophily is responsible for political segregation in either cross-sectional or dynamic representations of the senate crime legislation cosponsorship network, or that the effect of political homophily on political segregation increased over time. Instead, of the tested explanations, the strongest effects can be traced to endogenous network processes—reciprocity, triadic closure, and inertia—that create clustering within political groups.
These findings demonstrate how the MEMS can be used to test and falsify theoretical explanations on the micro foundations of macro network outcomes like political segregation. Interpreting REM results, we might prematurely conclude that political homophily contributes to observed increases in political segregation. Using the MEMS, we find that the relationship between political homophily and political segregation is surprisingly weak in the studied crime policy network, and we can uncover the somewhat larger network effects that contribute to political segregation. These results illustrate that the micro foundations of macro structures may not be clear from generative network models but can be formally evaluated and interpreted using the MEMS.
Discussion
This study proposed a general framework for investigating micro-macro relationships in social networks. I approach offers several contributions. First, it define the MEMS as an estimand that can be used to evaluate micro-macro network effects and clarify assumptions necessary to interpret the MEMS. Second, I introduce a flexible estimation algorithm that can be used in a wide range of models and data structures. Third, the framework offers extensions to hypothetical interventions, joint parameter testing, and multilevel and longitudinal data structures not covered by prior methodological work. Collectively, these contributions advance a unified framework for micro-macro network analysis that can be used to statistically evaluate hypotheses on the micro-level network selection mechanisms that create unique macro-level network structures in a wide range of empirical applications. The MEMS enables researchers to ask and answer a different set of questions related to the determinants of specific network structures than are supported with current statistical network models.
Before concluding, I offer some provisional guidance on the problem of creating more ties. An occasional criticism of micro-macro network analysis is that researchers may not be capturing network changes that reflect a real-world process. Rather, setting a statistical network model parameter to zero necessitates a change in edge counts. The micro-macro effect may thus be an artifact of creating a more densely interconnected network.
The problem of creating more ties is contingent on the macro outcome focal to the analysis. Consider the case of triadic closure and political segregation. There is nothing a priori that forces triadic closure to occur among senators belonging to the same party. It is because the ties that are created connect senators of the same party that we see a change in segregation. In cases where the interest is in the patterning of an actor attribute (e.g., segregation, group composition), creating more ties is unlikely to drive substantive results.
Researchers should consider the tie formation problem with respect to the outcome at hand. Segregation, for example, does not increase because there are more ties, but because of which groups tend to be connected when ties do form. When researchers are interested in an outcome that does vary as a function of edge counts (e.g., transitivity), standardization is the most promising solution. A simple procedure is to divide the measure by network density. Calculating the change in M for the standardized outcome will hold constant any differences in edge counts. Because standardization only involves the calculation of M, it is straightforward to incorporate within our framework. Another strategy is to hold constant the number of ties when estimating the MEMS (e.g., Block 2018). This can be accomplished in our framework by prespecifying the intercept at a value that maintains network density and holding it at that value in each algorithmic call.
An interesting point of discussion is the empirical interpretation of counterfactuals. As Block (2023) wrote about the “knock out” method, “the assumption that only one predictor of individuals’ behavior changes while all others remain constant is unrealistic”; instead, “the simulations provide an intuition about effect sizes . . . not an expectation about what would happen in the actual world” (p. 49). Recognizing that we cannot realistically “switch off” a single model parameter while holding all else constant, the MEMS should be interpreted as a decomposition of the strongest micro predictors of macro statistics. 5 In this respect, the framework emphasizes explanation, rather than prediction (Block et al. 2018; Shmueli 2010). This aligns with process-oriented interpretations widely used in statistical network analysis (Schweinberger et al. 2020), as well as with counterfactual analysis more broadly (VanderWeele 2015).
Furthermore, I focused on frequentist approaches to micro-macro analysis because of the prevalence of frequentist methods in applied networks research. However, recent studies have advanced Bayesian network models (Caimo and Friel 2011; Koskinen and Snijders 2013; Schweinberger and Handcock 2015). The framework lends itself to Bayesian estimation. To estimate the MEMS with a Bayesian model, a researcher need only replace parameter selection procedures in our estimation algorithm with random draws from the posterior distribution. Future studies should explore how Bayesian MEMS estimation behaves in applied settings.
In summary, I introduced a general framework for micro-macro network analysis. The method is flexible, can accommodate a wide range of models, and provides an estimand with a consistent interpretation across research applications, data structures, and modeling frameworks. Thus, it should be broadly accessible, straightforward to implement, and enable researchers to interrogate micro-macro puzzles in a range of empirical settings.
Footnotes
Acknowledgements
I thank Per Block, Christian Steglich, Jacob Young, Santiago Olivella, Ken Bollen, Carter Butts, and Dave Melamed for helpful comments at various stages of this project. This article also benefited from helpful comments at the Duke Worldview Lab.