
Abstract
Inattentive respondents pose a substantial threat to data quality in web surveys. We evaluate methods for preventing and detecting inattentive respondents. First, we test the effect of asking respondents to commit to providing high-quality responses at the beginning of the survey on various data quality measures. Second, we compare the proportion of flagged respondents for two versions of an attention check item instructing them to select a specific response versus leaving the item blank. Third, we propose a timestamp-based cluster analysis approach that identifies clusters of respondents who exhibit different speeding behaviors. Our findings show that the commitment pledge had no effect on the data quality measures. Instructing respondents to leave the item blank significantly increased the rate of flagged respondents (by 16.8 percentage points). The timestamp-based clustering approach efficiently identified clusters of likely inattentive respondents. Lastly, we show that inattentive respondents can have substantial impacts on substantive analyses.
Keywords
Introduction
Researchers increasingly rely on online modes to collect survey data (Baker et al. 2010). The main reasons driving this trend are the relatively low costs of web surveys and the speed at which data can be collected (Couper 2017). In particular, non-probability online panels provide an easy-to-use and relatively inexpensive infrastructure to collect data quickly and have gained increasing popularity in the social sciences, despite concerns about their selection bias (e.g., Mercer et al. 2017). However, the shifting popularity towards self-administered web surveys may lead to a change in error sources relative to traditional interviewer-administered modes. While the absence of interviewers avoids interviewer effects (West and Blom 2017) and lessens the risk of social desirability bias (Kreuter, Presser, and Tourangeau 2008), negative consequences include the decreased ability to keep respondents engaged and focused on the response task, while ensuring that they comprehend the questions and provide thoughtful answers (Chang and Krosnick 2010). A particularly problematic consequence is inattentive respondents (also called careless respondents, speeders, or insufficient effort respondents), which have long been identified as a significant and growing threat to data quality in web surveys (Meade and Craig 2012).
The increasing proportion of inattentive respondents (see Ternovski et al. 2022: for a recent example) and its potential for introducing measurement errors have led to the development of a variety of prevention and detection methods. While research on prevention methods, such as commitment pledges (Conrad et al. 2017; Hibben, Felderer, and Conrad 2022), is still scarce, detection methods are abundant and range from rather obvious attention checks that instruct respondents to perform specific tasks (Oppenheimer, Meyvis, and Davidenko 2009) to sophisticated data analysis methods (e.g., Read, Wolters, and Berinsky 2021; Ulitzsch et al. 2022). However, none of these approaches come without limitations. For example, attention checks can take various forms and previous studies have shown how different wordings (e.g., Silber, Roßmann, and Gummer 2022) and task difficulty (e.g., Anduiza and Galais 2017; Leiner 2019; Shamon and Berning 2020) can lead to differing proportions of respondents being flagged as inattentive. Some respondents might even fail attention checks on purpose (Liu and Wronski 2018; Silber, Roßmann, and Gummer 2022), or pass them by chance. Furthermore, while sophisticated data analysis approaches provide valuable insights into response behaviors that aid in identifying inattentive respondents, these methods can be challenging to implement and their results difficult to interpret.
We contribute to the literature on preventing and detecting inattentive responding in four ways. First, we evaluate the effectiveness of introducing a commitment pledge at the beginning of the survey with regard to respondents’ performance on several indicators of attentiveness and data quality, and test whether pledge effects fade out over the course of the survey. Second, we compare two attention checks instructing respondents to either select a specific response option or select none of the response options, and use the results to test whether respondents likely pass the former attention check by chance. Third, we propose an easy-to-use cluster analysis method that uses screen-level durations to identify inattentive respondents with graphical representation of results. We show that the proposed method outperforms a related method with respect to differentiating attentive and inattentive respondents. Lastly, we explore the impacts of inattentive respondents on substantive results with regard to univariate analyses, regression analyses, and survey experiments. Note that the contributions build on each other as detection measures (attention checks, cluster analysis) are only necessary if prevention measures (commitment pledge) do not work, the timestamp-based clustering approach is only necessary if attention checks provide inconsistent results, and consequences of inattentive respondents can only be evaluated if they are detected.
The study results will inform researchers designing web surveys and analyzing data collected from them. In particular, the commitment pledge and attention check experiments will inform on the effectiveness of inserting additional items to the questionnaire for preventing and detecting inattentive responding. The proposed cluster analysis offers an additional quality control tool for researchers that provides insights into the prevalence of inattentive respondents in the data. As we also document the potential impacts of inattentive responding on substantive findings, the results will reinforce the importance of anticipating data quality issues during web survey design and analysis.
Inattentive Responding
Prevention Methods
The literature documents several approaches to preventing inattentive responding, including explicitly warning respondents against this behavior (e.g., Berinsky, Margolis, and Sances 2016; Huang et al. 2012) or providing immediate feedback to the respondent when this behavior is observed (e.g., Conrad et al. 2017). However, (repeatedly) warning respondents might be perceived as intrusive for attentive respondents, and providing immediate feedback is technically challenging and requires thresholds to trigger feedback. An alternative approach is to use commitment pledges as tested by Conrad et al. (2017) and evaluated in-depth by Hibben, Felderer, and Conrad (2022) and Cibelli (2017). Building on previous findings from interviewer-administered surveys (e.g., Cannell, Miller, and Oksenberg 1981), commitment pledges ask respondents whether they will commit to providing accurate data, with the question usually posed at the beginning of the survey. Respondents can either state that they will commit or not commit to doing so, though the proportion of respondents who do not commit is usually negligible (Cibelli 2017; Conrad et al. 2017; Hibben, Felderer, and Conrad 2022), and often these respondents are filtered out of the survey immediately.
Conducting an experiment in a non-probability survey, Conrad et al. (2017) find that respondents who received a text message asking for their commitment were less likely to speed and highly educated respondents gave more accurate responses than those who received a neutral message containing no pledge. Similarly, Hibben, Felderer, and Conrad (2022) show that receiving a commitment pledge reduced item nonresponse, increased income reporting accuracy, and increased the total interview duration in a probability-based survey. However, they find no effect on straightlining (a lack of response differentiation in a set of same-scaled items; Yan 2008) and a higher break-off rate (the proportion of respondents who start the survey but end the survey before completion) for respondents receiving the commitment pledge, which was driven by non-committing respondents. Cibelli (2017: Chapter 2) investigates the provision of a commitment pledge in a probability-based survey. She finds that respondents who received a commitment pledge provided more accurate responses for some questions and had longer interview durations and more acquiescent responses. In contrast, she finds no difference for overall item nonresponse, straightlining, and social desirability. However, the commitment pledge increased item nonresponse for rather difficult questions and increased the break-off rate, presumably because committed respondents would rather not answer a question or break-off than provide inaccurate information. Relatedly, Clifford and Jerit (2015) showed that asking for the respondents’ commitment at the beginning of the questionnaire reduces attention check failure but can induce socially desirable responding for some respondent groups (i.e., highly-educated respondents).
Building on these findings, we first evaluate whether commitment pledges have positive impacts on multiple measures of inattention and data quality (attention checks, straightlining, screen durations, item nonresponse, break-off rates) in a large-scale non-probability survey with a target population of young people prone to inattentive responding. Second, we extend previous research by investigating to which extent a commitment pledge at the beginning of the survey leads to higher data quality throughout the entire questionnaire. As the distance to the commitment increases, we hypothesize that any benefits from the commitment pledge will fade out as respondents progress further in the questionnaire.
Detection Methods
Ex-ante Survey Design
Approaches to identify inattentive respondents in web surveys can be classified into ex-ante and ex-post methods (Meade and Craig 2012). Ex-ante methods include measures researchers can take before the data are collected and involve adding attention check items to the questionnaire that flag inattentive respondents. Such direct attention checks include so-called bogus items (Meade and Craig 2012) and instructed manipulation checks (IMCs) (Oppenheimer, Meyvis, and Davidenko 2009). Bogus items are illogical statements, such as “I am paid biweekly by leprechauns” (Meade and Craig 2012: 5), with affirmative responses flagged as inattentive. IMCs can take various forms. Oppenheimer, Meyvis, and Davidenko (2009) use a long text on a separate screen that asks respondents to click on a specific field (e.g., the title of the screen), while other versions ask respondents to write specific words in an open-text field. Instructed response items (IRIs) are a special case of IMCs that instruct respondents to select a specific response option for an item embedded within a larger set of items (e.g., an item battery) on the same screen (Gummer, Roßmann, and Silber 2021; Meade and Craig 2012).
Previous studies have shown that respondents flagged by IMCs provide lower-quality data and more measurement error than non-flagged respondents (e.g., Gummer, Roßmann, and Silber 2021; Huang, Liu, and Bowling 2015; Meade and Craig 2012; Oppenheimer, Meyvis, and Davidenko 2009; Silber, Danner, and Rammstedt 2019). While these methods were designed to identify inattentive responding, they may also induce attentive responding and change response behavior to subsequent items (Oppenheimer, Meyvis, and Davidenko 2009). Hauser and Schwarz (2015) found spillover effects for complex tasks in an Amazon Mechanical Turk sample, however, these effects have not been replicated for standard survey questionnaires (Berinsky, Margolis, and Sances 2014; Gummer, Roßmann, and Silber 2021; Hauser et al. 2016).
A significant disadvantage of these methods is that they provide only a snapshot of attentiveness, which is suboptimal given that inattentive behavior might change over the questionnaire. In addition, there is no guarantee that they will work as intended and identify the majority of inattentive respondents. Some attention checks might be too obvious to fail and previous research indicates that respondents might fail the checks on purpose due to confusion or the additional response burden (Liu and Wronski 2018; Silber, Roßmann, and Gummer 2022). Such checks often increase the response burden because the questionnaire is lengthened and attentive respondents might be annoyed by the additional items testing their attention (Silber, Roßmann, and Gummer 2022).
Another concern for IRIs is that respondents may pass the checks by chance, for example, when providing a random response or straightlining the instructed response option. In the present study, we attempt to quantify the extent of this occurrence by running an experiment with two versions of the same IRI at the same position within an item battery, where one IRI asks respondents to provide a specific response and the second IRI asks respondents to provide no response (Paas and Morren 2018). Some respondents in the first group might pass by chance if they randomly select one of the response options. In the second group, this is not possible as respondents should not select any response. Hence, we expect a higher proportion of respondents to pass the IRI for the first than for the second version. In addition to addressing these differences, we further contribute to the literature by investigating IRI spillover effects on subsequent items.
Ex-Post Data Analysis
Ex-post detection methods are less intrusive but require researchers to analyze the collected data to identify likely inattentive cases. Such analysis approaches include the analysis of response data and paradata (Meade and Craig 2012). Response data-based approaches often involve the analysis of same-scaled item batteries using neural networks (e.g., Melipillan 2019; Welz and Alfons 2024), straightlining/LongString indicators (e.g., Johnson 2005; Meade and Craig 2012), person-fit statistics (e.g., Emons 2008), or the Mahalanobis distance (e.g., Meade and Craig 2012). Most of these methods require setting a threshold above which respondents are deemed inattentive.
Paradata are data about the data collection process that are mainly generated during computer-assisted interviewing (Couper 1998; Kreuter, Couper, and Lyberg 2010). Paradata-based detection methods often rely on timestamp data collected at the item-level, screen-level, or interview-level and researchers have used these data to develop multiple approaches and thresholds to identify presumably inattentive respondents (Matjašič, Vehovar, and Manfreda 2018). In the commercial survey industry, a widely employed threshold is one-third of the median total interview duration (McPhee et al. 2022). While easy to calculate, this rather arbitrary threshold cannot account for respondents taking breaks during the survey and differences in questionnaire length due to filter questions. As the threshold itself depends on the prevalence of very fast respondents, a risk of false positives in samples with few inattentive respondents and a risk of false negatives in samples with many inattentive respondents is introduced.
Previously proposed analysis approaches most relevant to the present study are Read, Wolters, and Berinsky (2021) and Ulitzsch and coauthors (Ulitzsch et al. 2022, 2024; Ulitzsch, Shin, and Lüdtke 2024), who use mixture modeling approaches to disentangle attentive from inattentive respondents. Read, Wolters, and Berinsky (2021) take the natural logarithm of the screen-level durations, apply principal component analysis for dimensionality reduction, and use mixture modeling to identify classes of “attentive,” “slow inattentive,” and “fast inattentive” respondents. The first two steps are required to limit the influence of extreme durations on cluster solutions. They find that the clusters of inattentive respondents pass fewer attention checks, have less consistent response patterns in item batteries, and attenuated treatment effects in a survey experiment. Ulitzsch et al. (2022) develop a latent mixture model that incorporates screen-level timestamp data and response data to disentangle attentive from inattentive respondents. However, their approach is computationally intensive and requires advanced statistical knowledge which might hinder its implementation in practice. Ulitzsch et al. (2024) extend this approach by accounting for response styles expected of attentive respondents. Lastly, Ulitzsch, Shin, and Lüdtke (2024) suggest using separate Gaussian mixture models to identify inattentive respondents at the screen level where the cluster with the shortest average duration is deemed as the inattentive cluster.
In the present study, we propose a further cluster-based approach to identify likely inattentive respondents. Specifically, we develop a non-parametric distance-based clustering approach that is robust to outliers, requires no researcher decisions on preprocessing, can increase the number of clusters efficiently, and provides an easy-to-interpret visualization of clustering results. The results for the distance-based approach are compared to multivariate mixture modeling, which is similar to the previously proposed approaches described above.
Impacts of Inattentive Responding on Substantive Analyses
Previous research on the influence of inattentive respondents on descriptive analyses suggests only minor effects on the estimates. For example, Anduiza and Galais (2017) show that excluding respondents based on IMCs can increase bias in univariate analyses while substantially reducing standard errors, suggesting a reduction of noise. For regression analyses, they find little evidence of biases due to inattentive respondents. Similarly, Greszki, Meyer, and Schoen (2015) find no strong differences in univariate or regression analyses when respondents flagged by timestamp-based speeder indices are excluded. Gummer, Roßmann, and Silber (2021) come to the same conclusions for excluding respondents who fail IRIs. However, inattentive respondents can have a larger influence on psychometric scores derived from item batteries (e.g., Huang, Liu, and Bowling 2015; Maniaci and Rogge 2014).
In (factorial) survey experiments, inattentive respondents will likely ignore the treatment or different experimental conditions and thus inattentive respondents assigned to different experimental groups will likely provide similar (random) responses. Hence, the estimated effect will be the intention-to-treat (ITT) effect rather than the average treatment effect. In this case, inattentive responding can attenuate treatment effect estimates (e.g., Kane 2025; Read, Wolters, and Berinsky 2021). However, excluding likely inattentive respondents flagged by post-treatment attention checks or paradata might induce post-treatment biases (e.g., Aronow, Baron, and Pinson 2019; Montgomery, Nyhan, and Torres 2018). To counter such biases, Kane, Velez, and Barabas (2023) suggest implementing a mock vignette before the actual vignette to obtain a measure of attentiveness. In this approach, a short text is presented to respondents in a format similar to an actual vignette, and thereafter respondents receive one or more follow-up questions on the respective content. The number of correct responses is employed as an indicator of inattention, which can be used to calculate conditional average treatment effects (CATE) that depict the influence of respondents’ attention on the experiment’s results.
In the forthcoming study, we investigate the influence of likely inattentive respondents on univariate, regression, and experimental analyses. Given that the error induced by inattentive respondents depends on their response strategy (e.g., random responding, middle responding, acquiescence), their influence on univariate and regression analyses is a priori unknown, while treatment effects estimated for survey experiments should be attenuated.
Data Sources
Study 1
The first study is a non-probability web survey, which was fielded in the United States in March 2022 by a contracted survey vendor. The target population was 16- to 25-year-olds. The main questionnaire topics were climate change and anxiety due to climate change (e.g., feelings about climate change, satisfaction with the government’s work on climate change) and general demographics. We are aware of the general pitfalls of using non-probability-based samples for population-based inference (see Cornesse et al. 2020: for an overview), but refrain from engaging in this discussion as our focus is on response behavior in web-based samples. The sample consists of 15,990 respondents. The time spent on each screen was recorded for all respondents and measured in milliseconds. Each screen contained either informational text, a single item, or an item battery. A brief assessment of the validity of the screen-level timestamp data is described in the Online Supplement A.
We restrict the sample to smartphone respondents only (
Study 2
The second study was conducted in July and August 2023 with the same target population and topics as Study 1, and fielded by the same non-probability web survey vendor. Several questionnaire components were adopted from Study 1, though the order and number of questionnaire items changed. The sample consists of 6,002 respondents, though, again, we solely focus on smartphone respondents (
Methods and Experimental Designs
The methods and results sections follow a logical order starting with the commitment pledge experiment as a preventive measure, continuing with the IRI experiment as an ex-ante detection measure, and the clustering approach to timestamp data as an ex-post detection measure. In practice, effective prevention measures would make detection measures redundant. Similarly, unambiguous ex-ante detection measures would make ex-post detection measures redundant.
Commitment Pledge
The commitment pledge experiment was implemented in Study 2. After the welcome page and two questions on the respondent’s age and state of residency, respondents were randomized to receive a screen that showed the commitment pledge text (
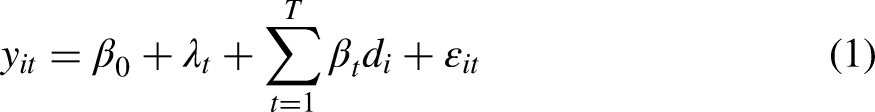
Lastly, we assess the impact of the commitment pledge on the time spent on each screen. Similar to model 1, we fit a linear regression model with the natural logarithm of the duration observed for each screen
Instructed Response Item (IRI)
Study 2 contained two IRIs for most respondents. The first (non-experimental) IRI was embedded within the item battery on what climate change makes the respondent think (Q7). Each respondent received the IRI stating “Please select ‘Very much’ to show us that you are paying attention.” Its position was fixed, while the order of the other items on the battery was randomized. The second attention check was implemented as part of an experimental manipulation. It was embedded within an item battery measuring the extent to which different factors contribute to the respondent’s feelings about climate change split across two screens (see the Online Supplement C). One-third of respondents received no IRI, one-third received an IRI which instructed respondents “To show you have read this sentence please mark ‘very much”’ (Response-IRI), and one-third received an IRI stating “To show you have read this sentence please leave the question blank” (Blank-IRI). In addition to comparing the proportions of respondents who failed these attention checks, we follow previous literature (Berinsky, Margolis, and Sances 2014; Gummer, Roßmann, and Silber 2021; Hauser and Schwarz 2015; Hauser et al. 2016) and evaluate whether the IRIs affect response behavior to subsequent items (i.e., spillover effects). To estimate the spillover effects, we fit equation 1 with the IRI treatment status defined by
Clustering Timestamp Data
Several timestamp data characteristics often complicate the application of methods to identify inattentive respondents. First, duration distributions are often heavily skewed and have extreme outliers, for instance, due to respondents taking breaks and doing something else during the survey (e.g., Höhne et al. 2020; Sendelbah et al. 2016). Second, screens differ in length (amount of questionnaire text, number of items per screen, and number of response options). Third, for some screens (e.g., socio-demographic questions) both attentive and inattentive respondents are expected to be very fast. Clustering approaches that require dimensionality reductions (e.g., Read, Wolters, and Berinsky 2021) might mask such differences across screens. Below, we describe a distance-based clustering approach that overcomes these issues.
The proposed distance-based approach consists of two steps. First, we handle the outlier problem by scaling the duration data. For each screen
Second, we use the relative ranks as inputs to a hierarchical agglomerative cluster analysis with Ward’s linkage and Euclidean distance (Kaufman and Rousseeuw 1990). Both internal and external criteria are used to determine the most adequate number of clusters. We use 22 cluster validity indices as internal criteria and determine the recommended number of clusters based on the modal number of clusters (Charrad et al. 2014). The respective indices are listed in the Online Supplement D. As external criteria, we rely on a straightlining indicator, which is a frequently-used measure of inattention and strong satisficing (Kim et al. 2019; Krosnick 1991; Meade and Craig 2012). In our analyses, each item battery used to calculate the straightlining indicator contains at least one reversed item.
We illustrate the clustering approach using the Study 1 data and calculate the straightlining indicator for four separate item batteries (see Online Supplement E for the question wordings). The first item battery (Q5) contains 16 items on how climate change makes respondents feel (e.g., sad, anxious, powerless) with response options not at all - a little - moderately - very much - extremely. The second battery (Q7) asks what climate change makes respondents think (e.g., the future is frightening, I’m hesitant to have children) with the same response options as Q5. The third item battery (Q18) contains 9 items about their beliefs regarding the US Government’s actions on climate change (e.g., acting in line with climate science, failing young Americans) with Yes-No response options. Lastly, the fourth item battery (Q19) contains 14 items on how they feel about the US government’s response to climate change (e.g., hopeful, reassured, angry) with the same response options as for Q5 and Q7. All four item batteries contain items that contradict each other if the same response option is selected (e.g., Q18 contains an item on whether the respondent believes that the US Government is “trustworthy,” another item asks whether the respondent believes that the US Government is “lying about the effectiveness of the actions they’re taking”). Thus, any straightlining would produce rather inconsistent answers indicative of potential inattentive responding. As the cluster solutions with increasing numbers of clusters are nested models, we assess the external criteria by fitting logistic regressions for all cluster solutions and straightlining indicators separately and use AIC and BIC to determine the number of clusters that best separates straightlining from non-straightlining respondents. In total, we consider up to 15 clusters to ensure the detection of a variety of screen duration patterns over the interview. 1 An in-depth description of the implementation of the approach is provided in Online Supplement 2.
For comparison with our proposed approach, we implement a model-based clustering approach. Specifically, we follow previous research and use multivariate Gaussian mixture modeling (Read, Wolters, and Berinsky 2021; Ulitzsch et al. 2022, 2024; Ulitzsch, Shin, and Lüdtke 2024). To account for the skewness of the duration data, we take the natural logarithm of the durations (Ulitzsch, Shin, and Lüdtke 2024). However, we refrain from preprocessing steps such as dimensionality reduction (Read, Wolters, and Berinsky 2021) or defining cut-off values for extreme durations (Ulitzsch et al. 2022). We do so to limit the potential influence of researcher degrees of freedom. Nonetheless, we provide results for the model with durations top-coded at the 99th percentile for each screen in the Online Supplement F. Since Gaussian mixture model solutions depend on the provided starting values (e.g., obtained via k-means clustering or random draws), we initialize the model using a Hierarchical agglomerative clustering model. With regard to the number of clusters, internal and external criteria are used. As internal criteria, the AIC and BIC are used. As external criteria, we also rely on the straightlining indicators described above to determine the number of clusters that best separate straightlining from non-straightlining. As before, up to 15 clusters are considered.
Results
Commitment Pledge
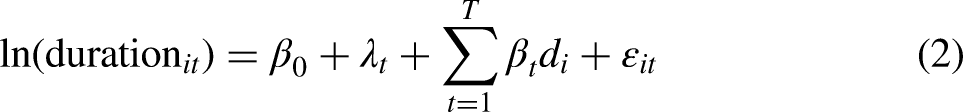
We estimate the effect of receiving a commitment pledge on various data quality indicators. Table 1 reports the effects on failing the attention check and any item nonresponse. There is no statistically significant difference between the experimental groups for any of the indicators. Similarly, there is no significant difference with regard to break-offs (24.4% for the no pledge group; 25.0% for the pledge group). The Online Supplement G provide more insights into the break-offs in Study 2.
Differences in Data Quality Measures Across Pledge Conditions.
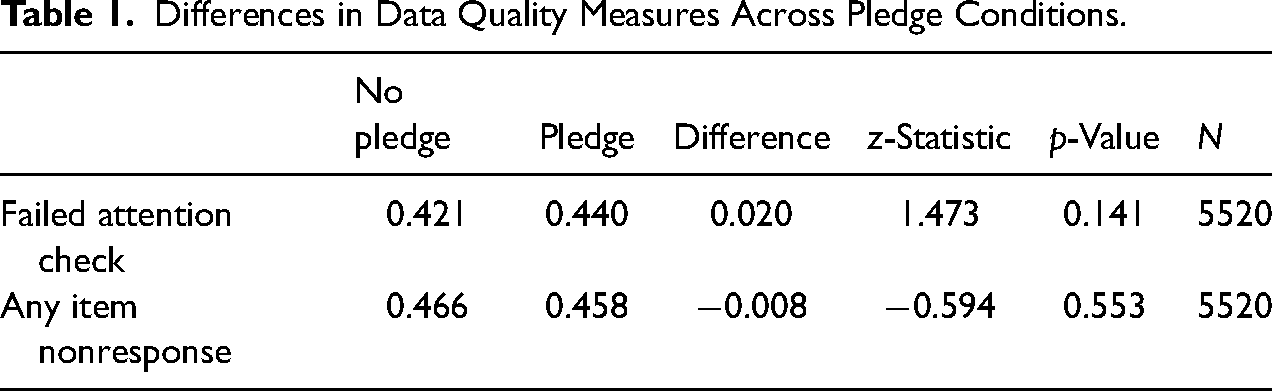
Figure 1 shows the differences between the predicted proportion of straightlining for respondents who received the pledge and those who did not receive the pledge for 16 screen-level item batteries (e.g., for the first item battery, the proportion of straightlining is 2 percentage points higher among respondents who received the commitment pledge compared to respondents in the control group). Contrary to expectations, we find slightly higher proportions of straightlining (around 2–3%) among respondents who received the commitment pledge for most item batteries. Given that we do not even observe a positive pledge effect with regard to data quality, fading-out effects are not present.
Pledge effects on straightlining over the questionnaire.
Lastly, we investigate the pledge effect on screen durations. Figure 2 shows the estimated difference between the pledge and no pledge respondents, with the earlier screen asking for the respondent’s age (2 screens before the commitment pledge) as the reference category. Respondents who receive the pledge are slightly faster (
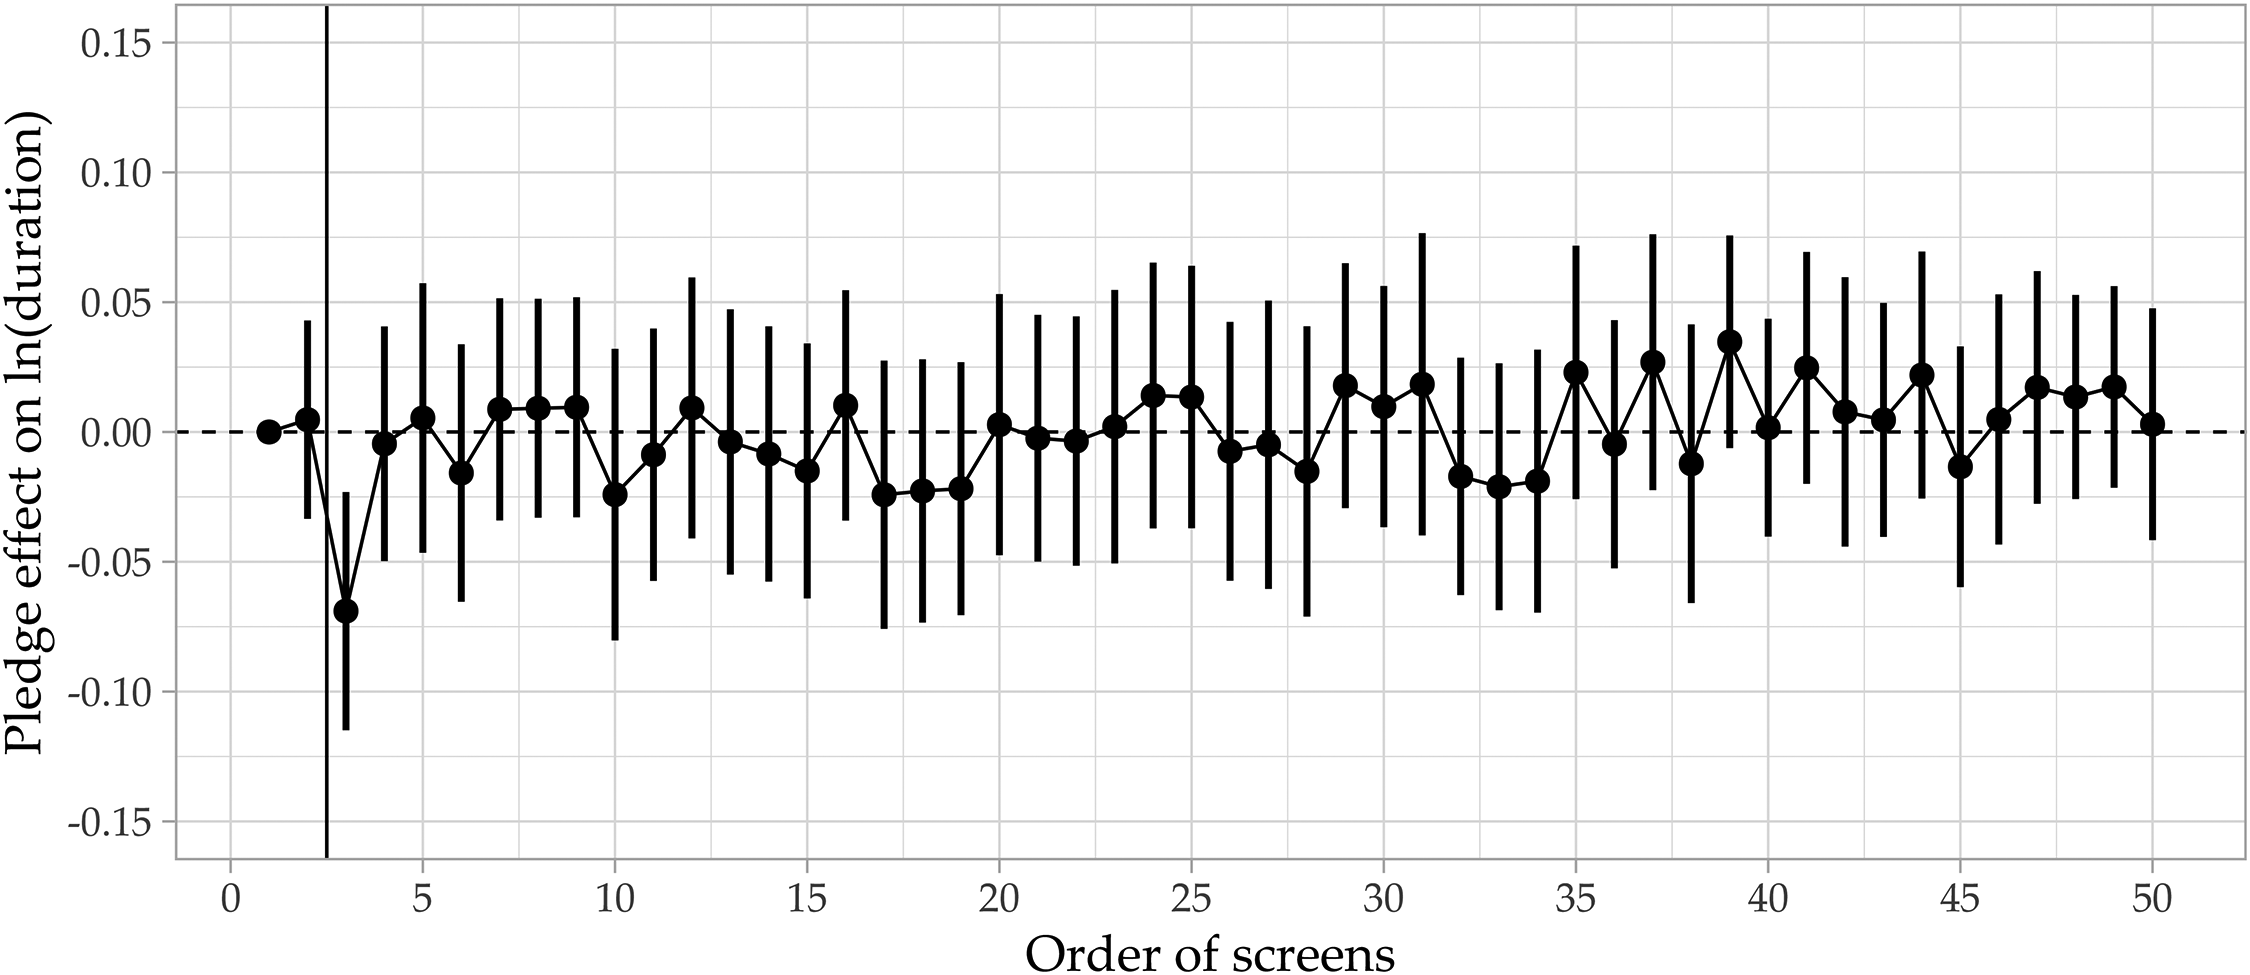
Pledge effects on screen durations over the questionnaire. The vertical line denotes the position of the pledge.
Instructed Response Item (IRI)
For the analysis of the IRIs, we exclude respondents who skipped any item on the preceding screen (4.2%; 1.3% provided no response to any item) to ensure that these respondents do not bias the results, as skipping items may lead to respondents being falsely flagged as inattentive for the Response-IRI group and attentive in the Blank-IRI group. Table 2 reports the proportion of respondents in both IRI groups who fail the respective IRI. 46.0% failed to select the requested response option, whereas 62.8% failed to leave the response blank.
2
Assuming that the true proportion of inattentive respondents is 62.8% and that inattentive respondents provide random responses, the expected proportion of inattentive respondents selecting the correct requested response option on a 5-point scale by chance is
Differences in Failure Rates Across Experimental Conditions.
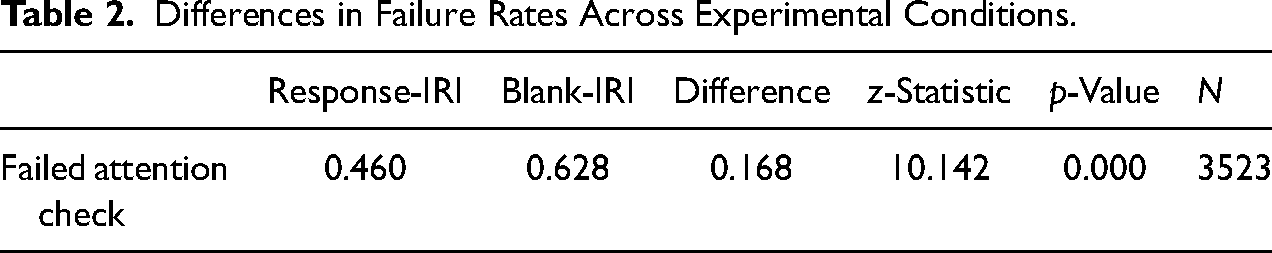
Concerning the median time spent on the screen of the IRI experiment, we find that the control group (9.0 seconds), the failing respondents in the Response-IRI group (8.0 seconds), and the failing respondents in the Blank-IRI group (8.0 seconds) have similar durations. However, the respondents who passed the check in the Response-IRI group (18.0 seconds) and the respondents who passed in the Blank-IRI group (23.4 seconds) differ by more than five seconds in their median durations. A potential explanation is that the Blank-IRI is more difficult to understand and thus requires more time. In this case, we would also expect that some respondents noticed the Blank-IRI but failed it due to its difficulty which would imply that failing respondents took longer in the Blank-IRI group, which is not what we find. Hence, the screen durations support the notion that some respondents who pass the Response-IRI do so by chance.
Concerning spillover effects, Figures H1 and H2 in the Online Supplement depict the differences between the treatment groups and the control group with regard to straightlining and screen durations. In both figures, the item battery or screen duration preceding the experiment screen are used as reference categories and the depicted estimates report the difference between the respective treatment group and the control group. For straightlining, we do not observe any impact on succeeding item batteries. For the durations, we find that both treatment groups take slightly longer on the screen after the attention check, however, this effect does not prevail for further screens.
Clustering Timestamp Data
In this section, the results of the clustering approaches for the Study 1 data are described. The results using the Study 2 data are provided in the Online Supplement I. For the distance-based clustering approach based on the relative ranks, the internal criteria suggest a 2-cluster solution (11 indices suggest a 2-cluster solution, 7 indices suggest a 3-cluster solution). The external criteria suggest a 7-cluster solution on which the AIC and BIC agree for all four item batteries (see Online Supplement J). Figures 3 and 4 depict the results for both cluster solutions. The x-axis denotes the order of the screens in the questionnaire and the y-axis denotes the proportion of respondents within each cluster that belong to the respective decile. The relative ranks are aggregated into deciles to simplify interpretation.
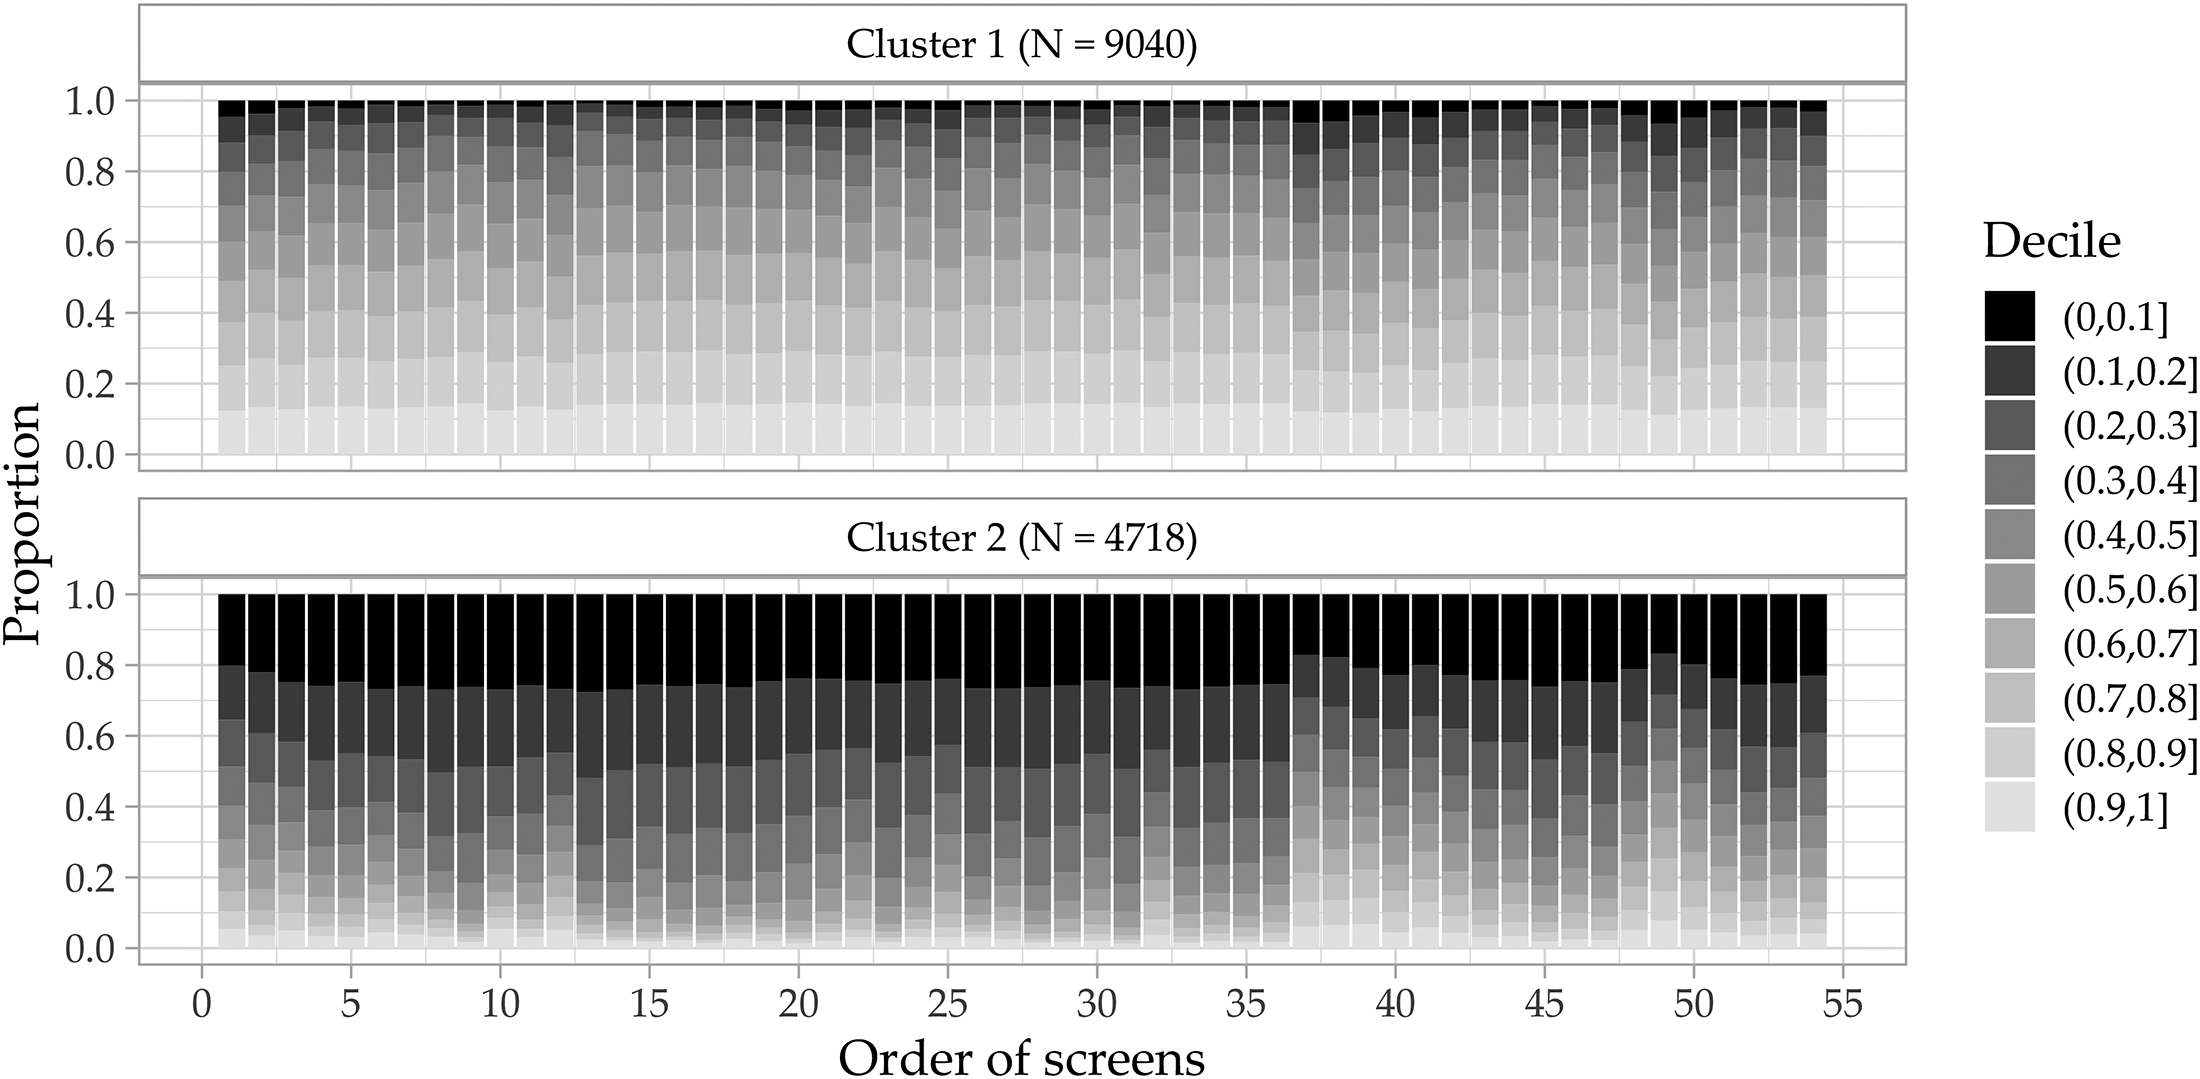
Duration decile composition of 2-cluster solution.
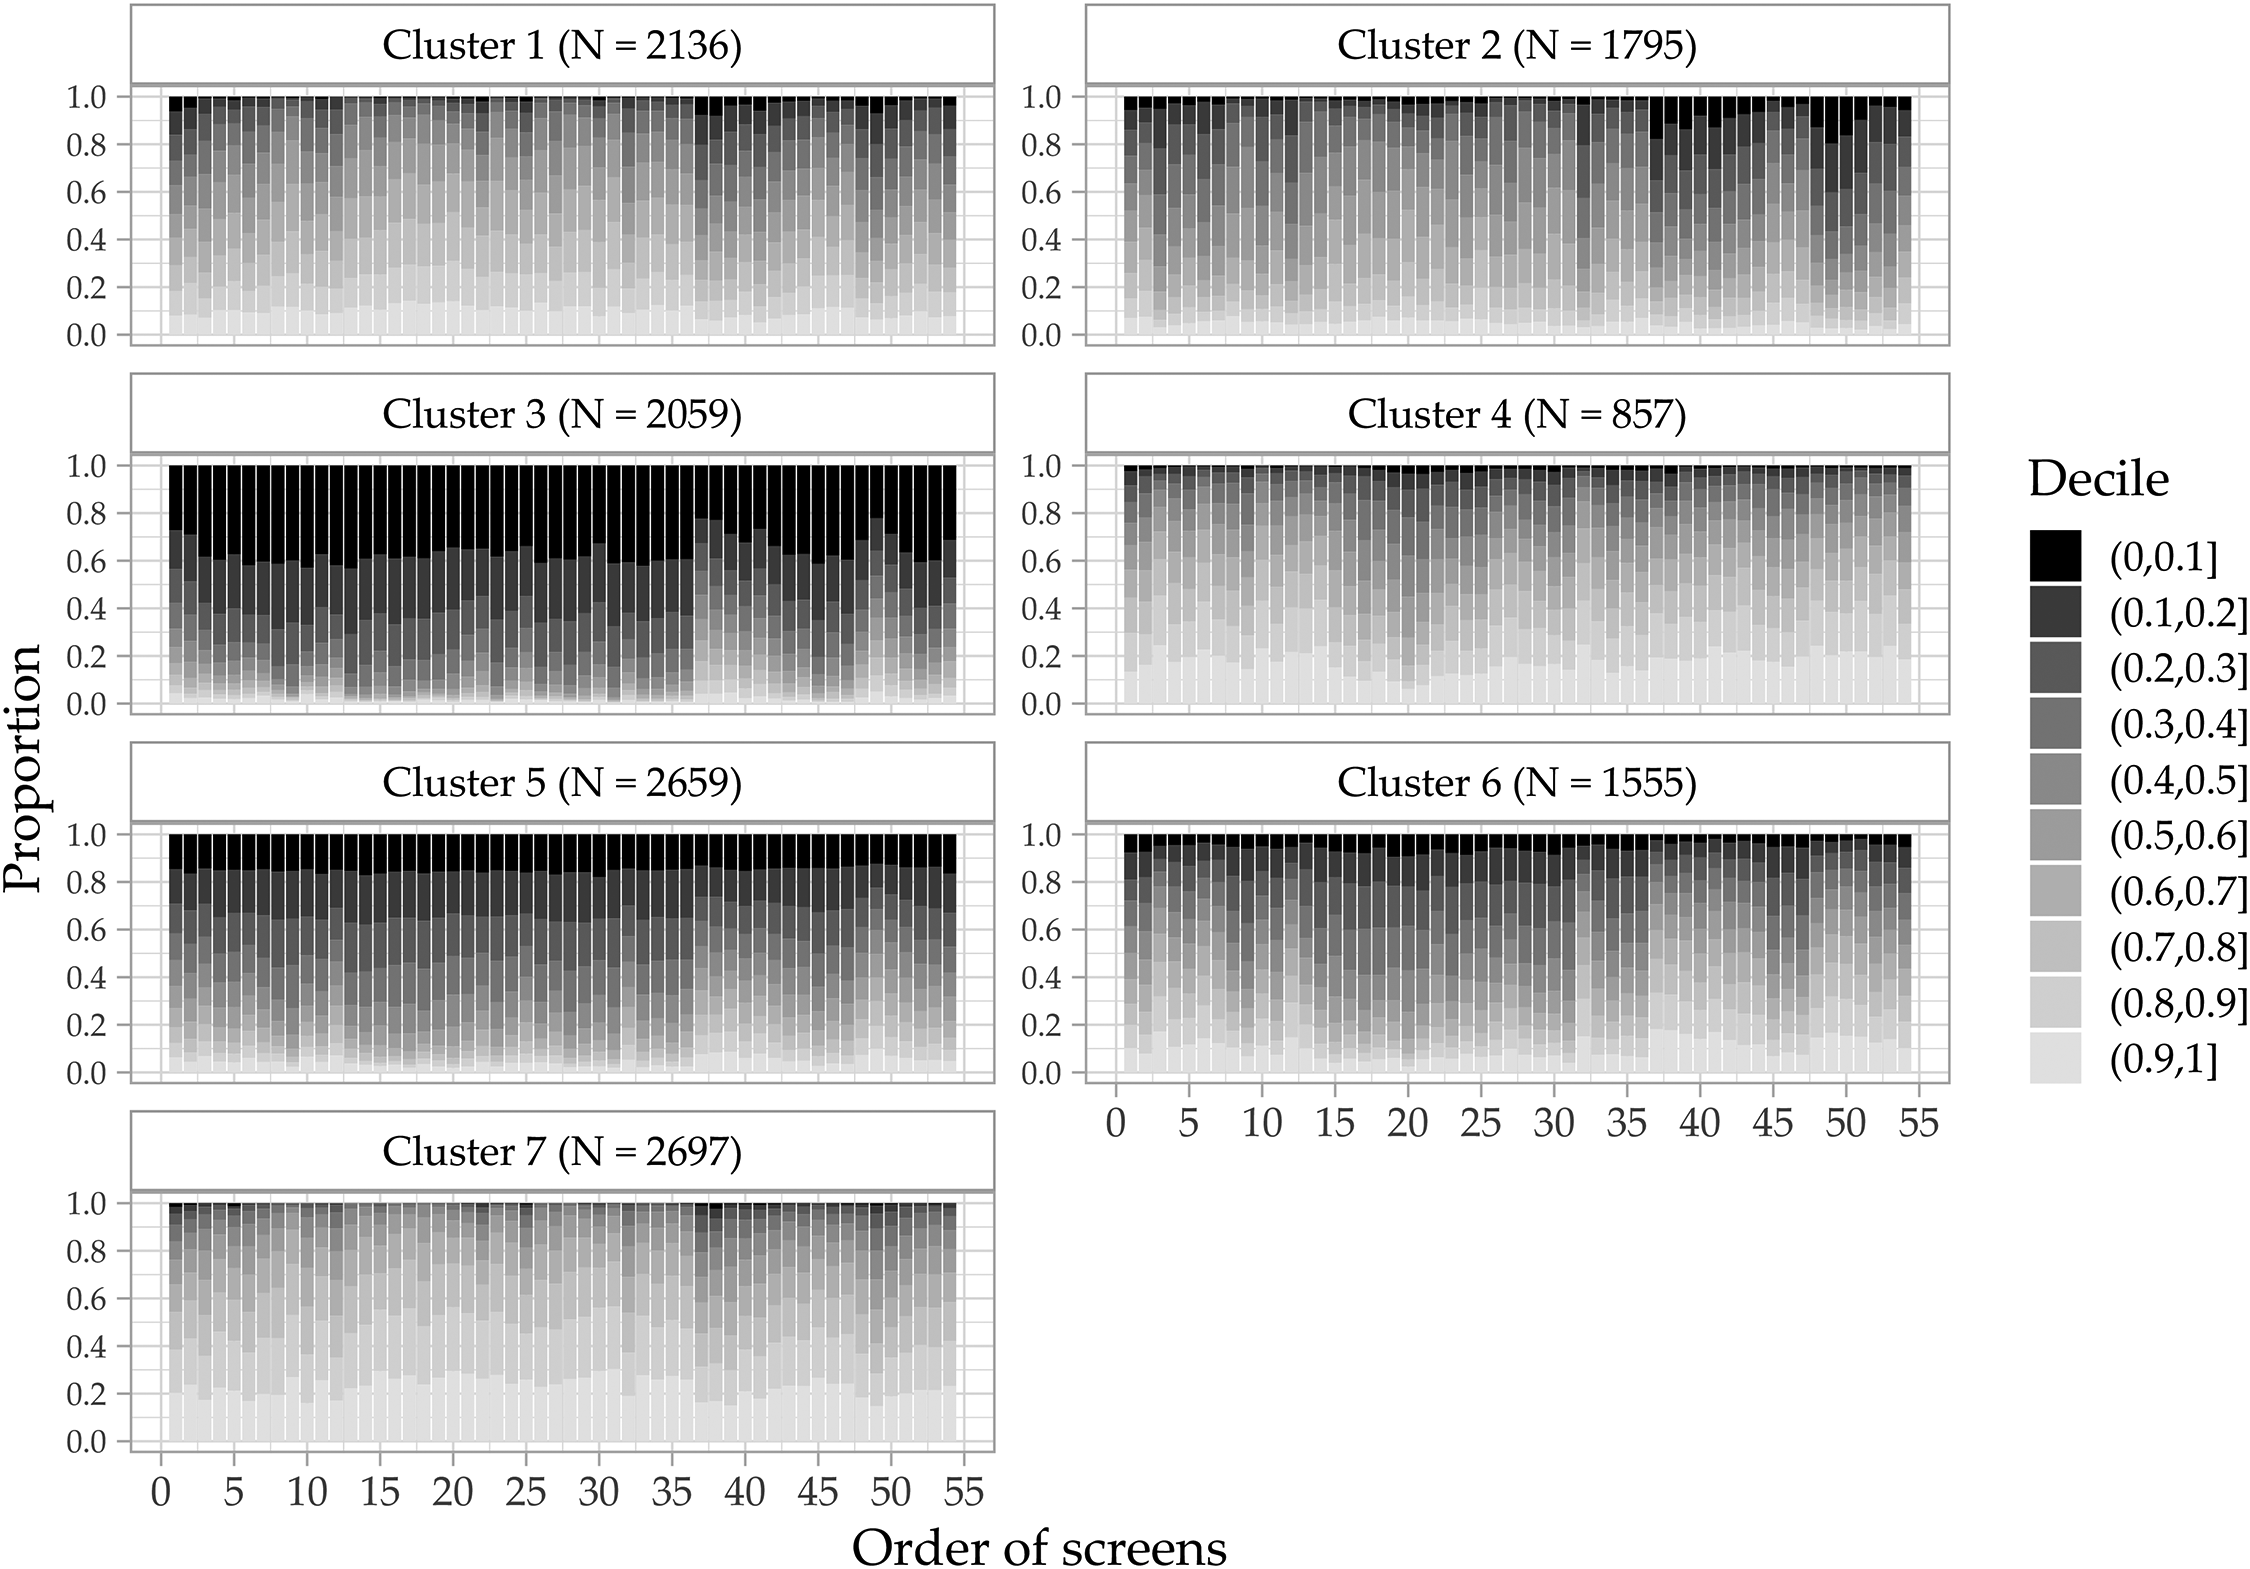
Duration decile composition of 7-cluster solution.
The 2-cluster solution assigns respondents either to the rather fast Cluster 2 (on average 43.7% of respondents lie within the two fastest deciles and only 6.5% lie within the two slowest deciles) or a rather slow Cluster 1 (on average only 7.6% of respondents lie within the two fastest deciles and 27.0% lie within the two slowest deciles). While the cluster compositions are relatively stable throughout the questionnaire, we observe a slight change from screen 37 onward, where Cluster 1 gets slightly faster and Cluster 2 gets slightly slower. The socio-demographic items start at this point in the questionnaire for which even attentive respondents are expected to provide rather fast responses.
Figure 4 shows the decile compositions for the 7-cluster solution, which provides a more fine-grained depiction of screen time patterns in the data. Cluster 3 accounts for 15% of respondents and is characterized by very short durations. 36.4% of all durations are in the first decile. Except for a slight decrease in relative durations at the beginning and the shift for the socio-demographic questions, this pattern is stable over the entire questionnaire. All 11 respondents flagged by the industry standard of one-third of the median completion time lie within this cluster. Cluster 5 shows similar signs of very short durations, though to a lesser extent. Note that Clusters 3 and 5 are subsets of Cluster 2 in the 2-cluster solution. Clusters 4 and 6 show a lower prevalence of very short durations but seem to speed up in the middle of the questionnaire. On the contrary, Clusters 1 and 2 seem to speed up for the socio-demographic questions. Cluster 7 is a slow cluster, with more than 20% in the slowest decile throughout the questionnaire. In summary, Clusters 3 and 5 contain the respondents with the shortest relative durations, whereas Clusters 4 and 6 speed up for the middle part of the questionnaire and Clusters 1 and 2 for the socio-demographic section at the end.
Next, we compare the cluster solutions with regard to the prevalence of straightlining. Table 3 reports the proportion of straightlining by item battery. As the 7-cluster solution was determined based on separating straightlining from non-straightlining, we expect larger discrepancies for the 7-cluster solution. Since straightlining might also arise from a lack of cognitive skills (e.g., Kim et al. 2019), a perfect classification of straightlining is unlikely. For the 2-cluster solution, the prevalence of straightlining is at least twice as high in Cluster 2 than in Cluster 1 for all item batteries except Q19. Hence, the straightlining indicator supports the notion that Cluster 2 is more prone to inattentive behavior. For the 7-cluster solution, several notable differences arise. First, Cluster 3 – the cluster with the shortest relative durations – never has the largest proportion of straightlining across all clusters, although its values are generally high. Second, Cluster 7 has the smallest proportions of straightlining across all item batteries. Third, Clusters 1 and 2 which are rather fast for the socio-demographic items have minor proportions of straightlining. Fourth, Clusters 4 and 6 which speed up during the questionnaire have proportions of straightlining similar to Clusters 3 and 5. This is particularly noteworthy as they are assigned to the slower cluster in the 2-cluster solution. In addition, Cluster 4 has more than 10% of durations in the slowest decile throughout most of the questionnaire, which is in line with slow inattentive responding proposed by Read, Wolters, and Berinsky (2021). In this case, increasing the number of clusters and consulting external criteria results in the detection of variation throughout the questionnaire which uncovers special clusters of likely inattentive respondents.
Proportion of Straightlining Across Clusters, Distance-Based Approach.
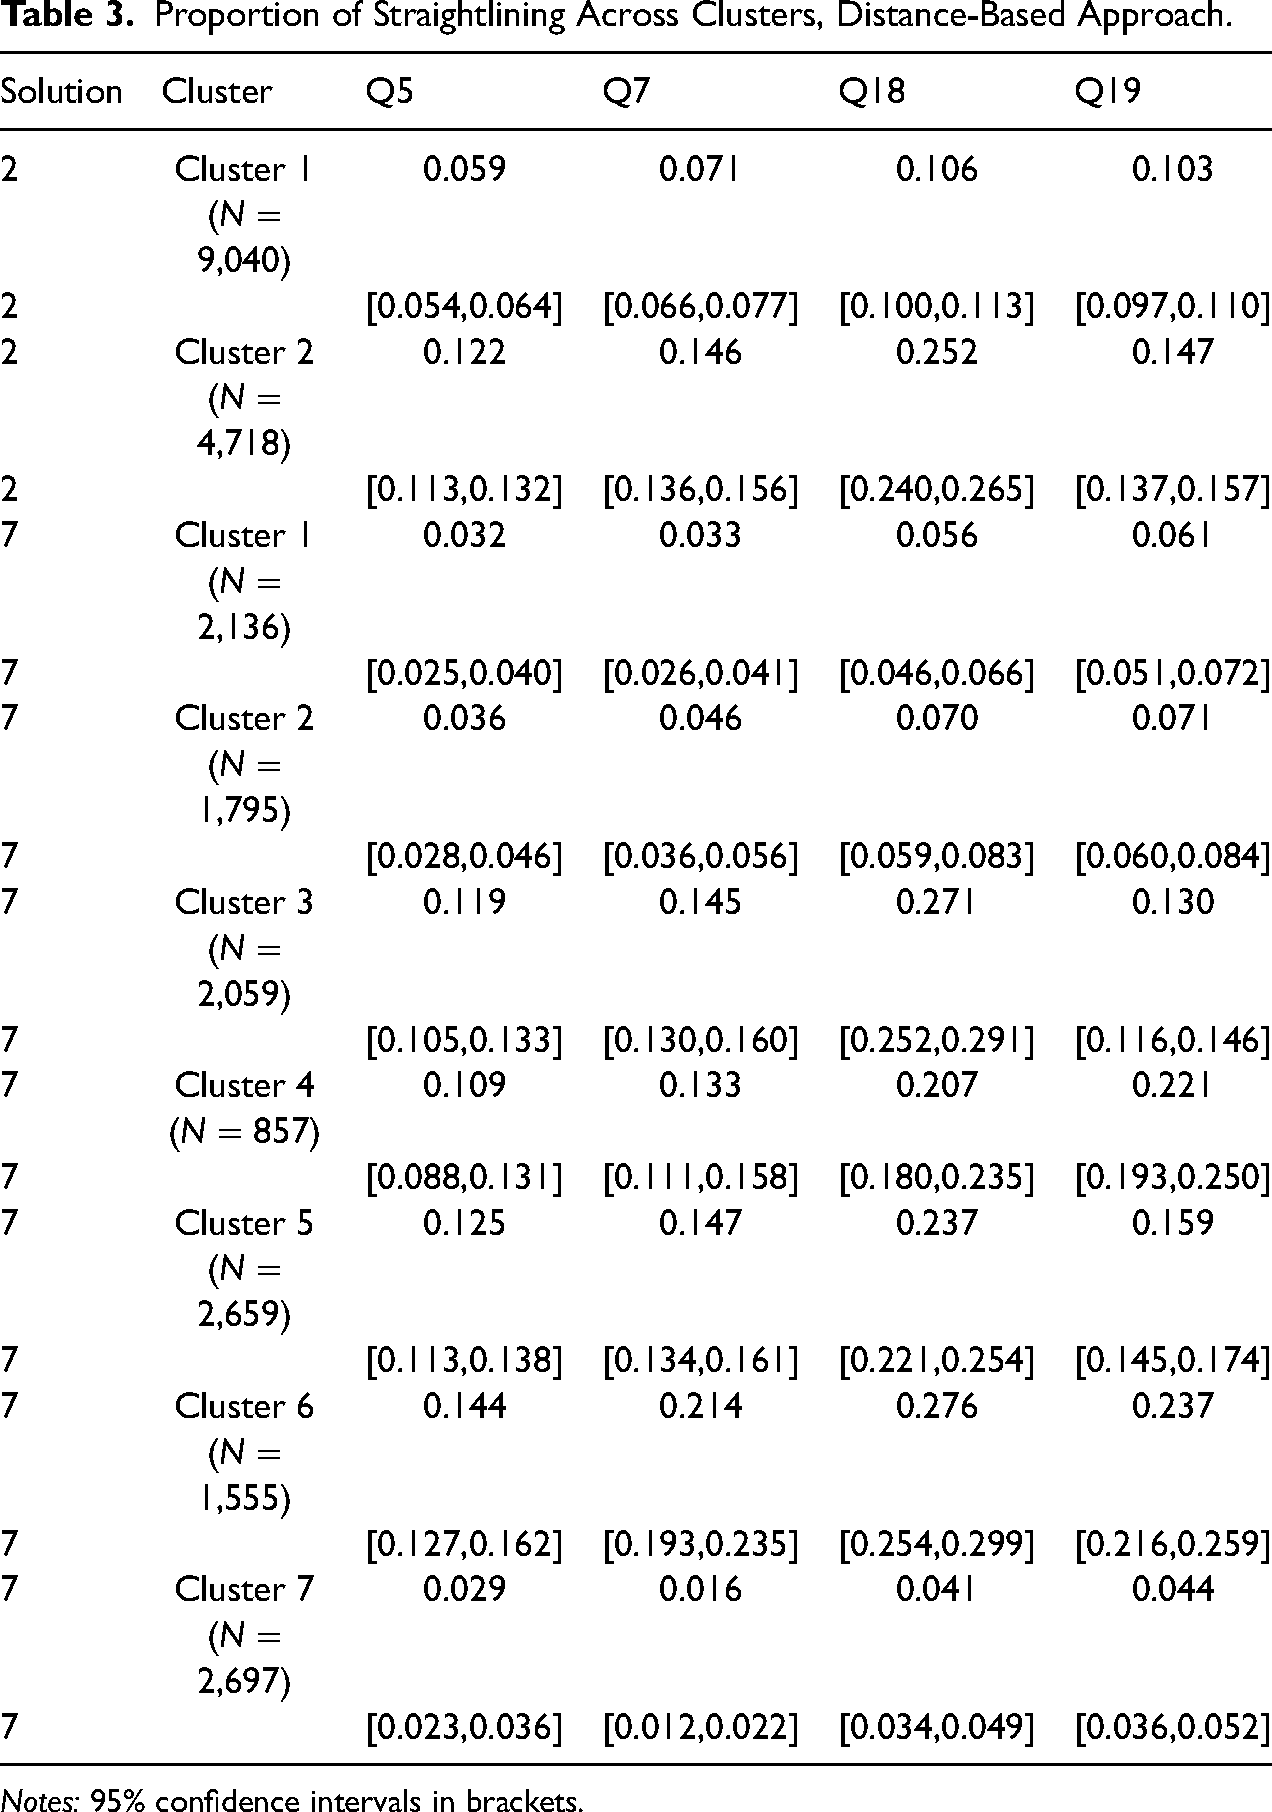
Notes: 95% confidence intervals in brackets.
To assess the performance of the clustering approach with regard to widely established attention checks, we use the Study 2 data (see Online Supplement I for the clustering results). Note that this validation approach is limited by the fixed position of the attention check in the questionnaire (screen 11), while the timestamp clustering approach considers the entire questionnaire. Furthermore, as shown above, attention checks may measure inattention erroneously. Table 4 shows the proportion of attention check failures across clusters. Respondents in Clusters 3, 8, and 9 have failure rates of around 5%, while the proportion is between 70 and 80% for Clusters 2, 6, and 7. Clusters 1, 4, and 5 lie in between. These patterns are similar to the results for straightlining in Study 1.
The results for the model-based clustering approach in Study 1 are discussed in detail in the Online Supplement K as we mainly use it as a benchmark approach. The results suggest a 5-cluster solution for the internal criteria and a 4-cluster solution for the external criteria. To compare the two clustering approaches, we first assess to which extent the distance-based and the model-based approaches assign respondents to the same clusters. We consider the 7-cluster solution for the distance-based approach and the 5-cluster approach for the model-based approach. The Adjusted Rand Index is 0.096, which signifies low agreement between the two approaches. Considering only the most suspicious clusters (for both approaches, Cluster 3), we find that 95.9% of respondents assigned to Cluster 3 in the model-based approach are assigned to the suspicious Clusters 3, 4, 5, and 6 in the distance-based approach. On the contrary, 64.3% of respondents assigned to Cluster 3 in the distance-based approach are assigned to Cluster 3 in the model-based approach, whereas the remaining majority (28.6%) is assigned to the “mixed” Clusters 4 and 5.
Proportion of Respondents Failing the Attention Check Across Clusters, Distance-Based Approach.
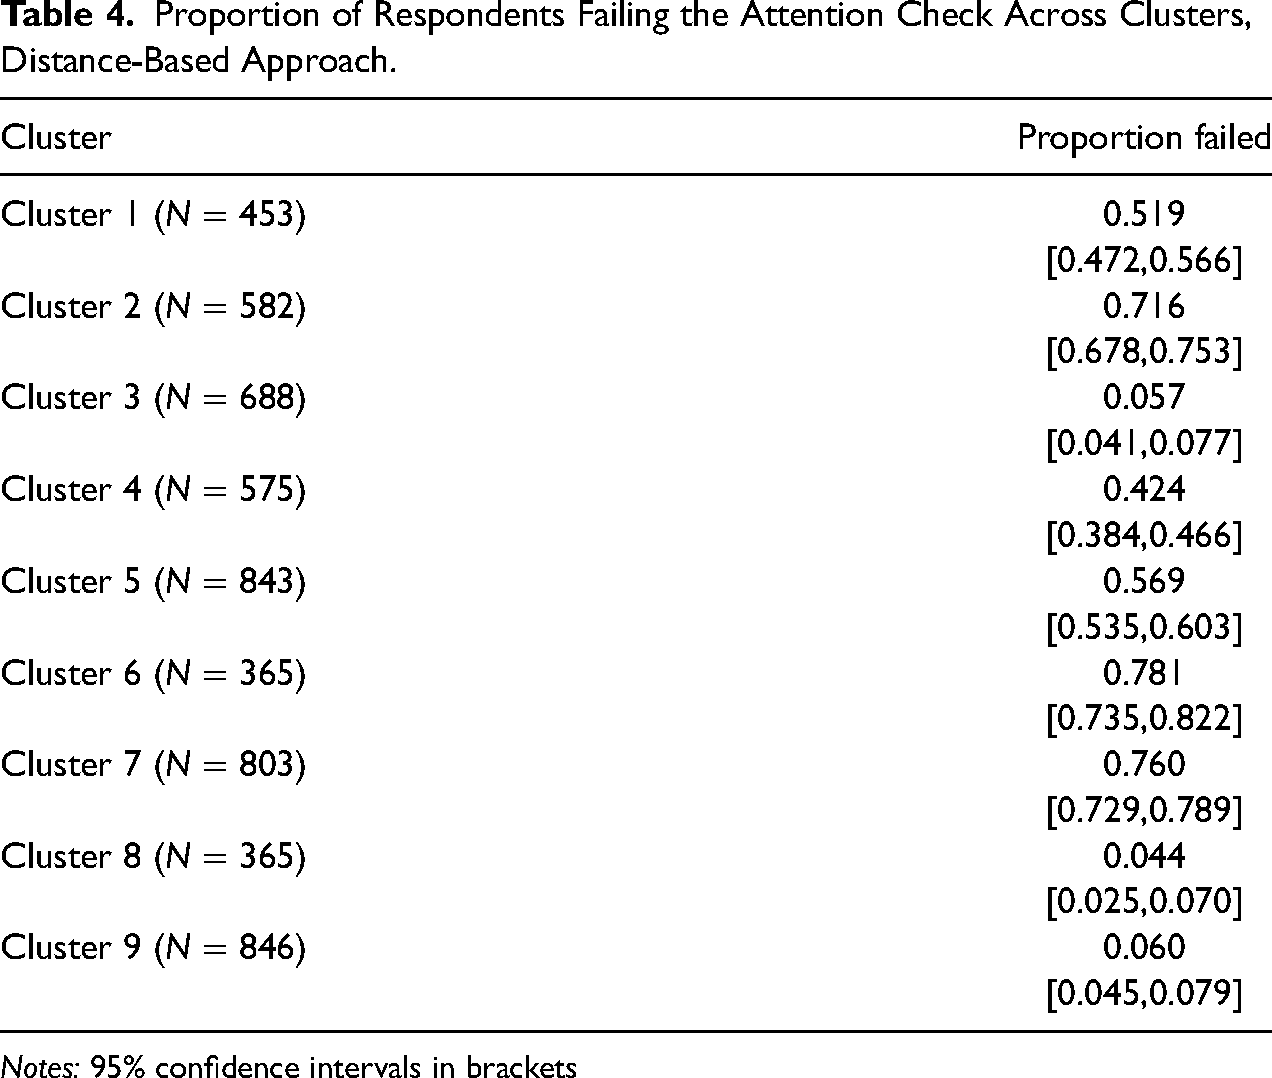
Notes: 95% confidence intervals in brackets
Given the disagreement between both approaches, we evaluate which cluster solution performs better with regard to separating straightlining from non-straightlining. We fit separate logistic regressions with straightlining indicators as dependent variables and the cluster assignment variables for each item battery and cluster solution. Across all item batteries, the BIC suggests a better model fit for the distance-based approach (results are reported in Online Supplement J). Hence, the distance-based approach performs better with regard to disentangling likely attentive respondents from inattentive respondents.
Impacts on Substantive Analyses
To analyze the impacts of inattentive responding on univariate and regression analyses, we rely on the Study 1 data and the cluster analysis results. For the impacts on analyzing survey experiments, we reanalyze the data used by Read, Wolters, and Berinsky (2021).
Univariate Analysis
To assess the influence of the likely inattentive respondents on substantive research results, we calculate average values for all Likert-scaled items and items with Yes-No response options by cluster. As for the timestamps analysis, we exclude items subject to preceding filters. The response options are re-scaled ranging from zero to one to enable comparisons across differently scaled items. Figure 5 depicts these averages item-by-item for the distance-based 7-cluster solution. The same figure for all other cluster approaches and solutions is provided in the Online Supplement L.
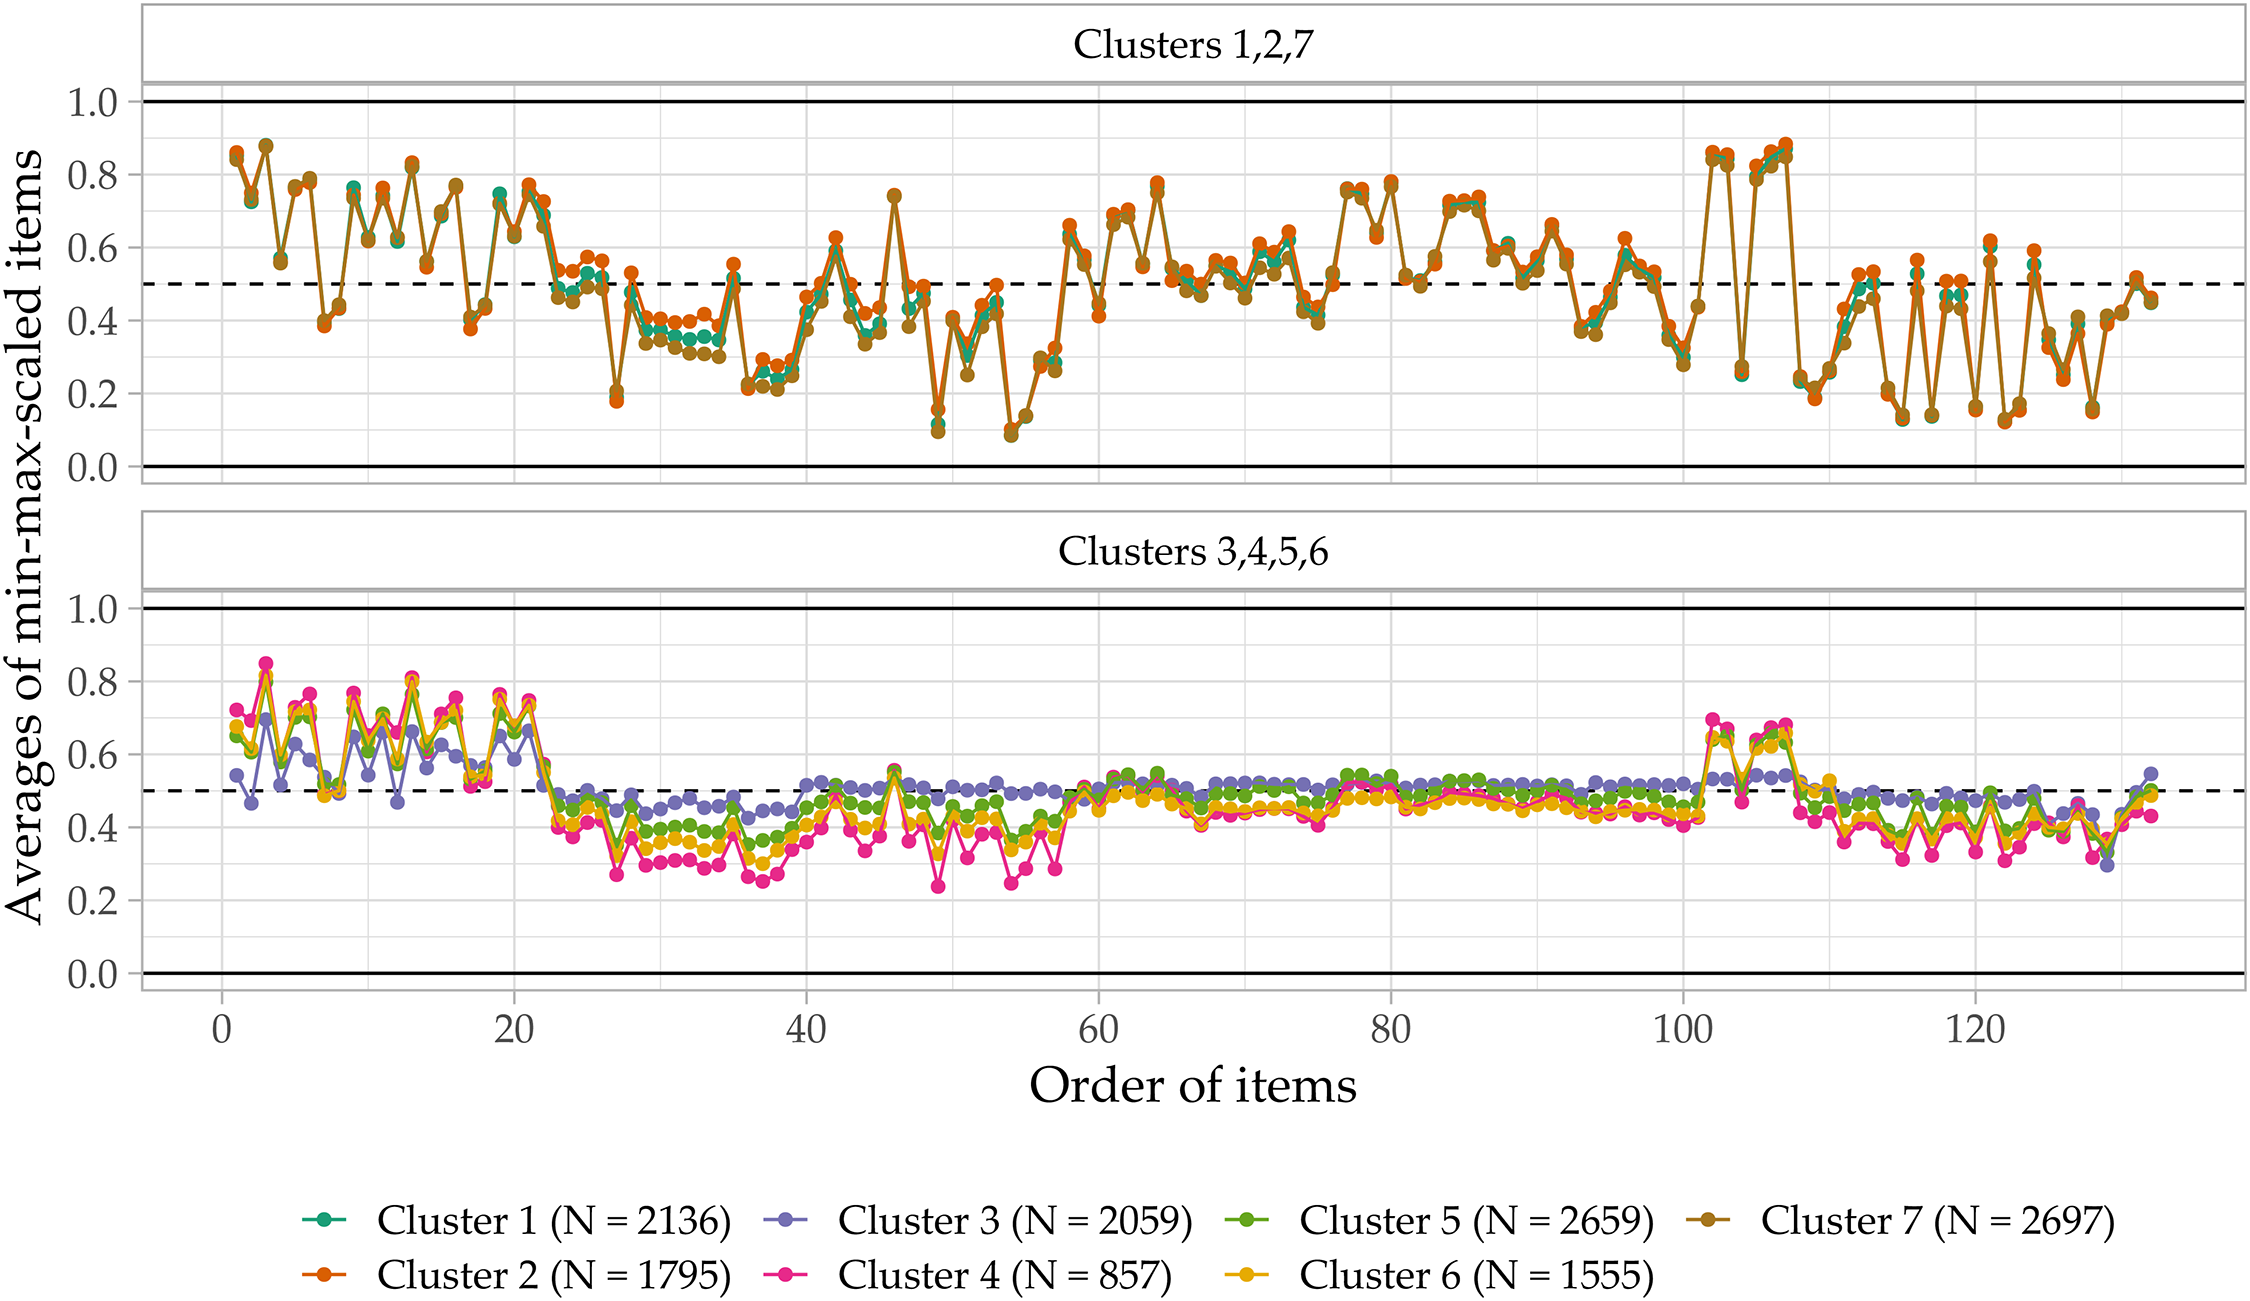
Development of scaled average responses by cluster over the questionnaire.
The average responses differ widely across clusters. For the likely attentive clusters (i.e., 1, 2, 7), the averages vary across items, with some averages close to the highest response option and others close to the lowest response option. These patterns are consistent across clusters. For the likely inattentive clusters (i.e., 3, 4, 5, 6), however, the averages show less variation and vary around 0.5, i.e., the mean of the response options. Furthermore, this lack of variance across items differs across clusters as Cluster 3 deviates from 0.5 by more than 5 percentage points in only 18.2% of all items, whereas the other clusters show substantially more variation (e.g., 79.5% in Cluster 1). For items with Yes-No response options, averages close to 0.5 indicate random responding. On Likert-scaled items, averages close to the scale midpoint can result from response strategies, such as random responding and middle responding. In our case, middle responding plays only a minor role. For example, for Cluster 3 (i.e., the most extreme cluster) the proportion of respondents selecting the midpoint on 5-point scales is 35.2%. Instead, a mixture of inattentive response strategies (i.e., straightlining of varying scale points, random responding) results in an equal distribution of responses over the response options. These findings also do not support the argument that inattentive respondents try to manipulate substantive outcomes, for example, by intentionally stating that they do not believe in climate change. To illustrate this point, while only 32.2% of respondents in Cluster 3 stated that they are moderately or very sure climate change is happening (compared to 76.0% in the likely attentive clusters), 62.3% of respondents in Cluster 3 rather contradictorily stated that their feelings about climate change affect their daily life in a moderately, very much, or extremely negative way (compared to 32.5% in the likely attentive clusters).
Regression Analysis
To show the potential impacts of inattentive responding on regression coefficients, we investigate socio-demographic predictors of climate change belief in the data (see Hornsey et al. 2016). Table 5 reports the results of a simple logistic regression model with a binary dependent variable on whether the respondent is sure that climate change is happening (= 1 if the respondent is moderately or very sure it is happening; = 0 if the respondent is very, moderately, or slightly sure it is not happening, doesn’t know, or is slightly sure it is happening) and the respondent’s age, area, education, gender, and party identification as explanatory variables. The model is fitted for the full sample and the sample without the likely inattentive Clusters 3, 4, 5, and 6. We observe multiple differences with regard to the size of the coefficients and their statistical significance. Although the coefficient for age is small, its size increases slightly. Excluding the likely inattentive clusters leads to statistically significant differences between areas. Concerning education, the coefficient for the highest-educated respondents is no longer statistically significant. The difference between males and females is reduced by more than 50% and the difference between Republicans and Democrats increases substantially. Notably, despite reducing the sample size by more than 50%, standard errors remain similar in size. Concerning the mechanisms behind the change in coefficients, there are two potential explanations. First, the subgroups for which coefficients change are particularly prone to inattentive responding (i.e., highly-educated respondents). Second, as the source of sociodemographic information is the questionnaire itself, inattentive respondents might misreport this information (i.e., by randomly selecting responses). Hence, the true mechanism remains unknown in our analysis.
Average Marginal Effects for Logistic Regression with Certainty about Climate Change as Dependent Variable, Study 1 Data.
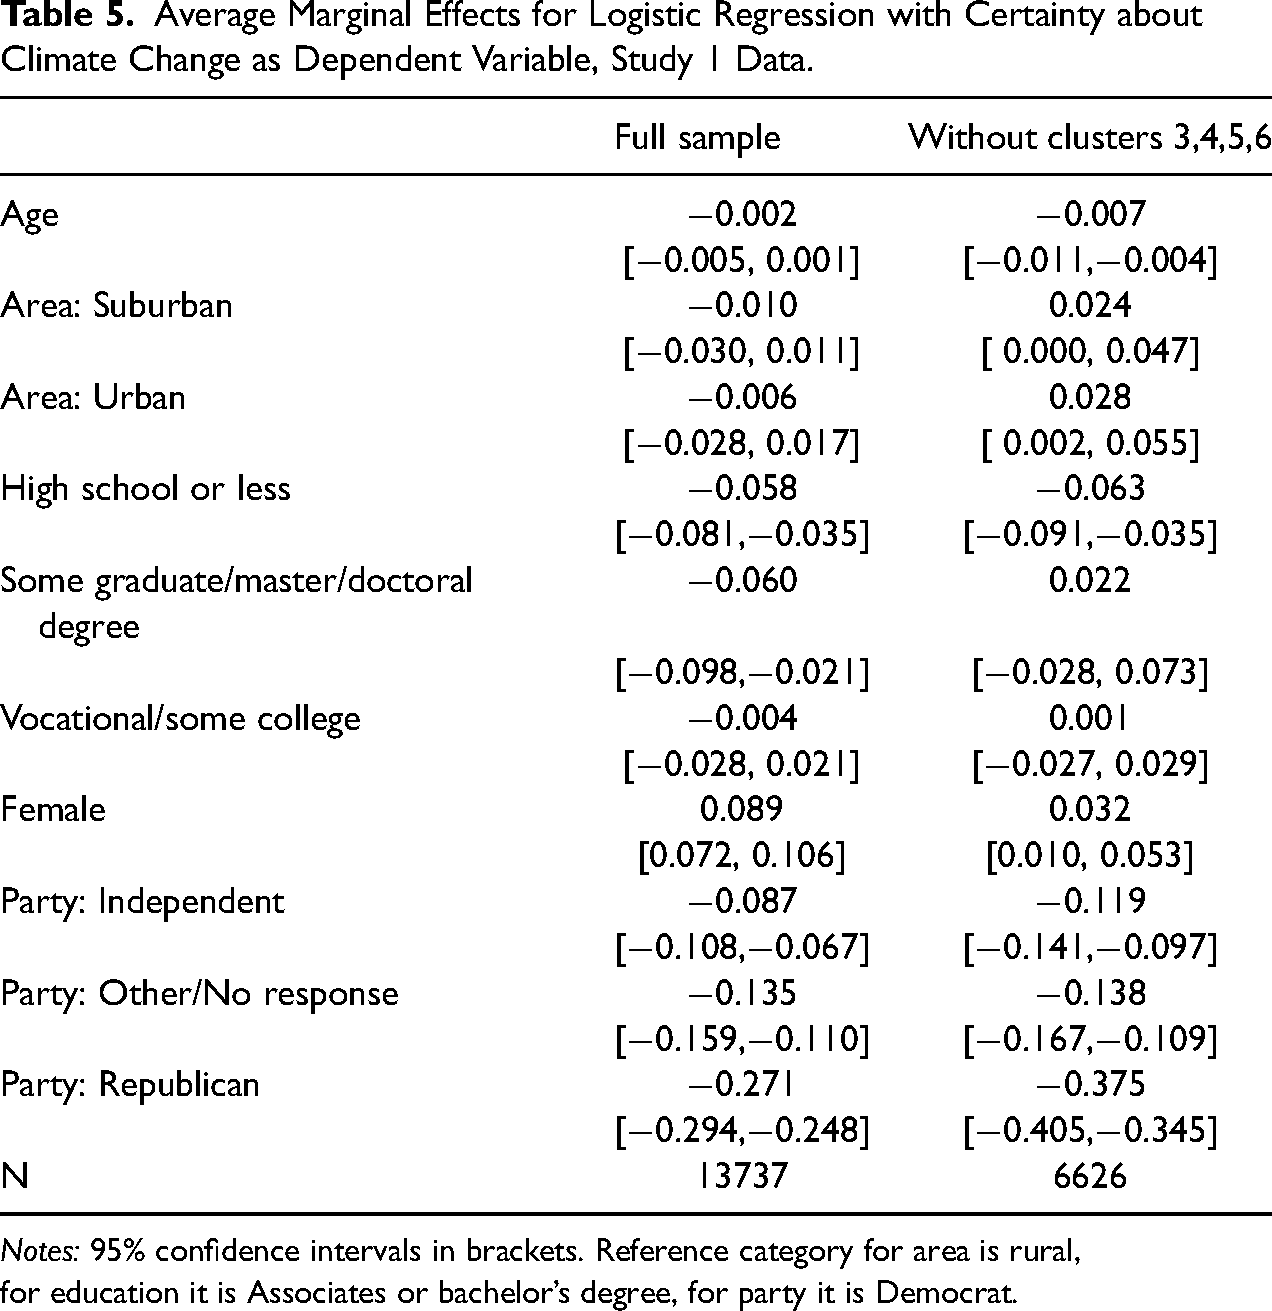
Notes: 95% confidence intervals in brackets. Reference category for area is rural,
for education it is Associates or bachelor’s degree, for party it is Democrat.
Survey Experiment
To illustrate the consequences of inattentive responding for the analysis of survey experiments, we follow Read, Wolters, and Berinsky (2021) and Kane, Velez, and Barabas (2023) who suggest stratifying treatment effects by categories of inattention. We use the same data as Read, Wolters, and Berinsky (2021) available online (Read, Wolters, and Berinsky 2022) to obtain a comparison with their modeling approach and because their data contains the famous “Asian disease” experiment on framing effects and risk aversion by Tversky and Kahneman (1981) (see Table M1 for the questionnaire text and Druckman 2001: for an in-depth discussion of the experiment and effect sizes). We use all screen durations before the actual experiment to avoid post-treatment bias (30 of 40 screens). Four attention check questions are employed as external indices which suggest either a 4- or 10-cluster solution (see Figures N1, N2, and N3). Figure 6 depicts the CATEs by cluster for both solutions. The green line denotes the estimated effect for the full sample. These results replicate the finding of highly heterogeneous effects by Read, Wolters, and Berinsky (2021). However, our distance-based clustering approach allows for a finer distinction between respondent types which leads to larger differences between clusters (for Read, Wolters, and Berinsky 2021: the CATEs are 0.36, 0.21, and 0.29). As we still use the majority of screens, we apply a simulation approach to test whether fewer screens would still allow for identifying the heterogeneity just as well. Figure N4 in the Online Supplement shows the CATEs based on 100 variable draws of size 5, 10, 15, and 20, where similar changes between clusters can be seen, as in Figure 6. Hence, our proposed clustering approach may serve the same purpose as the mock vignettes developed by Kane, Velez, and Barabas (2023) without increasing response burden and requiring researchers to design appropriate mock vignettes for their experiments.
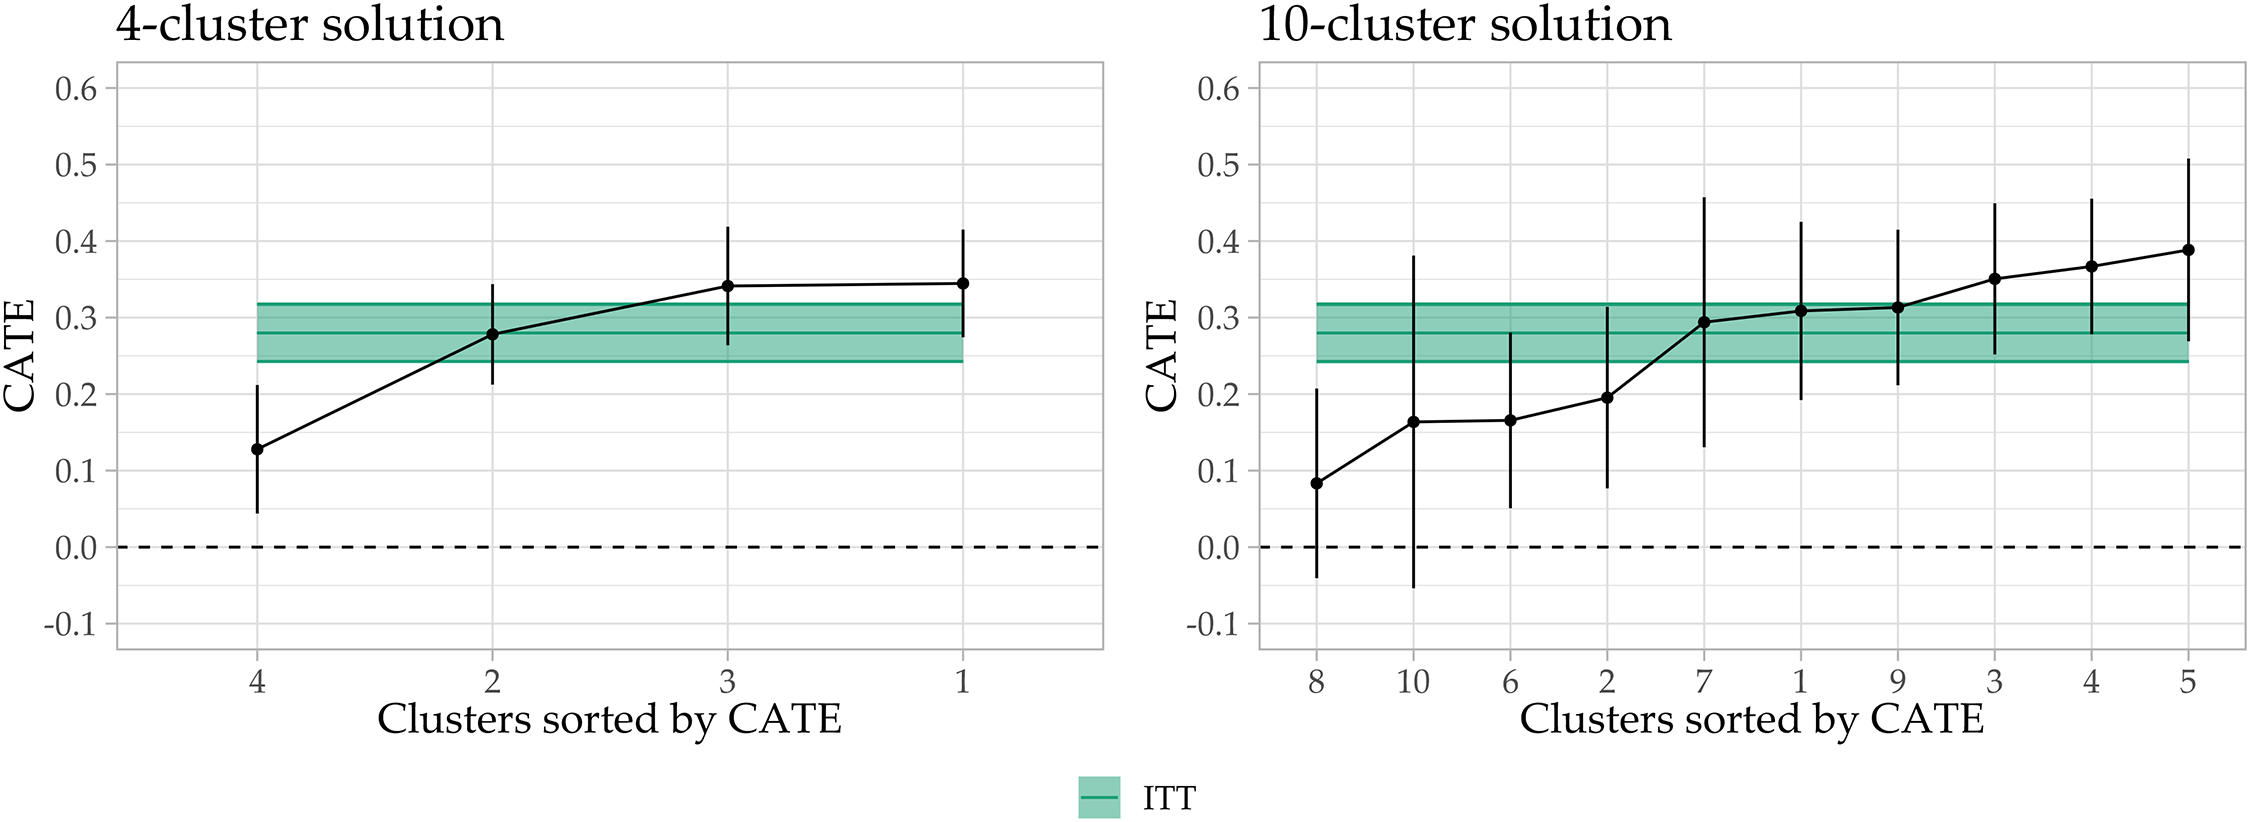
Conditional average treatment effects by cluster, data from Read, Wolters, and Berinsky (2021).
Recommendations for Practitioners
As preventing and detecting inattentive respondents in web surveys is a practical problem, we want to provide some recommendations based on our results. These recommendations presume that practitioners carefully developed and tested their questionnaire.
Our results show that commitment pledges may not be enough to prevent inattention. To ensure that respondents at least read the pledge, practitioners may add warnings when respondents proceed too fast on the respective screen (Conrad et al. 2017). Therefore, we recommend to rely on other, or at least additional, measures of preventing and—if prevention is not feasible—detecting inattentive respondents.
Our second recommendation concerns IRIs. Given that the IRI results varied substantially across instructions (Blank-IRI vs. Response-IRI), we recommend instructing respondents not to provide any response to the attention check item to ensure that random responding does not introduce false negatives. Researchers should accompany the Blank-IRI with a detailed analysis of item nonresponse to detect respondents with high proportions of item nonresponse who might pass the IRI (in our case, such respondents were a minor problem). However, other potential problems associated with attention checks, such as increased response burden, deliberate defiance, and signaling distrust of respondents should be kept in mind when implementing attention checks (Silber, Roßmann, and Gummer 2022). Furthermore, practitioners should keep in mind that IRIs measure attention at a specific point in the questionnaire and might not approximate attention at earlier or later points well. To obtain a more reliable measurement of respondent attention, multiple authors suggest using numerous attention checks throughout the questionnaire (Berinsky et al. 2024; Ward and Meade 2023). However, such approaches might exacerbate the negative consequences of attention checks mentioned above.
Regarding the proposed clustering method, practitioners should ensure a-priori that timestamp data are collected for each screen, though it is fairly standard in web surveys. As the method does not require sophisticated preprocessing or modeling steps, it can be efficiently applied after data collection to identify and assess the prevalence of likely inattentive responding (in our case, up to 52% in the Study 1 data). Researchers should not rely on the industry standard threshold for durations (i.e., below one-third of the median completion time) as it flags significantly fewer inattentive respondents (in our case, only 0.08% and 0.9% of the respective study samples). While using internal criteria (e.g., cluster validity indices) is likely to lead to only a small number of clusters being identified (separating the fast and slow respondents), external criteria (e.g., straightlining) can provide more detailed insights and identify more nuanced response behaviors. If no external criteria are available, practitioners may exploratively set the number of clusters higher to infer whether particularly suspicious clusters or clusters with noteworthy response patterns are likely to emerge. The data visualizations introduced in this study may aid in identifying such patterns (see Online Supplement 2 for code and detailed instructions). We note, however, that implementing the method in “real-time” during the field period may be limited by the sample composition. As the cluster analysis is based on relative screen durations, a respondent’s cluster assignment may change over the course of the field period if, for example, more inattentive respondents respond later in the field. However, the most extreme cases can still be identified early on as they will be assigned to the most suspicious clusters throughout the field period. Lastly, we recommend that researchers do not exclude likely inattentive clusters from their analysis, but rather stratify their results by the identified clusters (see Section Survey Experiment for an example). Such approaches avoid excluding false-positives, highlight the susceptibility of the data and analysis to inattentive responding, and limit the researcher’s degrees of freedom and their negative consequences (in particular, when the number of clusters is exploratively determined).
Discussion
This study carried out multiple experiments and analyses on preventing and detecting inattentive respondents in web surveys. We found that requesting respondents to commit to providing high-quality responses had no effects on data quality, which is in contrast to previous research on commitment pledges (Cibelli 2017; Conrad et al. 2017; Hibben, Felderer, and Conrad 2022). However, the results are in line with previous research that highlights the difficulty of inciting respondents to be more attentive (Berinsky et al. 2024; Berinsky, Margolis, and Sances 2016). As identified by an analysis of the time spent on the commitment pledge screen, a potential explanation for the lack of effects is that respondents do not even read the commitment pledge text. Furthermore, we showed that the proportion failing an instructed response item (IRI) depends on its specific instruction and may lead to substantial differences in flagged respondents. In our case, instructing respondents to select a specific response option led to 16.8 percentage points fewer respondents being flagged compared to when the instruction was to leave the item blank, suggesting that many respondents who passed the IRI instructing a specific response did so by chance. We further developed a timestamp-based clustering approach that allows for identifying likely inattentive respondents and classifying respondents who differ in their response behavior, such as those who speed up over the course of the questionnaire (Bowling et al. 2021). The proposed distance-based clustering approach performed better than a mixture modeling approach similar to previously proposed methods in the literature with regard to multiple straightlining indicators. Lastly, our results showed that likely inattentive respondents introduce biases in univariate, regression, and experimental analyses. The magnitude of the biases in univariate and regression analyses exceeded those found in previous studies (e.g., Anduiza and Galais 2017; Greszki, Meyer, and Schoen 2015; Gummer, Roßmann, and Silber 2021).
Our analyses are not without limitations. First, the experiments were implemented in a non-probability web survey for a younger population that is prone to inattention, which may limit external validity. For the commitment pledge experiment, the findings do not necessarily invalidate the use of commitment pledges per se as they might still be effective in other settings less prone to inattention (e.g., with different populations and sampling strategies, see Hibben, Felderer, and Conrad 2022). Similarly, the difference between the IRIs depends on the true proportion of inattentive respondents. As approximately 20% (for a 5-point scale) of inattentive respondents might pass an IRI that requests a specific response by chance, the difference between the investigated IRI versions decreases with a decreasing proportion of inattentive respondents. Second, the proposed cluster analysis method is an unsupervised algorithm and thus does not output clusters with definitive labels. Hence, it is still up to the researcher to decide which clusters should be deemed inattentive. However, the internal and external criteria we used coupled with the proposed data visualization tool can greatly assist with this decision, while still providing leeway on how strict one wants to be with regard to flagging respondents. Third, for the impact on substantive results, we lack true population values and can only estimate differences between likely attentive and inattentive respondents. However, the results are in line with expectations for inattentive respondents who utilize random responding behaviors, which validates the findings. Lastly, the detected prevalence of inattentive responding might be inflated by fatigue effects that increase over the questionnaire. While this is an issue for IRIs, the proposed cluster analysis approach can detect clusters of respondents who get faster as the survey progresses, and thus even alert researchers to potential problems with questionnaire length and design.
Future research may want to replicate our experiments and apply the proposed cluster analysis to data collected from different populations and sampling schemes. Applied researchers who conduct substantive analyses using data collected from similar sources as used here should carefully assess the quality of those data, as non-probability surveys are not only prone to biases due to selection but also potentially substantial amounts of inattentive response behavior as we have illustrated here.
Supplemental Material
sj-pdf-1-smr-10.1177_00491241251345457 - Supplemental material for Evaluating Methods to Prevent and Detect Inattentive Respondents in Web Surveys
Supplemental material, sj-pdf-1-smr-10.1177_00491241251345457 for Evaluating Methods to Prevent and Detect Inattentive Respondents in Web Surveys by Lukas Olbrich, Joseph W. Sakshaug and Eric Lewandowski in Sociological Methods & Research
Supplemental Material
sj-pdf-2-smr-10.1177_00491241251345457 - Supplemental material for Evaluating Methods to Prevent and Detect Inattentive Respondents in Web Surveys
Supplemental material, sj-pdf-2-smr-10.1177_00491241251345457 for Evaluating Methods to Prevent and Detect Inattentive Respondents in Web Surveys by Lukas Olbrich, Joseph W. Sakshaug and Eric Lewandowski in Sociological Methods & Research
Footnotes
Acknowledgments
The authors would like to thank participants of the GOR 2024 conference, internal IAB seminars, three anonymous reviewers, and the editor for their helpful feedback and comments. Lukas Olbrich gratefully acknowledges financial support from the Graduate Programme of the Institute for Employment Research (IAB) and the University of Erlangen-Nuremberg (GradAB). Funding for direct costs of the surveys in Study 1 and Study 2 was provided by Avaaz Foundation.
Declaration of Conflicting Interests
The authors declared no potential conflicts of interest with respect to the research, authorship, and/or publication of this article.
Funding
The authors received no financial support for the research, authorship, and/or publication of this article.
Supplemental Material
Supplemental material for this article is available online.
Notes
Author Biographies
References
Supplementary Material
Please find the following supplemental material available below.
For Open Access articles published under a Creative Commons License, all supplemental material carries the same license as the article it is associated with.
For non-Open Access articles published, all supplemental material carries a non-exclusive license, and permission requests for re-use of supplemental material or any part of supplemental material shall be sent directly to the copyright owner as specified in the copyright notice associated with the article.