
Abstract
Survey research on migrants is notoriously challenging, especially if the goal is to collect data across a range of countries. Social networking sites’ ability to micro-target advertisements to migrant communities combined with their near-global reach makes them an attractive option. Yet there is little rigorous evaluation of the quality of data thus collected—especially for populations from developing countries. We compare samples of Nigerian emigrants in Canada and Italy and Nigerians (at home) in Nigeria recruited through targeted advertising on Facebook and Instagram to population estimates. We find our samples contain varying degrees of bias in the case of age and gender and systematically miss those with little formal education. How much this affects our samples’ representativeness varies across contexts: discrepancies are much smaller for emigrant populations in Canada than in Italy and much larger in Nigeria, where a large share of the population has little formal education and limited literacy. Post-stratifying each sample on age, gender, and education does not ameliorate bias on other variables such as ethnicity, religion, period of migration, or political attitudes. We discuss the potential and limitations of social-media-driven sampling and highlight key considerations for implementing it to collect multi-sited data on migrants.
Introduction: The Challenge of Survey Research on Migrant Populations
Migrants are a hard-to-survey population for at least two reasons: First, they generally comprise too small a proportion of any population to efficiently survey as part of sampling strategies that target the general population—especially if specific national-origin groups or other migrant sub-populations are of interest. Second, targeting migrant communities directly is generally infeasible because migrant-specific sampling frames and contact information are unavailable in most contexts.
To overcome these challenges, researchers have developed a range of approaches, often requiring considerable resources and effort; examples include targeting specific locations such as immigrant neighborhoods (e.g., Baio, Blangiardo and Blangiardo 2011), onomastic sampling (Schnell et al. 2013), contacts through migrant organizations or social service providers (Polzer Ngwato 2013), and respondent-driven sampling (Lee et al. 2021), among others (for an overview, see Reichel and Morales 2017). While these data collection approaches may be feasible if a researcher desires to collect data on immigrants residing in a single country, even in best-case scenarios, these techniques demand significant resources and entail compromises in terms of representativity and coverage. Moreover, these strategies quickly become unviable if researchers aim to study not only immigrants in one country but a broader (e)migrant population or global diaspora and desire to collect comparable samples of this population across a range of countries. A particular sampling strategy may be feasible in some countries but not others, making it hard to scale up and collect data in similar ways across contexts. These implementation challenges are particularly great if a study's goal is to cover less-developed countries where data on migrants collected by traditional means are virtually non-existent, population-based sampling frames generally do not exist, and accessing migrants may prove more logistically challenging and costly than in countries with more developed statistical infrastructure.
These data collection constraints have profoundly shaped research programs in international migration, particularly those that draw on survey data. While international migration is an inherently multi-sited phenomenon involving countries of origin as well as destination(s), most data collected are “immigrant-centric,” and focus on immigrants—or a specific group of immigrants—in a particular destination country. Data that provide information on migrant or migrant-origin populations across a range of countries are few and far between. Where they do exist, they only include a small number of countries and are the result of complex and resource-intensive multi-national projects. Research that includes those who stayed behind or returned within the purview of analysis is even rarer. 1
The resulting data landscape is heavily skewed toward immigrant populations in economically developed countries. In almost all cases, data collection is organized around destination countries as the starting point: a sample of immigrants in a particular country. The resulting research invariably is pushed toward taking the perspective of the receiving society. This “methodological nationalism” (Wimmer and Glick Schiller 2002) limits the theoretical and conceptual advances in migration research but also produces “biased views of migration and leaves some areas with deep knowledge gaps, hence frustrating the relevance of social scientific research” (Beauchemin 2014:925). To move beyond these “immigration-centric” research frames and attenuate the undue focus on immigrants in countries of economically developed countries, collecting data that better reflect the multi-sited nature of international migration (including country-of-origin samples) is essential. Such multi-sited data are vital for a range of research programs, from understanding individuals’ selection into migration and choice of destinations (McKenzie and Rapoport 2010; Orrenius and Zavodny 2005) to the downstream consequences of the choice to migrate—for example, what David FitzGerald (2012) has called “homeland dissimilation,” the processes by which emigrants become increasingly different from their compatriots who stayed home.
The Potential of Targeted Advertising on Social Media Sites for Survey Recruitment
Targeted advertising on social networking sites provides an attractive way to collect multi-sited survey data on migrants that could expand the empirical and theoretical horizon in migration research. Social media companies’ core business model relies on collecting (and constructing) detailed metadata about their users, which they can then monetize by allowing advertisers to target specific populations in their advertising campaigns. These data include basic demographic characteristics such as age, gender, location, and language use, as well as information such as hobbies, political affiliations, and professional background. Based on Facebook metadata, researchers have targeted Facebook advertising to collect surveys of employees at specific firms (Schneider and Harknett 2019), or with specific demographic (Arcia 2014) or political (Jäger 2017) characteristics. Critically for migration researchers, Facebook provides advertisement categories on “expatriates,” which provides a proxy for migrant populations.
For migration researchers, a particular advantage of study recruitment via social media networks such as Facebook 2 is their near-global reach—though in the case of Facebook, this notably excludes China, Russia, and Iran, where Facebook cannot be officially accessed. Facebook alone had almost three billion monthly active users in 2021 (Meta 2022), with users across all age groups. Among migrants, many of whom rely on social media networks to stay in touch with family and friends (Dekker and Engbersen 2014), Facebook adoption is likely even higher than the rate of usership either in their country of origin or residence. Whereas traditional methods of constructing sampling frames and outreach strategies must be adapted to data availability in each country, the global infrastructure of social media companies like Facebook allows survey recruitment to be done the same way across many countries—including migrants’ countries of origin. For example, Pötzschke and Braun (2017) used Facebook to recruit Polish migrants across four countries (Austria, Ireland, Switzerland, and the United Kingdom), collecting a sizeable sample (∼1,000 interviews).
Challenges and Limitations of Social-Media-Driven Data Collection
While social-media-driven survey recruitment clearly has the potential to open new avenues for migration research, one question for researchers is whether the quality of the data collected is good enough to allow for meaningful inferences. Since migrant samples recruited through social networking sites are non-probability samples, the degree to which these samples can represent the population of interest is a key issue.
Early research focusing on the national representativity of surveys conducted using online opt-in samples tended to be critical of the scientific value of these data, pointing to limited and unequal internet access and use (e.g., Yeager et al. 2011), and even more recent work points to limitations of these methods when it comes to accurately estimating population proportions and relationships between variables (Brüggen, van den Brakel and Krosnick 2016; Dutwin and Buskirk 2017). However, there is also a line of more optimistic findings, suggesting that online nonprobability samples collected using a range of methods can closely resemble probability-based samples (which themselves can have their own biases) when weighted appropriately (e.g., Clifford, Jewell and Waggoner 2015; Mullinix et al. 2015; Schneider and Harknett 2022; Wang et al. 2015). A limitation of this work is that it is all based on data from the US and Europe, where digital divides, low literacy levels, and other barriers to accessing social media, are limited. The same applies to the limited work that has evaluated these approaches for surveying migrant populations: studies on Polish migrants to four other European countries (Pötzschke and Braun 2017) or German immigrants (Pötzschke and Weiß 2020). To our knowledge, there are no systematic evaluations of how well these approaches work for studying migrant populations from developing countries.
Studies that implement social-media-driven methods for sampling in developing countries are relatively sparse and paint a more mixed picture of the utility of social-media-driven samples. For example, Boas, Christenson and Glick (2020) found that online recruited samples in India were significantly less representative than in the US, particularly with respect to income and geography. Moreover, they cannot replicate experimental results in India about issues like the social preference among Indians for male children, which they surmise is because the biases for male children primarily exist in lower educational and rural groups absent in their convenience sample (246). Similarly, Rosenzweig et al. (2020) show that samples collected using Facebook advertising in Mexico and Kenya tend to be more male, urban, and highly educated than the national average — differences that cannot be fully overcome with oversampling and weighting.
Before judging social-media-driven recruitment with undue severity, it is worth noting that even the most high-quality face-to-face surveys do not meet the marginal or joint distributions of census data, which, in turn, cannot credibly claim perfect representation of populations in many countries—especially migrant populations. This could relate both to potential issues with face-to-face surveys, but also with the quality of census data itself (Jerven 2013; Mba 2004). Nevertheless, regardless of whether we consider census data or representative face-to-face probability-based samples as the gold standard for data collection, samples recruited via social media platforms potentially face three challenges. We summarize these below using Facebook as our case, but they apply in similar ways to other social media platforms.
Coverage Bias—sub-populations systematically absent from online platforms: In the case of migrant samples, that would mean that those migrants who are present on online platforms are not fully representative of the migrant population. Even the (still) largest social media site (Facebook) does not include everyone. Indeed, just like internet use more generally, social media use is patterned along gender, education, and other socio-demographic lines (Robinson et al. 2015), with women in particular being underrepresented among populations in sub-Saharan Africa (Kashyap et al. 2020). While internet access through mobile devices has expanded significantly in recent years, access to broadband data may be limited or expensive. More importantly, regular use of social networking sites depends on at least a minimum of (digital) literacy. Few individuals with little or no formal education will have the skills to use online platforms comfortably. Existing research that evaluates the representativeness of migrant samples predominantly examines migrants from countries with very high average levels of education where literacy and media literacy are high enough in these populations not to be a substantial obstacle to social network site access among migrants from the developed world—like German emigrants (Pötzschke and Weiß 2020) or Turkish and Polish immigrants in European countries (Pötzschke and Braun 2017; Ünlü Ince et al. 2014). Digital literacy is likely different for migrants from regions of the global south with high levels of illiteracy, especially for efforts to survey populations that stay behind in their places of origin. Misclassification Bias—populations that are mis-categorized or not targeted: Micro-targeting of specific populations for delivering advertising is the core business feature of all social networking platforms. Yet, the data and algorithms that enable this targeting are generally proprietary and subject to change, making it hard for researchers to assess their accuracy and biases (Schneider and Harknett 2022). To take the concrete case of Facebook, which provides an advertising category “expatriates,” it could be that some migrants who have Facebook accounts are not classified as such by Facebook (and thus not targeted with ads), and this group is systematically different than the population Facebook classifies as migrant. Although Grow et al. (2022) report that, regarding age, sex, and region of residence, Facebook's targeting data are reasonably accurate. However, their data are drawn from a survey in European countries, and their conclusions might not apply to populations from developing countries like Nigeria. Selection Bias. Even if those migrants that can be targeted via online advertising were representative of the population, there could be self-selection of those who participate in the survey. Like in other types of studies, this could be for respondent-based reasons such as motivation, interest, and time. Since social-media-driven sampling generally relies on online surveys, these issues are likely to be especially severe. The same biases about literacy and digital literacy discussed above with respect to Facebook access are likely to weigh even more heavily when it comes to selection into this survey mode. Additionally, the algorithms that social media platforms like Facebook employ to maximize advertising efficiency may exacerbate these biases by targeting sub-populations that respond to advertisements more often than those who do not.
We set out to examine the extent to which these issues matter when collecting data on migrants as well as comparing populations of non-migrants in migrants’ countries of origin. As part of a larger study on the Nigerian diaspora—the study of Nigerians at Home and Abroad (NAHAA)—we used targeted advertising on Facebook to recruit Nigerians living in Nigeria (“at home”) and Nigerian emigrants to take a short online survey. We compare several of our samples on key demographic characteristics to the best available data for these populations (see Figure 1). In addition to Nigerians living in Nigeria, we focus on two Nigerian emigrant populations with different characteristics: those now living in Canada and those in Italy. The population in Italy presents a case of a young and recently arrived migrant population with relatively little formal education and one where a large share has a precarious legal status in the country of destination. In contrast, the Nigerian population in Canada is a case of a highly selected migrant population, with, on average, high levels of education and generally secure legal status. While the larger project from which the data in this paper is drawn includes samples of Nigerians in a range of countries that would have been interesting to examine, including Ghana, Cote d’Ivoire, Malaysia, the UAE, and South Africa, we could not find any reliable reference data for these cases.
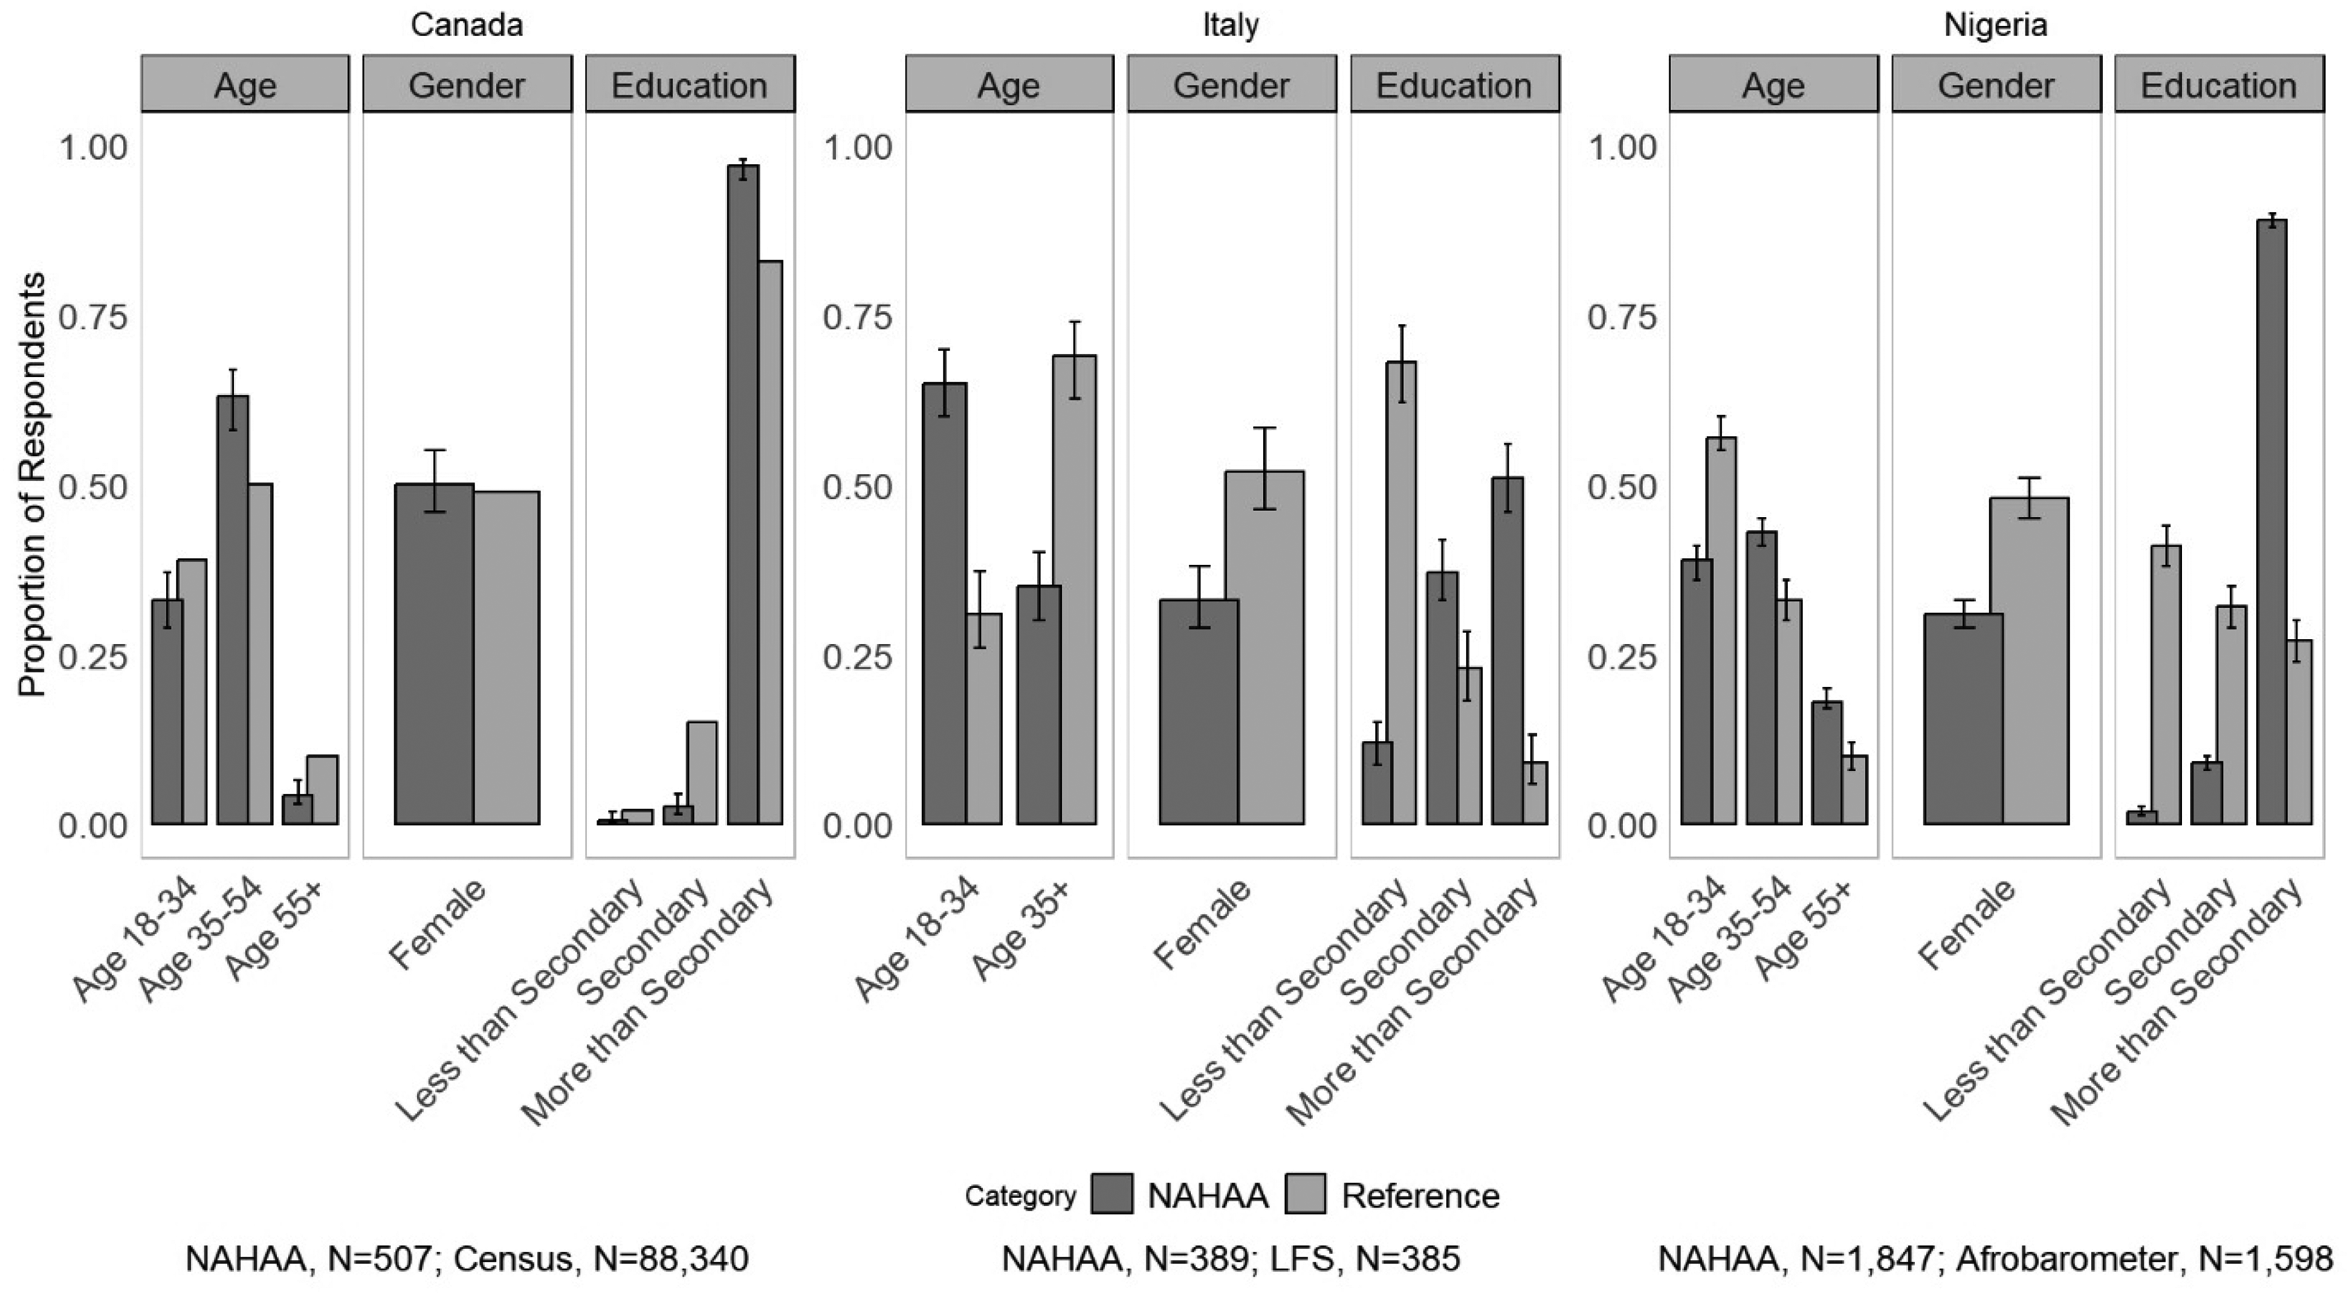
Distribution of age, gender, and education; NAHAA data compared to reference data in Canada (2021 Census), Italy (Labor Force Survey), and Nigeria (Afrobarometer round 8).
Background: Nigerians in Nigeria and Nigerian Emigrants in Canada and Italy
Before presenting our data, we provide some context for our samples. With a population of over 220 million. Nigeria is Africa's most populous country. It is also a multi-ethnic state with over 200 ethnic groups speaking several hundred languages, with English functioning as the de facto national language. In terms of religion, Nigeria is roughly evenly split between Muslims and Christians, with a small minority of other religions. It is a federal republic with 36 states (plus a federal capital territory) and large regional inequalities: the overwhelmingly Muslim north of the country is poorer and, on average, less educated than the majority Christian south of the country (Madu 2006). While parts of Nigeria's population are highly educated, a large share lacks formal education: According to the 2018 World Bank Development Indicators, 38% of Nigeria's population is illiterate, with a significant gender imbalance of 29% of men versus 47% of women (World Bank 2023).
Nigeria has experienced significant out-migration over the past several decades, which has incubated a large diaspora spanning the globe. According to the Migration Policy Institute, there are large emigrant populations with estimated populations of more than 100,000 in five countries—including Italy—and populations over 30,000 in seven additional countries, including Canada (Migration Policy Institute 2020).
Nigerian in Canada: Nigerians in Canada are not well-researched. According to the 2021 Canadian census, 88,340 Nigerians live in Canada, and they began migrating to Canada in large numbers in the early 1990s. Many Nigerians migrate with landed immigrant (or permanent resident) status. Increasingly, Nigerian students have also chosen Canada to attend university because it affords pathways to immigration for Canadian university graduates (Adeyanju and Olatunji 2022). Currently, however, the majority of Nigerian-born migrants in Canada are in their prime working years between the ages of 35 and 54, and, like migrants to Canada in general, Nigerians in Canada are highly educated.
Nigerians in Italy: The Nigerian population in Italy is even less studied than Canada's (see Table 1). According to Italy National Institute of Statistics, there are 119,089 Nigerian-born foreigners in Italy in 2021. Nigerians are one of the largest groups crossing into Italy through the Mediterranean Sea, many as asylum seekers (Obi et al. 2022). The risky and arduous journey selects for a young migrant population: Accordingly, a third of Italy's Nigerian population is between 18 and 34 (see Table 1). Compared to the Nigerian population in Canada, Nigerians in Italy have significantly less formal education, with only 9% having post-secondary education. A significant share of Nigerian women in Italy work in the sex industry. Although concrete numbers are hard to come by, studies by the International Organization for Migration from the 1990s and early 2000s put the number somewhere between 10,000 and 25,000 (Carling 2006; Migration Information Programme 1998). Given the rapid increase in the Nigerian population in Italy in the last two decades, the number has likely grown.
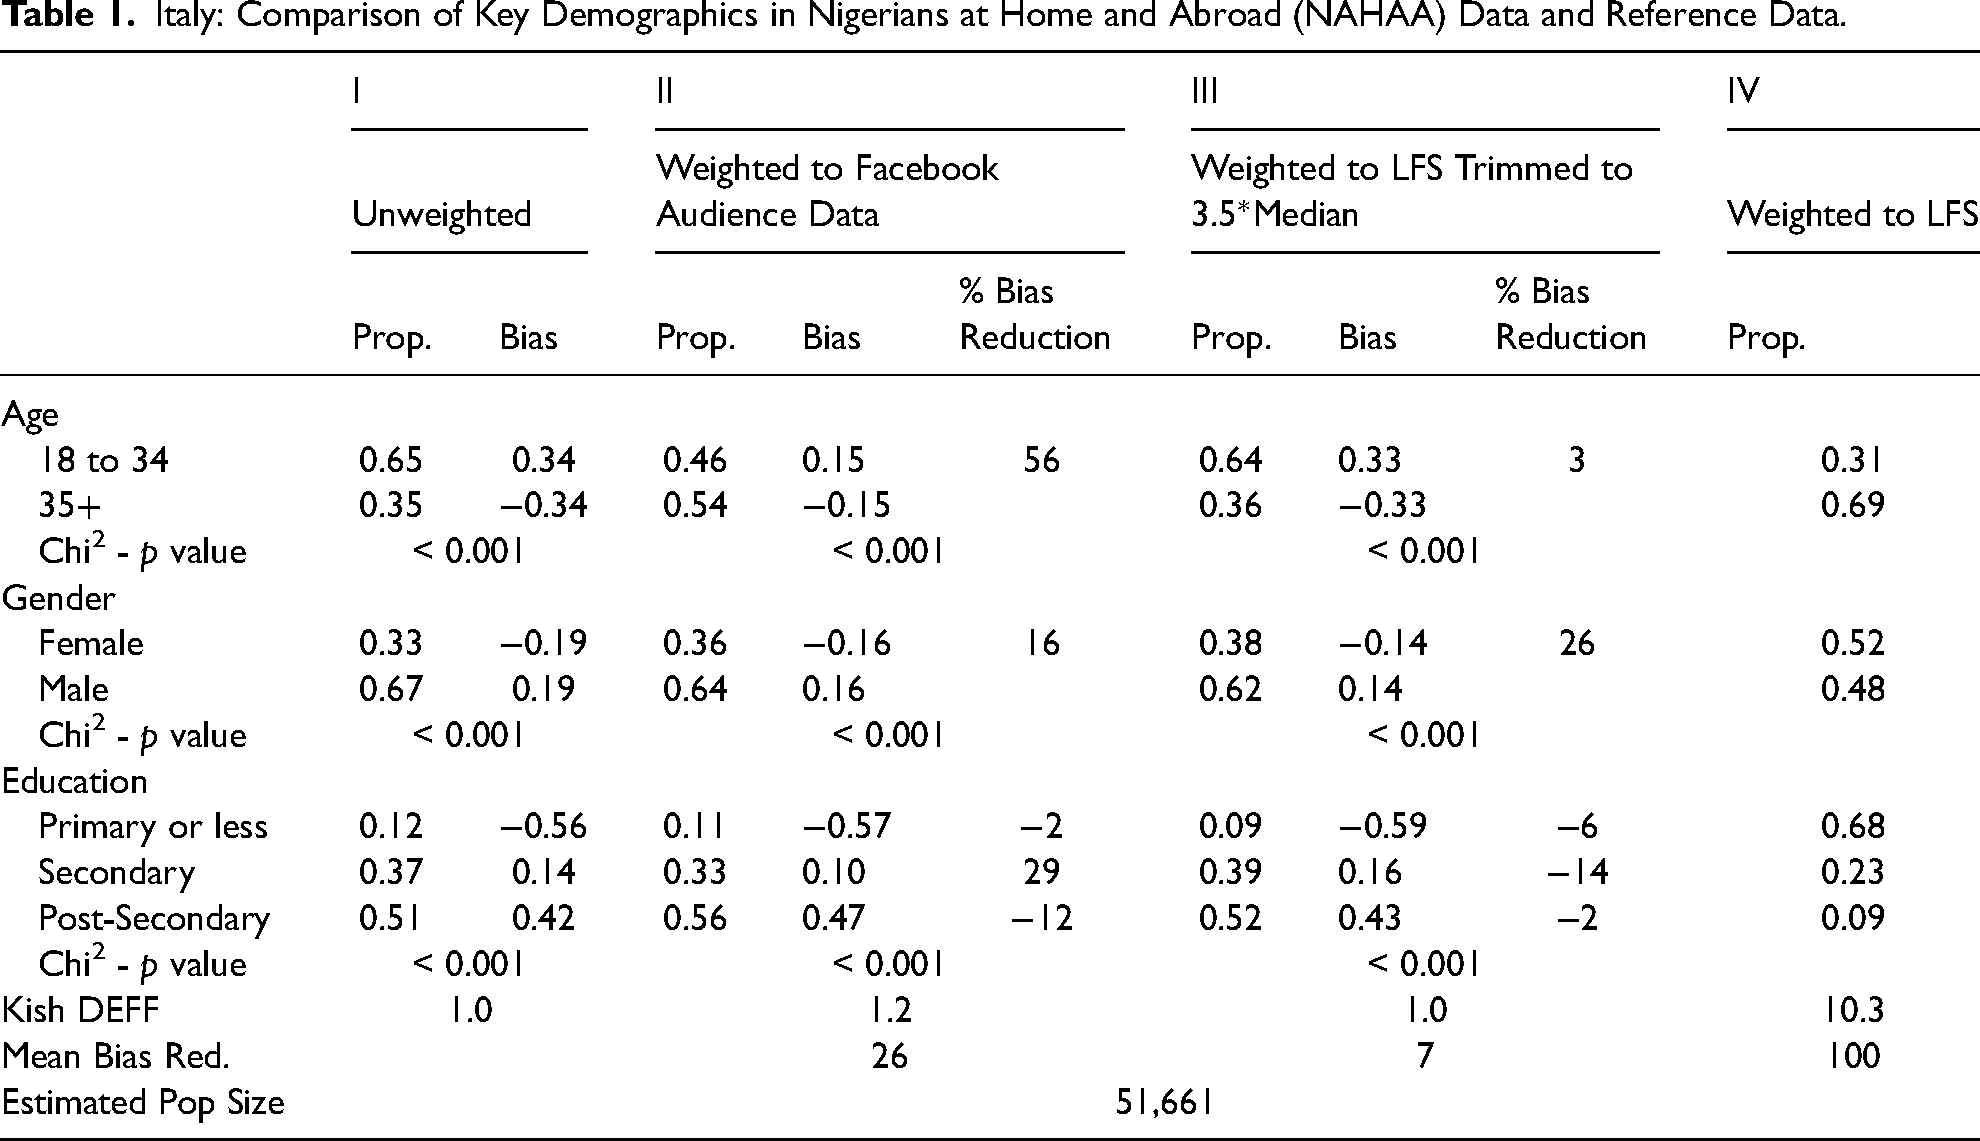
Italy: Comparison of Key Demographics in Nigerians at Home and Abroad (NAHAA) Data and Reference Data.
Recruiting Nigerian Survey Respondents Abroad and at Home
Using Facebook's advertising manager, we launched a survey recruitment campaign for Nigerians living abroad (including 11 ad sets covering Nigerian emigrants in Cameroon, Canada, Cote d’Ivoire, Germany, Ghana, Italy, Malaysia, South Africa, UAE, UK, and the US) and one campaign for Nigerians living in Nigeria. We used the option to place ads on both Facebook pages and Instagram. In designing the advertisements, based on extensive pretesting, we selected four different images to appeal to a broad cross-section of Nigeria's diverse society (shown in Appendix Figure A1). Before launching the main recruitment campaign for Nigerians abroad, we conducted a week-long pilot in Italy and South Africa. The pilot campaign ran from March 14 to 22, 2022, and the main campaign ran from May 2, 2022, to June 13, 2022. Detailed information on all aspects of these campaigns is summarized in Appendix A.
For the data collection of Nigerians living abroad, we targeted Nigerian expatriates using a detailed targeting option for “expats” on Facebook. 3 Individuals who were shown the advertisements could then choose to participate in the survey by clicking a link leading them to an online survey hosted on Qualtrics. Since incentives increase participation and, in some cases, especially do so among those with lower educational attainment (Fick and Diehl 2013), we offered respondents the opportunity to take part in a lottery for gift cards or mobile phone credit for their participation in the survey. Since many migrants access the internet, and especially Facebook, through a mobile device, we optimized the appearance of our survey for mobile phones. Among other variables, the survey collected basic demographic items, such as age, gender, marital status, religion, and ethnicity, which we then used to compare our samples to other data on these populations. 4 We planned to run each emigrant campaign for at least seven days at a budget of 100 USD per day but longer if necessary until we reached a quota of 500 respondents—subject to an overall budget constraint for the whole project.
Once we restrict our observations to surveys with the demographic section completed (equal to 50% of the survey completed), we have 507 responses to our Nigerians in Canada survey and 389 responses to our Nigerians in Italy survey (combining pilot and main campaign). This translates into a cost of 4.42 USD per completed Canadian survey and 9.00 USD per completed survey in Italy. We suspect that the relatively low levels of educational attainment of the Nigerian population in Italy (certainly compared to Nigerians in Canada), coupled with the large share of Nigerians in Italy who are asylum seekers and may lack secure legal status and the significant share of the female population that works in the sex industry, make this a hard population to recruit, leading to a higher cost.
Following other attempts to collect nationally representative sample populations on Facebook (Zhang et al. 2018), we relied on quota sampling using Facebook advertisements for the data collection of Nigerians living in Nigeria. Before launching our campaign, we created the strata for quota sampling and assigned quotas to each stratum. We focused on three demographic characteristics: region, rural–urban divide, 5 and gender. We generated 24 strata by crossing six Nigerian regions (North-Central, North-East, North-West, South-East, South-South, and South-West), two settlement types (rural and urban), and gender (male and female). Starting from a target sample size of 2,500, the quota (aiming for at least 50% of each survey completed) for each stratum is based on the population of each stratum in the Nigeria Census. Because the most recent Nigeria census was in 2006, we used the projected 2016 Nigeria census data, including the population size by state, rural/urban, and gender.
We set a daily budget of 100 USD for our Nigerian campaign, which ran from May 2, 2022, to June 13, 2022, the same dates as for the main recruitment campaign for Nigerians abroad. We kept each ad set running until its associated quota was filled or until the last date of the study. While we filled most strata, we could not fill eight strata, which were mostly strata of female Nigerians in rural areas. In total, 1,847 participants participated in our Nigerians in Nigeria survey, with the demographic section completed (equal to 50% of the survey completed) at a cost of 1.26 USD per completed response.
Results
We evaluate our Facebook-recruited data to population estimates in two steps. First, we compare the distributions of three key demographic variables (age, gender, education) in each of our study's three countries to each country's reference data. We then calculate different post-stratification weights that try to match our samples to reference data and, to the degree possible, evaluate the extent to which these weights can address bias on other variables available in both our survey and the reference data. We also conduct chi-squared tests to explore if there are statistically significant differences in the distributions of variables between Facebook-recruited data and the reference data with and without various post-stratification weights. 6
Reference Data
Canada: For Nigerians in Canada, we compare our data to the 2021 Canadian census. We use a custom-ordered tabulation of the Nigerian-born population from the 25% sample (also known as the “long form”). In addition to key demographics (age, gender, education), the Canadian census has information on the time of immigration to Canada, which we can compare to our sample.
Italy: For Nigerians in Italy, we compare our data with a pooled sample of the 2016 to 2020 Italian Labour Force Survey (LFS). Conducted by the Italian National Institute of Statistics, the LFS survey randomly draws households from population registers of Italian Municipalities and includes all the members in these households. We obtained the LFS microdata from IPUMS-International and used the person weights provided. While the overall sample is large, covering about 75,000 households or 150,000 individuals each quarter, the sample of Nigerians is limited, ranging between 59 and 95 per wave. Therefore, the pooled sample across the five waves gives us a total of 385 observations. While this is the best data on Nigerians in Italy we could access and a close examination of the data did not reveal any red flags, the population estimates themselves hinge on the accuracy of the LFS weighting scheme.
Nigeria: For Nigerians in Nigeria, we compare our data with Afrobarometer's Nigeria survey. We use Nigeria Round 8 (2021) data. While we used detailed regional information from the Nigerian census to set sampling quotas, the projected Nigeria census data does not contain information on educational attainment, which makes it unsuitable for creating weights or checking representativeness on this critical dimension. Moreover, the Afrobarometer data allows us to compare the representativeness of our sample in terms of ethnicity, religious affiliation, and attitudinal measures.
Comparisons to Reference Data: Age, Gender, Education
Figure 1 shows comparisons of our sample to reference data on age, gender, and educational attainment. To avoid small cell-size issues and inconsistencies in classification, we group educational attainment into three categories: “less than secondary education,” “secondary education,” and “post-secondary education.” Because the share of those 65–74 and 75+ is very small in the reference data and in our samples in Canada and Nigeria, we combine those 55 + into one category. Since the Nigerian population in Italy is very young, and even the 55 + population is small, we work with only two age categories: those 18 to 34 and those 35 and over. In each panel, along with the estimates, we include the confidence interval of the estimates and add a footnote on sample sizes (unweighted) for our NAHAA data and the reference data.
Age: As seen in Figure 1, the age distribution in our data on Nigerians in Canada and Nigeria broadly resembles the distributions found in the reference data. In Italy, however, there is a severe overrepresentation of younger populations (ages 18 to 34) in our sample.
Gender: Figure 1 shows that our data overrepresents men for both Nigerians in Italy and Nigeria, while the differences for Nigerians in Canada are minimal. The differences for Nigerians in Italy are the largest, with a 19 percentage-point discrepancy between the reference data and our sample. A possible reason is the large proportion of sex workers in the female emigrant population in Italy who might be especially hard to reach.
Education: Education is the demographic dimension with the most significant gap between our Facebook data and our reference data. Across all three countries, we underrepresented those with lower levels of formal education. Even in Italy, where we were able to collect a decent number of respondents in our lowest education category, our survey massively underrepresents this population. In Canada and Nigeria, cell sizes are too small (0.6%, N = 3 and 1.8%, N = 33 respectively) to provide reliable information for these sub-populations. The paucity of respondents with low levels of education is most serious for Nigerians in Nigeria, where those with less than a secondary education represent almost two-fifths (41%) of the population compared to the 1.8% captured in our Nigerian sample. It is worth pointing out that the overwhelming share of those with less than secondary education is likely illiterate—as mentioned above, about 38% of Nigeria's population is illiterate—and thus would be hard to reach using the “standard” approach of Facebook advertising and online surveys and would require a much more specific research design to access via online advertising.
In Canada, given its selective migration policy, those with little formal education comprise a relatively small part of the population (about 2%); thus, our estimate from Facebook does not significantly diverge from the population benchmark. The relatively good representation of those with low levels of education in Italy, however, is a striking contrast to the Nigerian case. A likely explanation is that in Italy, only 6% have no formal education, according to the Labour Force Survey. Thus, rates of illiteracy are likely much lower than in the case of Nigeria. Relative to their share in the reference data in Italy, we also overrepresent those with a secondary or above education.
Post-Stratification Weights
In many cases, reference data for migrant populations will not be available—especially outside economically developed countries with good statistical infrastructure. However, in cases where reference data do exist, researchers can calculate post-stratification weights to better match samples collected using online advertising to the population on key demographic variables. To explore the feasibility of such an approach and the tradeoffs it involves, we evaluate several approaches for generating weights.
As a first preliminary step, we calculate inverse probability weights to weigh the data to the audience estimates that Facebook provides to its advertisers. A line of recent work has used these estimates as a “digital census” of sorts to derive estimates of migrant populations (e.g., Zagheni, Weber and Gummadi 2017). Facebook's audience estimates can provide statistics on age and gender, but crucially not on educational attainment. Therefore, we can weight our data only on those two dimensions. Facebook provides audience estimates as ranges, so we use the midpoint as the estimated Facebook margin. In addition, Facebook Audience estimates should not be considered a reference population since they may already suffer from coverage and classification biases (points 1 and 2 discussed above). Thus, these weights can only be considered a preliminary step.
We then shift to the external reference data and use raking to calculate weights based on the marginal distributions of age groups, gender, and educational attainment, as these characteristics should be available in most reference data such as census tables. We calculate two sets of weights: one where we do not constrain weights and one where we reduce the variability of weights by trimming the weights to 3.5 times the median and redistributing the weight lost to trimming to responses that are below the upper bound (see Valliant, Dever and Kreuter 2018, 411).
Tables 1 through 3 provide key summaries of this exercise for Italy, Canada, and Nigeria, respectively. The first set of columns (I) presents the unweighted distribution of the variables we consider in the weighting as well as the bias relative to the reference data. The following columns (II through IV) present the three different weighting approaches: weighting to Facebook Audience data (II), weighting to reference data but trimming weights at 3.5 the median (III), and un-trimmed weights (IV). For each set of weights, we provide the design effect (Kish DEFF) and also calculate the relative reduction in bias. For the last column—the data weighted to the reference data the bias is zero, and hence we omit this column.
Next, we evaluate the effectiveness of weights by examining variables that were not part of the weighting process. The dimensions on which we can compare depend on the data sources. We are most restricted in the Italian case, where our reference data, the Labour Force Survey, does not contain variables other than those used for the weighting that can be meaningfully compared to items in our survey. The situation is better in the Canadian case, where the 2021 census allows us to compare the distribution of arrival cohorts. 7 Finally, in the case of Nigerians in Nigeria, in addition to population estimates by ethnicity, we can compare estimates by religious denomination. Our survey also includes several items taken from the Afrobarometer survey on respondents’ political attitudes. To minimize the risk that any differences we find reflect changes over time rather than sampling bias we take two items that show high stability over several rounds of the Afrobarometer: Respondents’ evaluation of free speech rights in Nigeria and their satisfaction with democracy in Nigeria.
Italy—Age, Gender, Education (Table 1): The unweighted data differs substantially from the Labour Force Survey on all three variables—all chi-square tests are statistically significant. While weighting to the Facebook Audience estimates (Columns II) reduces bias with regard to the age distribution by about half, it leaves bias in gender composition and educational distribution largely unchanged. The underrepresentation of women is reduced by only 16 percent. Moreover, while these weights reduce the bias in some education strata, they increase the overrepresentation of those with post-secondary education. Weighting toward the reference data with weights trimmed to 3.5 the median (Column III) mainly reduces the bias in gender (26%). But even with these weights, significant biases remain: for example, we underestimate the share of those with a primary education or less by 59 percentage points. Although unrestricted weights (Column IV) recover the distributions of the reference data, they do so at the cost of very large design effects, as indicated by a Kish DEFF larger than 10.
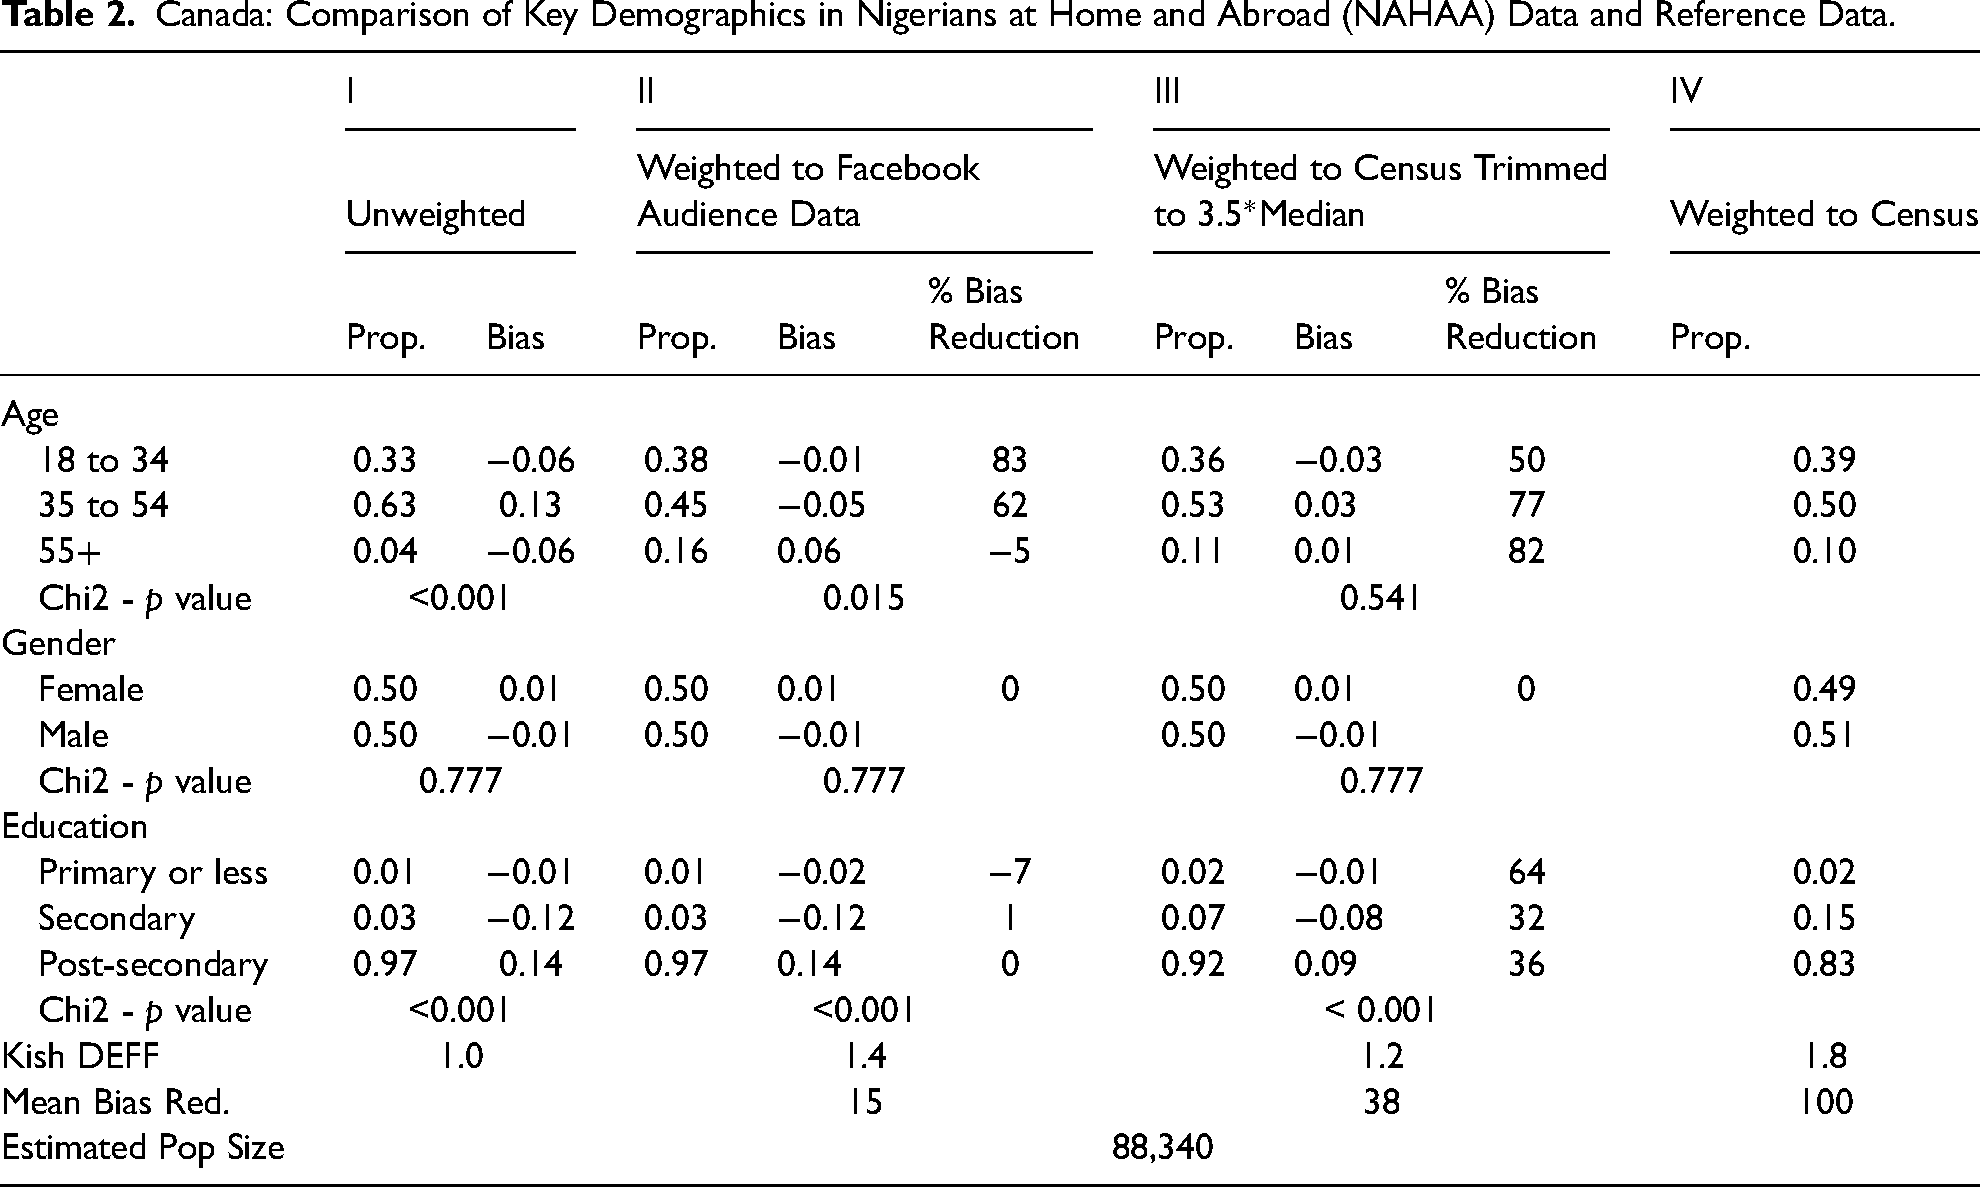
Canada—Age, Gender, Education (Table 2): Certainly, compared to the sample in Italy, our sample's biases are much smaller in Canada. The unweighted data is substantively representative in terms of gender as supported by the chi-squared test, and the bias with respect to age and level of education is much smaller than in the case of Italy. Weighting to the Facebook Audience data (Columns II) significantly reduces bias in the age distribution but leaves the bias in education unchanged. Trimmed weights (Columns III) reduce the bias in the education distribution by about half, leaving a small nine percentage-point overrepresentation of those with post-secondary education and a corresponding underrepresentation of those with secondary education. Even with unrestricted weights that fully match the marginal distributions of the Census data, the design effect is modest (Kish DEFF = 1.8).
Canada: Comparison of Key Demographics in Nigerians at Home and Abroad (NAHAA) Data and Reference Data.
Canada—Period of Migration (Figure 2): The Canadian census provides us with the period of migration variable that was not part of the weighting process for comparison. Figure 2 presents a summary, and Table B1 in the Appendix provides summary statistics. As the bottom panel shows, our data underestimates populations that have arrived before 2010, particularly those arriving before 2000 and overrepresents the more recently arrived (after 2015). In all cases, the application of weights does not substantially correct for the bias in our sample. While the disproportionate representation of these populations on Facebook (coverage bias) or differential response rates (selection bias) might generate the discrepancies found in our sample, another possibility is that those who immigrated longer ago are less likely to be classified as “expats” by Facebook and thus, less likely to be shown the recruitment ads (misclassification bias).
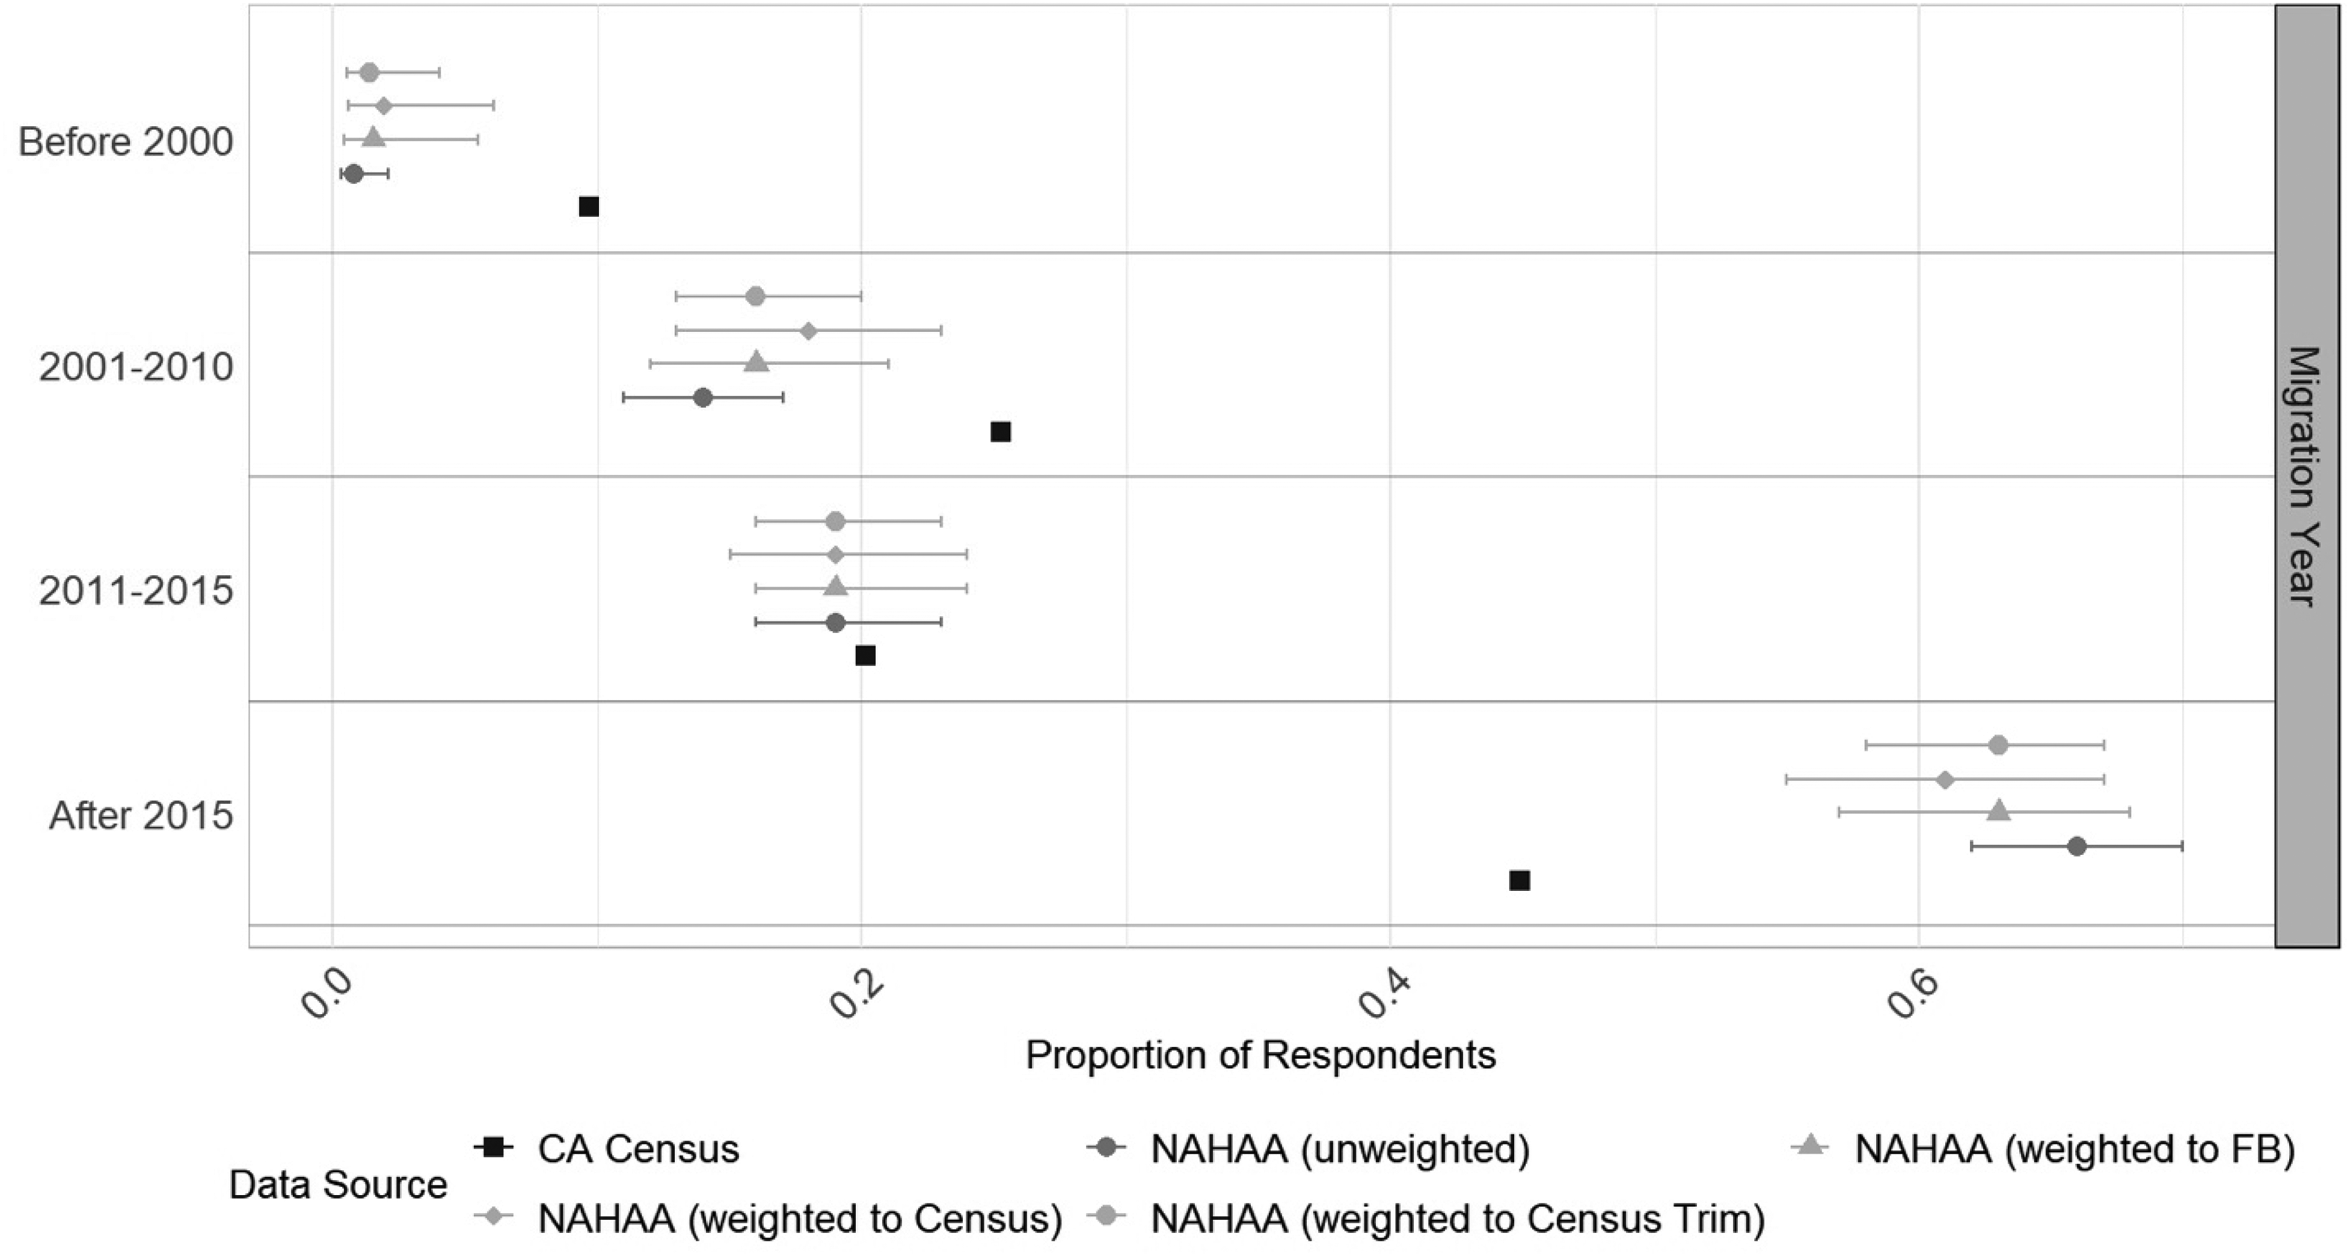
Period of immigration to Canada. NAHAA data with different weights applied compared to the 2021 Census.
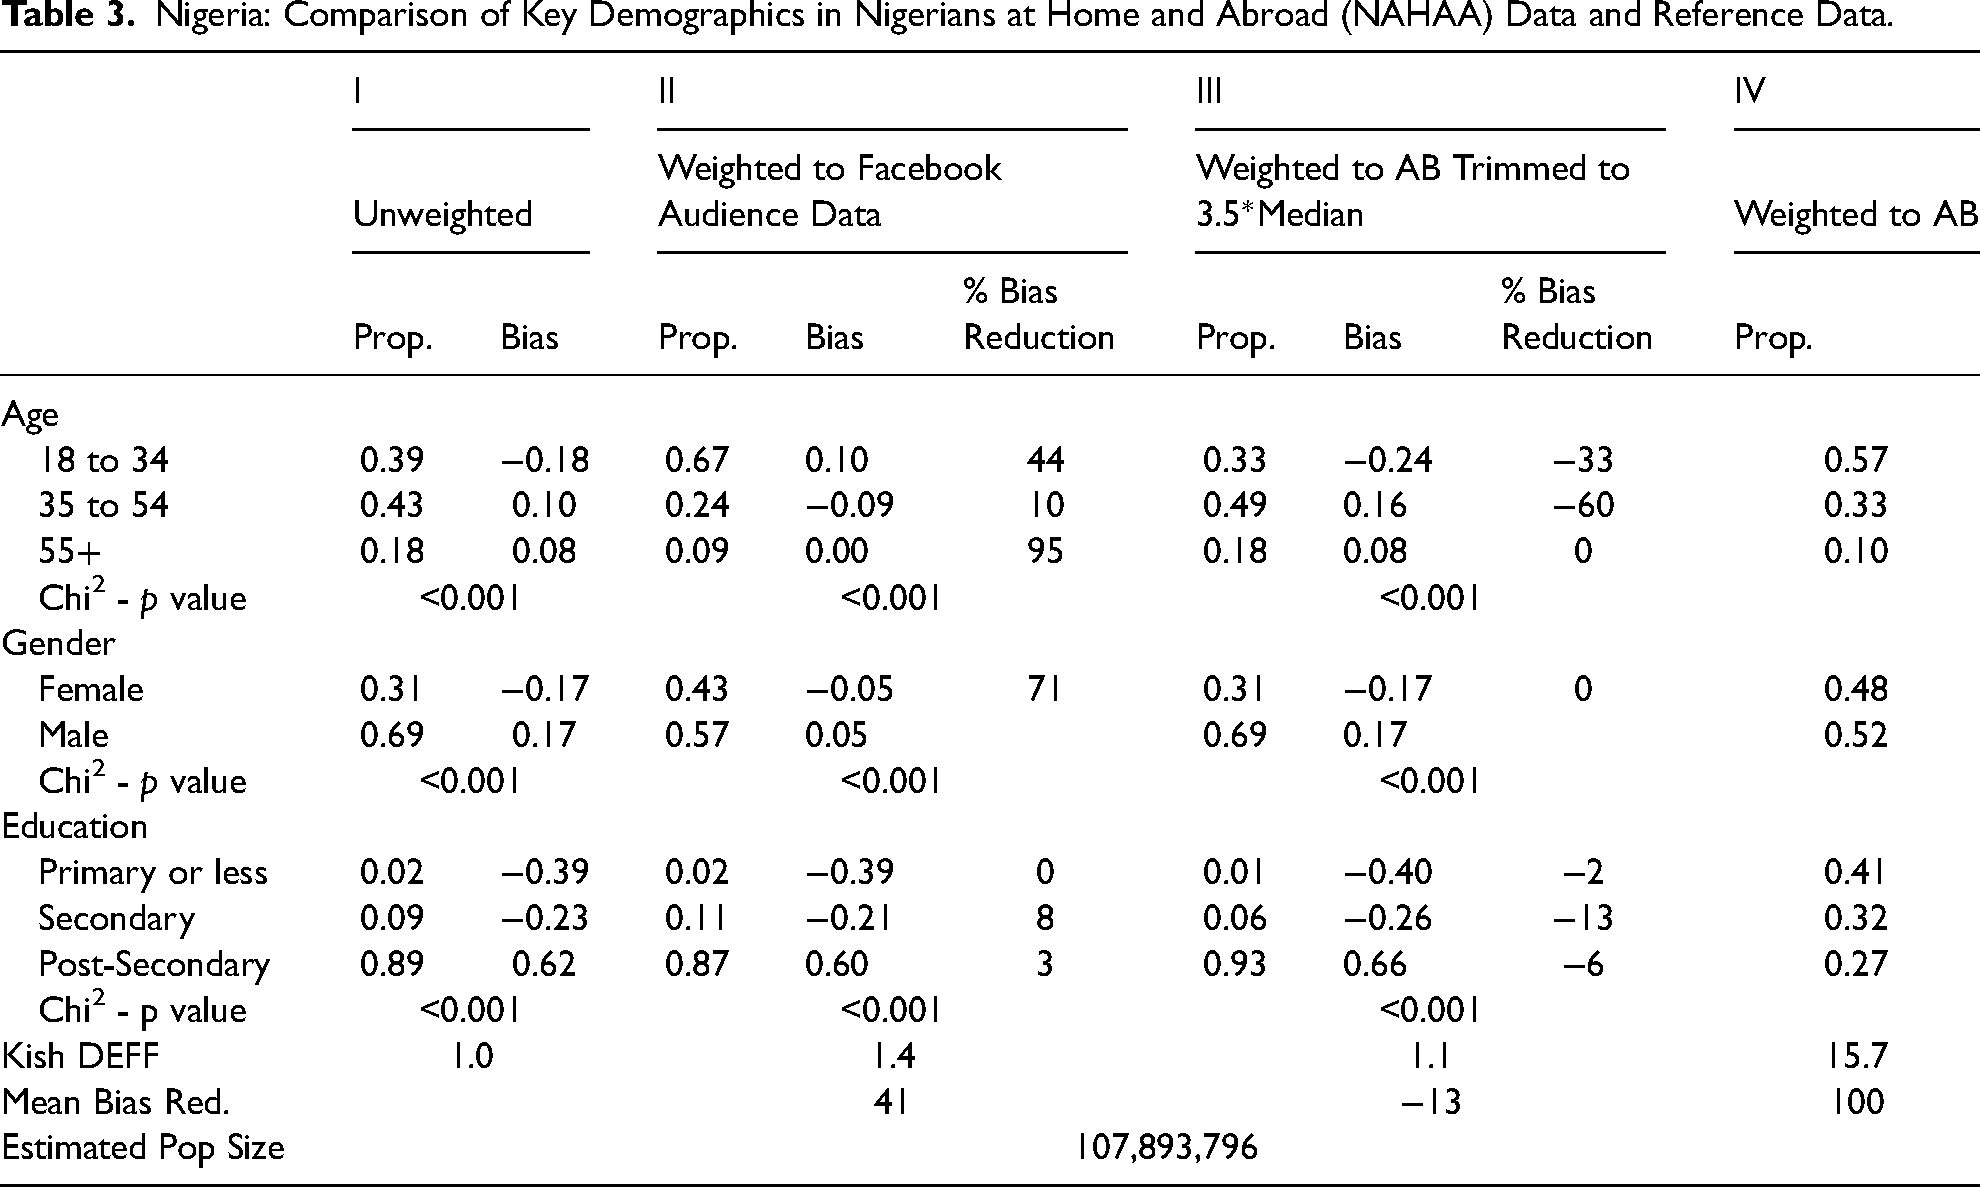
Nigeria—Age, Gender, Education (Table 3): The unweighted data from Nigeria differs substantially from the reference data (Afrobarometer) on all three variables, and the education dimension is especially biased. We severely underrepresent those with low levels of education. As expected, chi-squared tests also suggest that the differences in distribution for each of the three variables are statistically significant. The application of weights based on the Facebook Audience data substantially reduces the bias in terms of age and gender but does not substantially ameliorate the discrepancy to the reference data on the education variable. While the fully weighted data matches the reference data, these weights create very large design effects, as indicated by the Kish DEFF measure of almost 16.
Nigeria: Comparison of Key Demographics in Nigerians at Home and Abroad (NAHAA) Data and Reference Data.
Nigeria—Ethnicity and Religion (Figure 3): The unweighted NAHAA data from Nigeria massively underrepresents Muslims and overrepresents Christians (bottom panel of Figure 3). For example, the Afrobarometer, similar to the Nigerian census, estimates just under 50% of the Nigerian population is Muslim, compared to only 16% of our respondents. Reflecting this bias, our data also overrepresents predominantly Christian ethnic groups like the Igbo and underrepresents predominantly Muslim groups like the Hausa. Notably, the different post-stratification weights do not ameliorate these biases, and, in fact, using the set of unrestricted weights may even exacerbate bias in a few cases.
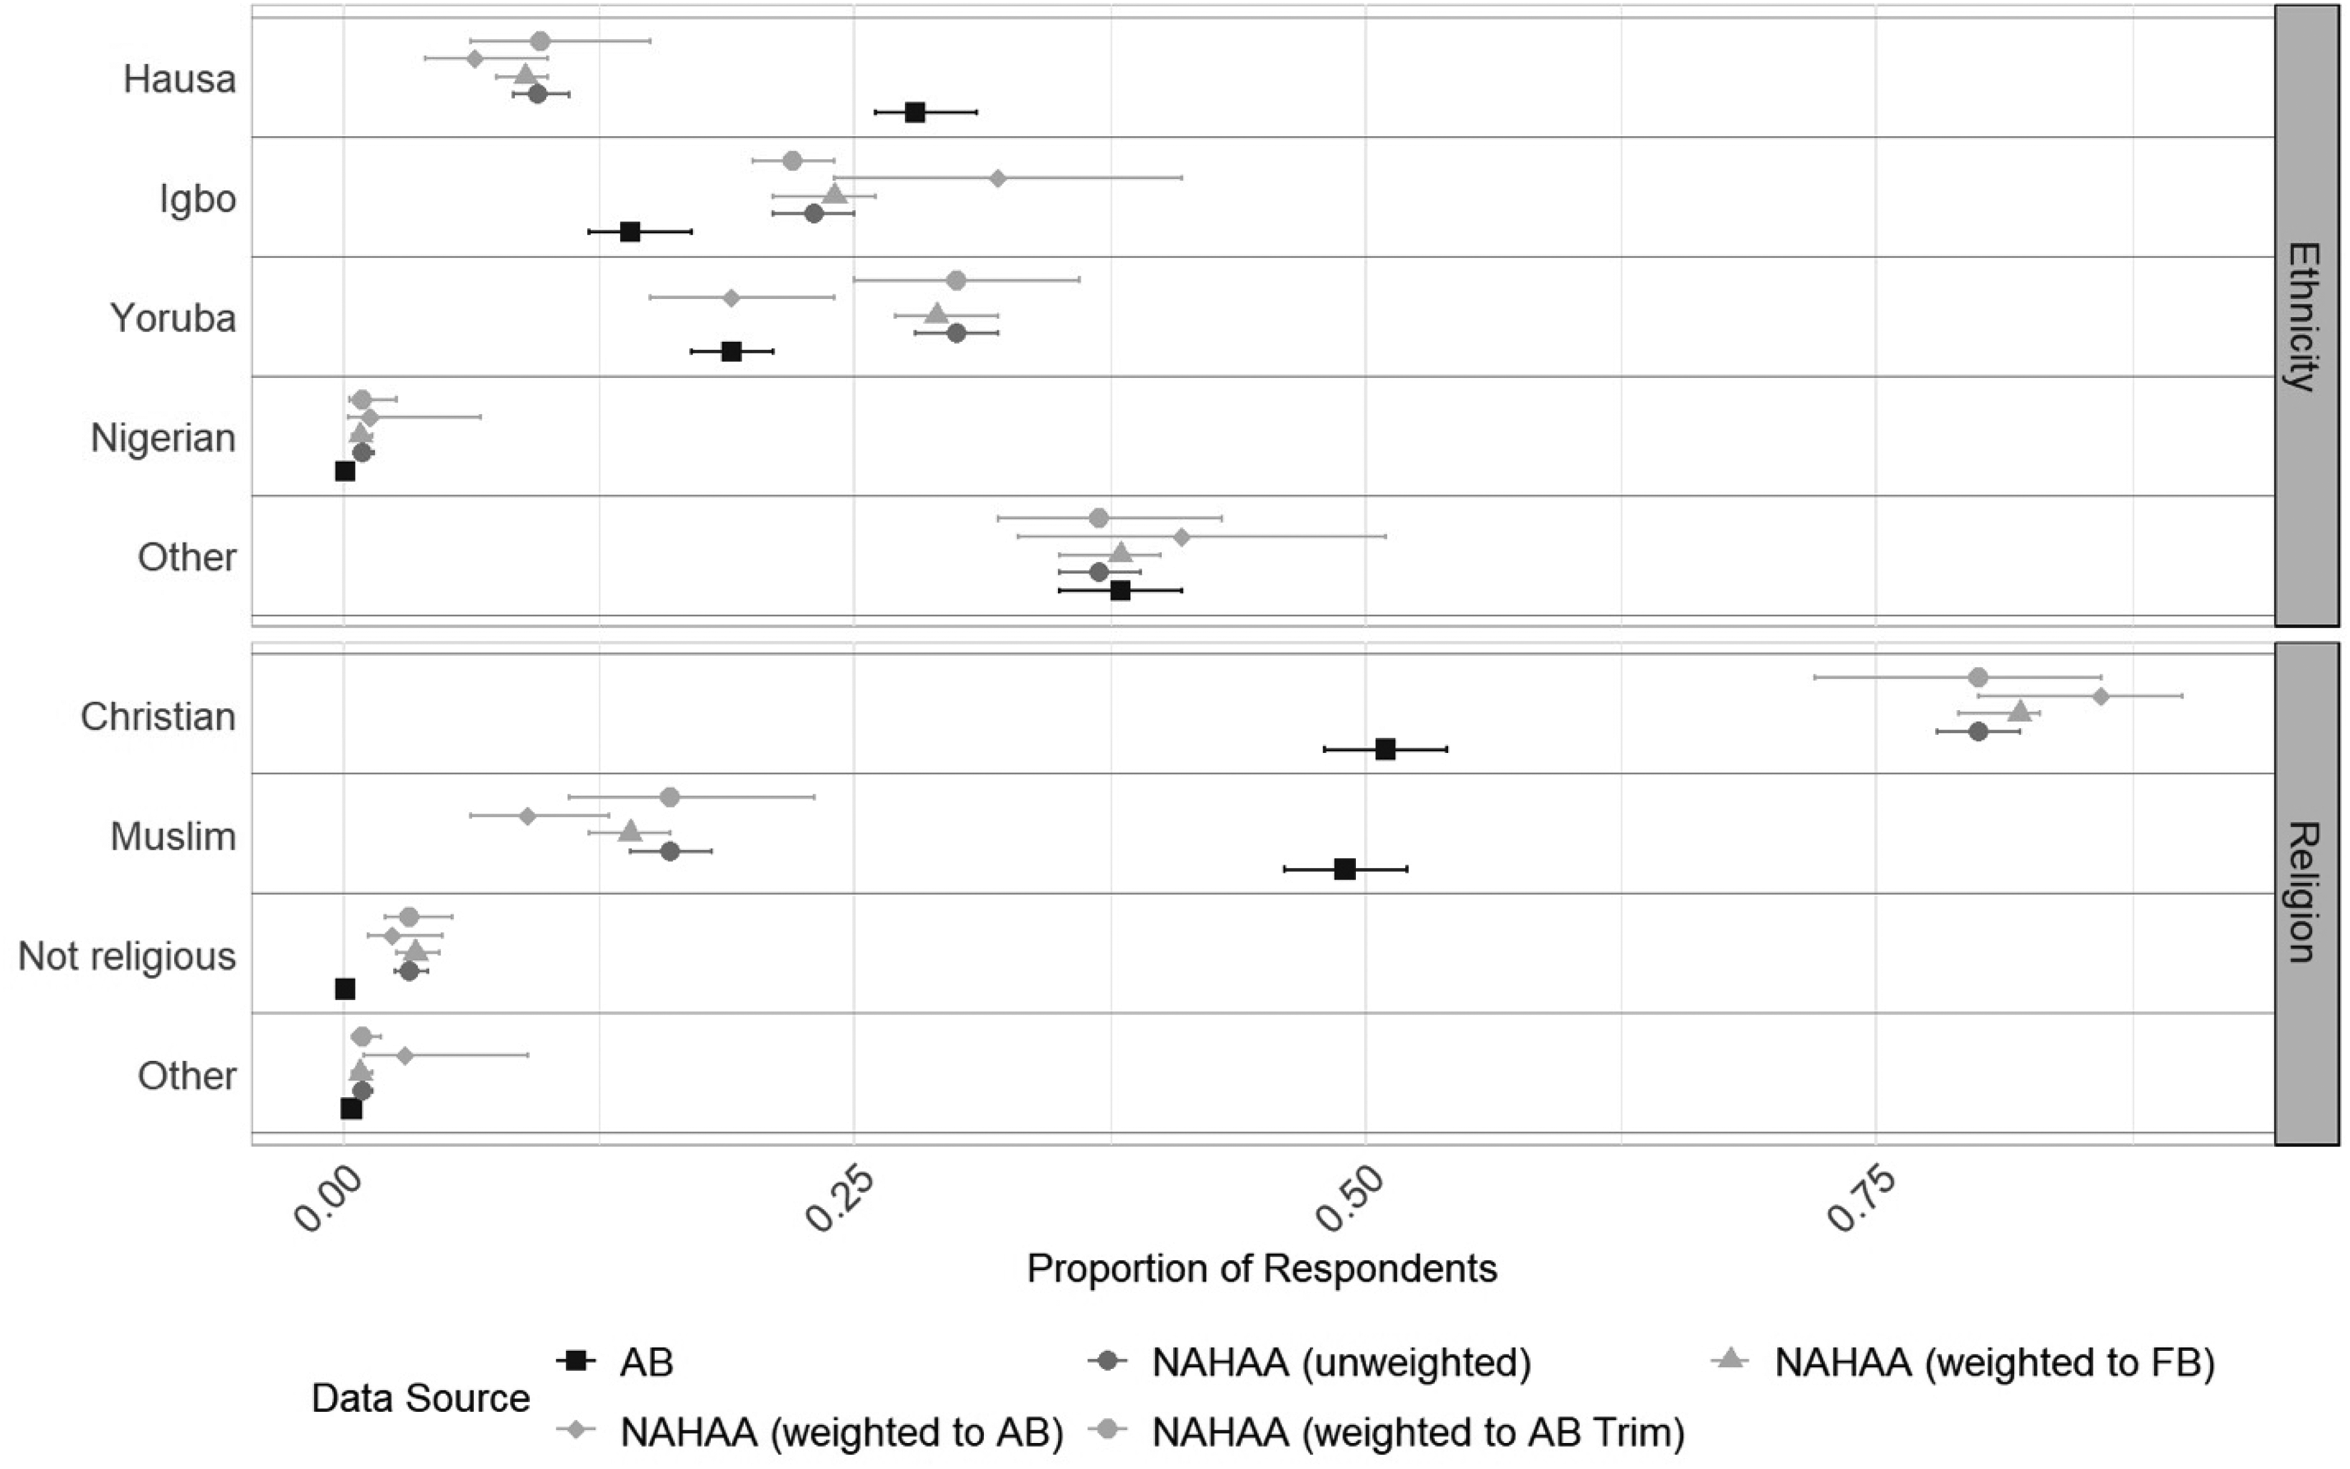
Distribution of ethnicity and religion in Nigeria. NAHAA data with different weights applied compared to Afrobarometer.
Nigeria—Assessment of Freedom of Speech and Satisfaction with Democracy (Figure 4): Comparing the unweighted data on attitudes toward politics to the Afrobarometer data shows that, overall, our respondents are substantially more critical of Nigerian politics than the population sampled in the Afrobarometer. For example, only around 11% of respondents in the NAHAA survey report that they are “completely” free to say what they think. That share is closer to 38% in the Afrobarometer. Similarly, when it comes to their evaluation of the state of democracy in Nigeria, 32% in the Afrobarometer are “not at all” satisfied, while that share is over 45% in the NAHAA data. Finally, while only 1% of those in the Afrobarometer contest that Nigeria is a not a democracy, 21% of the respondents in the NAHAA do. Again, the application of post-stratification weights does not consistently reduce these differences. The 95% confidence intervals of the weighted estimates generally include the unweighted estimates but in only two cases do they overlap with the reference data estimates.
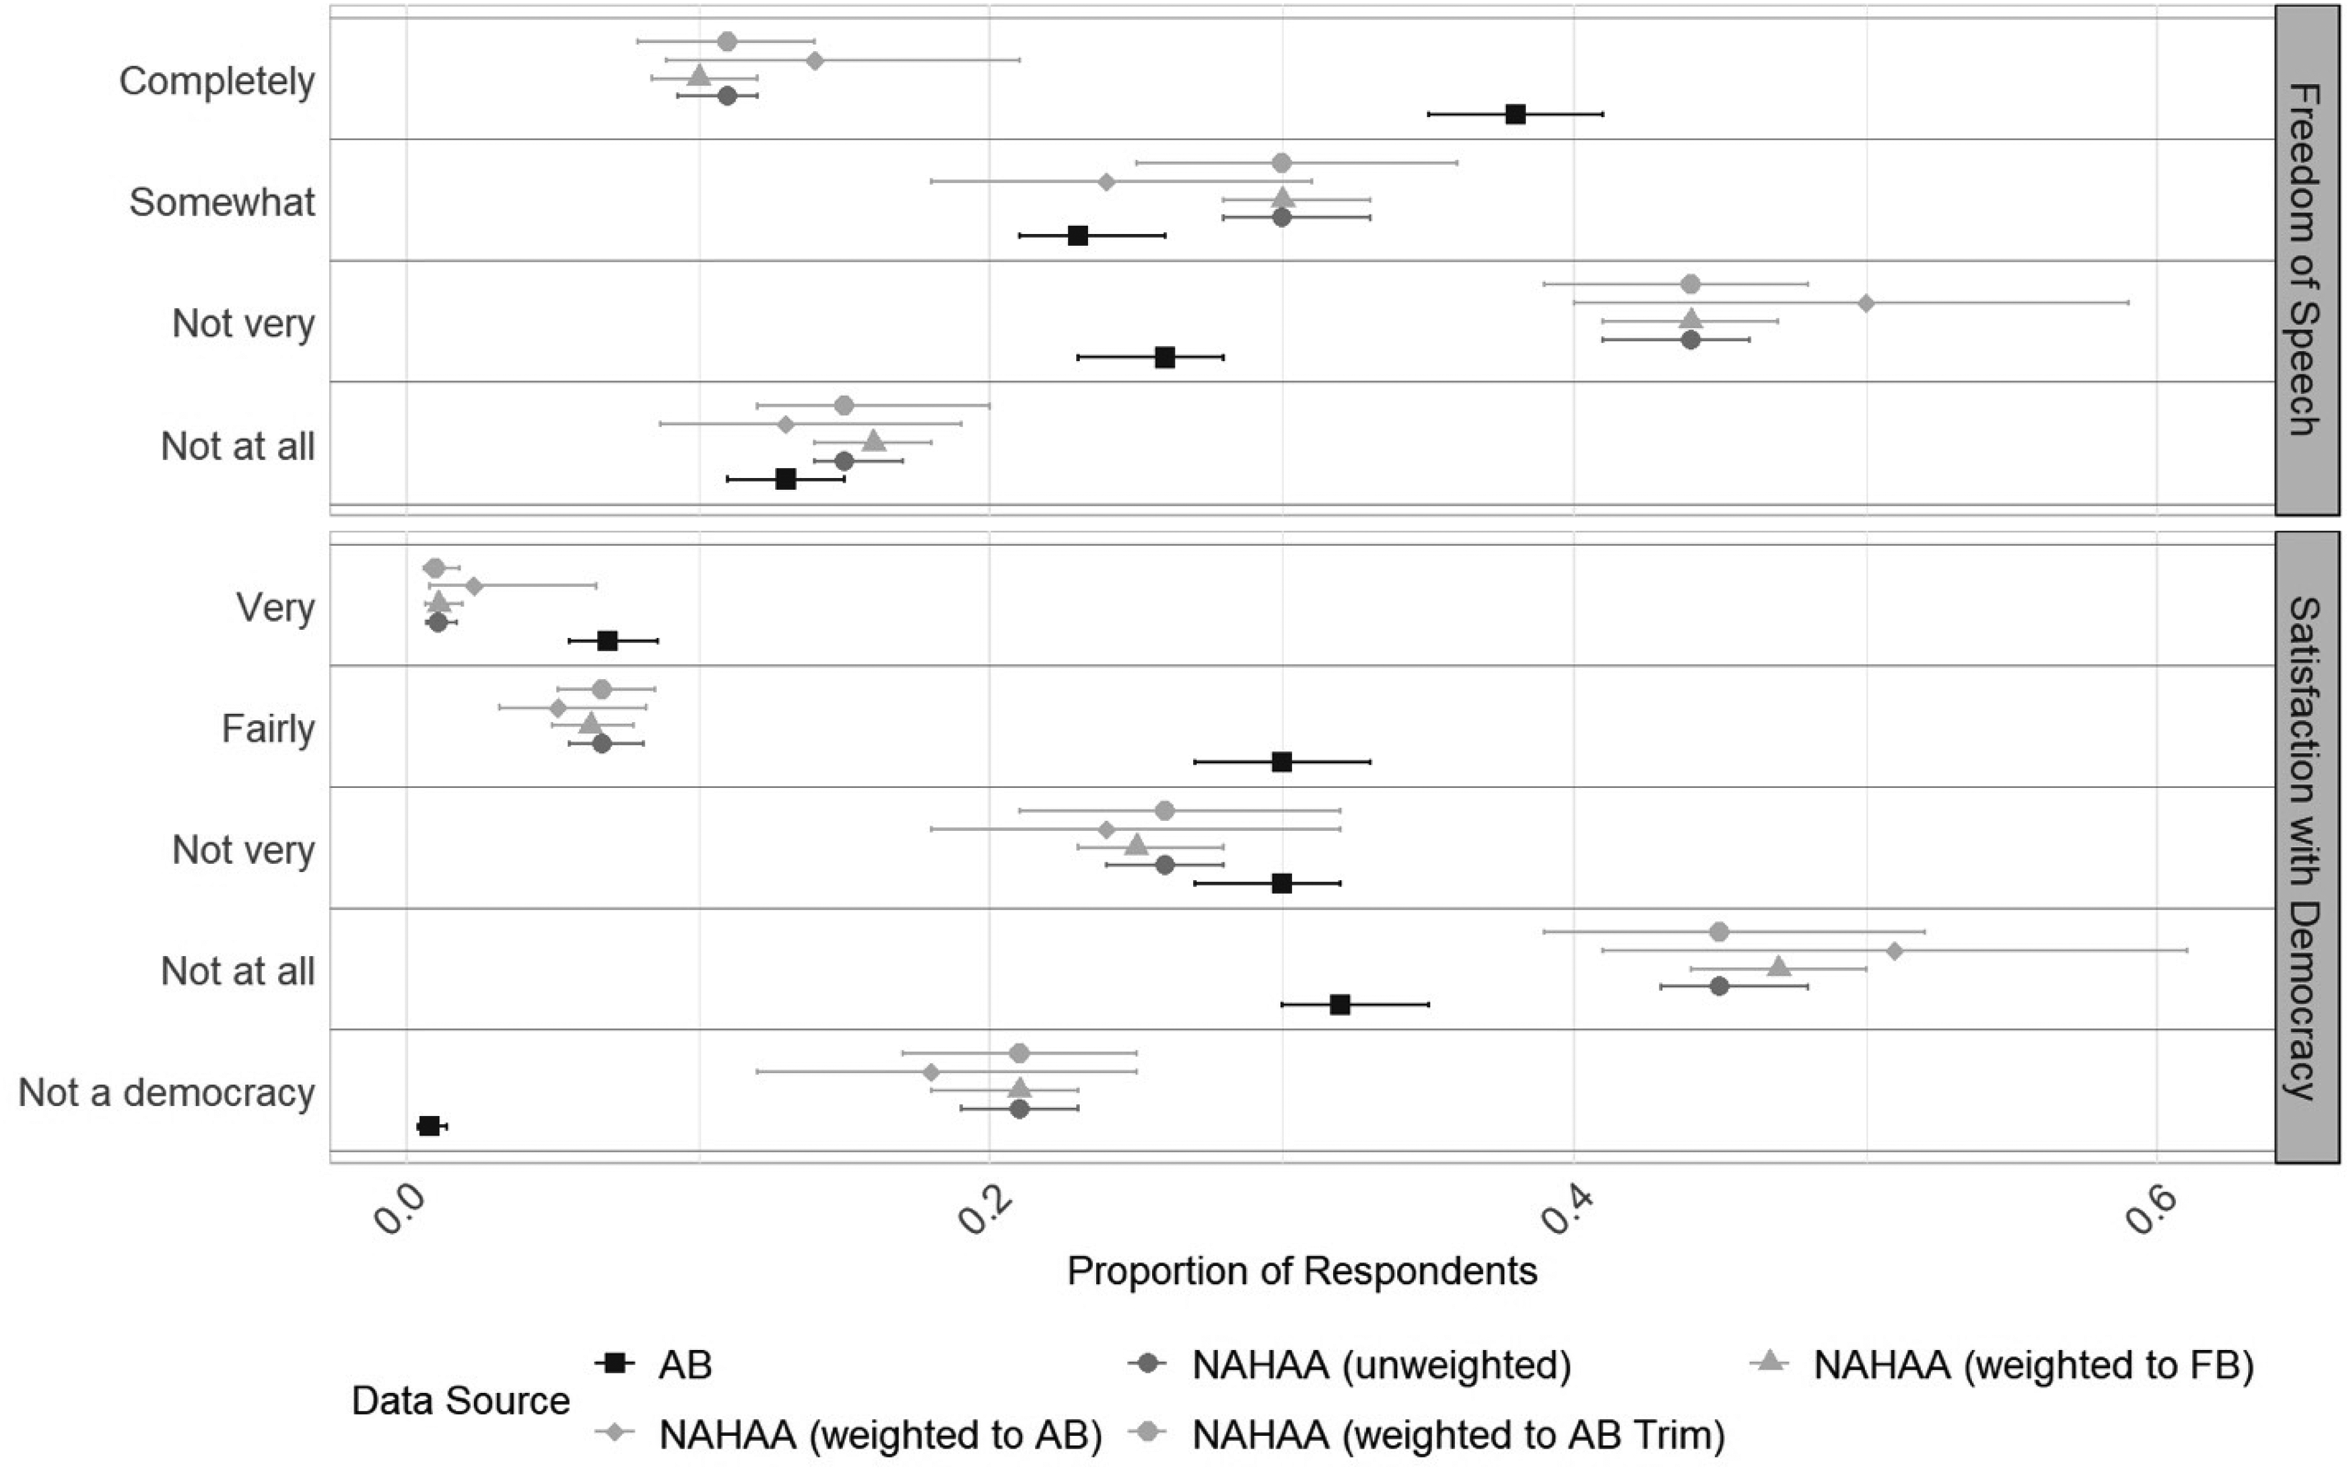
Assessment of freedom of speech and satisfaction with democracy in Nigeria. NAHAA data with different weights applied compared to Afrobarometer.
Sub-Population With Secondary Education or More
Since populations with low levels of education are the most difficult to reach through targeted online advertising, one analytical option is to scale back the ambition of population-level representation and limit the universe to those with at least secondary education. Appendix Tables B4 to B6 provide the analog to Tables 1 to 3 when restricting the scope to those with secondary education or more. When weighting to the subset of the benchmark data with secondary education or more, design effects are significantly smaller, especially for Italy (Kish DEFF 3.0 vs 10.3) and Nigeria (4.0 vs 15.7). However, since Facebook Audience estimates cannot be broken down by educational attainment, we cannot calculate these weights.
Nevertheless, when looking at the benchmark variables that were not part of the weighting process, the picture is very similar overall to the one using the full sample. Tables B7 and B8 in the Appendix summarize these results. In the case of Canada, the bias in terms of period of migration is the same for the educated subgroup as it is when considering the whole population, and the application of weights does not fundamentally address the underrepresentation of earlier arrival cohorts and the overrepresentation of more recent cohorts. The same pattern holds for the measures of attitudes in Nigeria.
Only in the case of religion and ethnicity in Nigeria is the discrepancy to the reference data notably smaller when looking at the unweighted data restricted to those with at least secondary education. This finding makes sense, given the large education bias in our Nigeria sample. But again, the differences we find in the educated sub-sample are not systematically reduced when we apply post-stratification weights. For example, while we overrepresent Christians by 29 percentage points in the full sample, that bias is reduced to 17 percentage points in the subs-sample with secondary education or more. Yet this still substantial bias is not further reduced when we apply post-stratification weights, and in fact, in some cases, bias even increases.
For certain aspects of migration research, the restriction to look at only those with secondary education or more might be acceptable. For example, of those considering migration in the Afrobarometer, 75% have a secondary education or above. Therefore, if the population of interest for migration scholars is those with intent to migrate, a sample recruited through the approach we describe for Nigeria might be sufficient. While more closely resembling the overall populations in some respects (notably educational attainment), such samples differ from population benchmarks. But generally, limiting the scope of research to only those with secondary education or more is not a trivial concession, and if inferences about the full population are critical, then complementing survey recruitment for emigrant populations on Facebook with other approaches to cover the non-immigrant population that stayed “at home” may be necessary. Since representative country-of-origin populations can be surveyed using traditional methods, such a strategy should be feasible and not cost-prohibitive in most contexts. Indeed, Nigerians in Nigeria are not a hard-to-find population. Therefore, the micro-targeting approach that Facebook allows does not provide the unique advantages it does when locating emigrant populations.
Discussion and Conclusions
Targeted advertising on social media sites provides researchers with a feasible strategy to survey populations that are hard to reach and where probability-based sampling is not an option because sampling frames do not exist and would be impossible or prohibitively expensive to construct. For migration research, these methods allow researchers to move beyond the usual research sites in economically developed destination countries to conduct multi-sited research across different countries of destination and include those who stayed home in the purview of analysis.
In this article, we present the first systematic evaluation of these methods when applying them to study migrant populations from a country in the global south as well as their utility in recruiting complementary samples of the population in the origin country. Whereas previous work has evaluated surveys recruited using micro-targeting on specific populations in developed countries (Schneider and Harknett 2022) or as a tool to survey populations in the developing world (Rosenzweig et al. 2020), there is limited research evaluating these methods in the context of migration research. The work that does exist is based on emigrant populations from developed countries like Germany (Pötzschke and Weiß 2020).
Our results point to both the unique potential as well as key challenges when using these approaches to study global diaspora populations, particularly those from the developing world. A key challenge is that low levels of (digital) literacy and formal education may put significant populations out of reach of recruitment through social media advertising and self-administered online surveys. In our case, these hurdles were highest when surveying those who stayed home (Nigerians in Nigeria) where there was substantial bias in the unweighted data, and the design effects associated with post-stratification weights to reduce this bias were very large. However, discrepancies were also substantial in the case of Italy. Only in the case of Nigerians in Canada, a highly select immigrant population in terms of education, was our data reasonably close to benchmark estimates from the Census, and were the design effects associated with post-stratification weights moderate.
Also concerning is the fact that applying post-stratification weights to our samples does not substantially reduce bias in the other variables we were able to compare. In the case of Nigeria, even after weights are applied, we see substantial discrepancies between our data and reference data on ethnicity and religion. We notably underestimate the share of the Hausa populations and Muslims by a substantial margin. Differences in the attitudinal measures we examined are substantial as well and not addressed through the application of post-stratification weights.
The underrepresentation of earlier arrival cohorts in Canada, which again is not ameliorated by our post-stratification weights, suggests another source of bias (misclassification). Possibly, the Facebook algorithm that creates the advertising category “expatriates” is less likely to identify those who migrated longer ago as members of that category. The lack of transparency in how social media companies like Meta create these targeting variables is a known liability of using these tools for survey recruitment (Pötzschke 2022). Our findings suggest that, indeed, there might be biases built into these targeting variables. In the case of migration research, this could lead researchers to miss or underestimate longer-settled and potentially more assimilated populations.
We based our approach on existing best practices and extensive pretests, but there certainly is room for improvement. Future research might explore changes to the advertising strategy, work across multiple social media platforms simultaneously, or significantly increase spending on advertising. While such approaches might improve reach in literate, albeit low-education populations, given the extremely small samples we were able to collect in some populations, such as the rural strata in the Nigerians “at home” sample, we are skeptical that collecting samples large enough to fully represent this population are feasible. Indeed, no amount of online advertising can reach individuals with limited literacy on a fundamentally text-based platform, much less recruit them to take an online survey.
New developments like chat-bot-driven surveys (Xiao et al. 2020), particularly if they can use voice recognition so that people do not have to read or write answers to survey questions, might provide other avenues to improve survey participation, but there is, so far, limited experience with these methods, and they might present other challenges. Researchers might opt for traditional telephone or face-to-face survey approaches. Since non-migrants in the countries of origin are, in most cases, not-hard-to-sample populations, the relative advantages of social-media-driven research are more limited. Depending on the context, research timeline, and budget constraints, contracting local survey firms or collaborating with local researchers might be strategies to collect comparison samples in countries of origin.
Emigrants from developing countries tend to be positively selected on education. Correspondingly, this population will have a smaller proportion that lacks a presence on social media and faces barriers to online survey participation—though since the educational selectivity of migrants generally increases with the skill-related earning differential between origin and destination (Grogger and Hanson 2011), this may be less true with respect to migration between less-developed countries (e.g., Nigerians in Cameroon). In cases where reference data is available and there is sufficient positive selection on education, applying post-stratification weights should be feasible and can correct for imbalance in demographic characteristics. But as our analysis shows, these weights are no panacea. For example, since low-educated emigrants who can respond may be systematically different from low-educated emigrants who cannot respond, even where post-stratification weights can be calculated, biases will likely remain.
Regardless, the key challenge in assessing the bias of social-media-driven samples will be the availability of reference data against which to assess representativeness or to use to calculate post-stratification weights. In many cases, not even basic demographics for migrants will be available. The larger project from which the data in this paper is drawn includes samples of Nigerians in a range of countries where we could not find any reference data, including Ghana, Cote d’Ivoire, Malaysia, the UAE, and South Africa. Weighting to the basic demographics (gender, age, and potential region) of Facebook's estimation of its reach can be one, albeit limited, approach in such cases. By definition, this kind of weighting will correct only for biases related to non-participation in the survey (selection bias) and cannot address bias arising due to populations disproportionally missing from Facebook altogether (coverage bias), so any estimates generated from such data cannot be considered representative of the migrant population in general. In our case, Facebook Audience weights do not address the significant education bias of the samples we collected and, in the case of Italy, only partially reduce the age and gender biases.
Yet this very issue—the lack of reference data—also points to one of the unique potentials of social-media-driven sampling. It allows researchers to collect data on populations that would otherwise be impossible or extremely resource-intensive to survey and to do so even when constrained by a limited budget. For migration research in particular, social media recruitment allows researchers to move beyond the inward-looking perspective (research on immigrants in one specific destination country) to cross-national data collection efforts that allow for the study of mobile populations across borders in a wide range of countries—a blind spot in current migration research. As our study has shown, using social media recruitment methods, researchers can, with relatively limited time and financial resources, generate samples of emigrant populations in a wide range of countries. These methods are especially suitable for studying highly educated (potentially) mobile populations (e.g., Soysal and Cebolla-Boado 2020). But as our evaluation clearly shows, targeted advertising on Facebook and Instagram almost completely misses those with little formal education, which, especially in developing countries, can be a significant share of the population. So, lest one blind spot is simply traded for another, researchers should be keenly aware of the limitations of data collected using these approaches.
Supplemental Material
sj-docx-1-smr-10.1177_00491241241266634 - Supplemental material for Promises and Limits of Using Targeted Social Media Advertising to Sample Global Migrant Populations: Nigerians at Home and Abroad
Supplemental material, sj-docx-1-smr-10.1177_00491241241266634 for Promises and Limits of Using Targeted Social Media Advertising to Sample Global Migrant Populations: Nigerians at Home and Abroad by Thomas Soehl, Zhenxiang Chen and Aaron Erlich in Sociological Methods & Research
Footnotes
Acknowledgments
For their excellent research assistance, we thank Favour Daka and Annie Chen. Participants in the Canada Research Chair in International Migration Research group provided helpful feedback on an earlier version of this manuscript. We also acknowledge constructive comments from three anonymous reviewers and the editors of Sociological Methods & Research. This research was supported by the Canadian Social Sciences and Humanities Research Council (SSHRC) through grant #430-2020-00675 awarded to the first author and the Canada Research Chair Program under CRC-2021-00458.
Declaration of Conflicting Interests
The authors declared no potential conflicts of interest with respect to the research, authorship, and/or publication of this article.
Funding
The authors disclosed receipt of the following financial support for the research, authorship, and/or publication of this article: This work was supported by the Social Sciences and Humanities Research Council of Canada, Canada Research Chairs (grant number 430-2020-00675, CRC-2021-00458).
Data Availability Statement
Supplemental Material
Supplemental material for this article is available online.
Notes
Author Biographies
References
Supplementary Material
Please find the following supplemental material available below.
For Open Access articles published under a Creative Commons License, all supplemental material carries the same license as the article it is associated with.
For non-Open Access articles published, all supplemental material carries a non-exclusive license, and permission requests for re-use of supplemental material or any part of supplemental material shall be sent directly to the copyright owner as specified in the copyright notice associated with the article.