
Abstract
Previous research reveals that the visual design of open-ended questions should match the response task so that respondents can infer the expected response format. Based on a web survey including specific probes in a list-style open-ended question format, we experimentally tested the effects of varying numbers of answer boxes on several indicators of response quality. Our results showed that using multiple small answer boxes instead of one large box had a positive impact on the number and variety of themes mentioned, as well as on the conciseness of responses to specific probes. We found no effect on the relevance of themes and the risk of item non-response. Based on our findings, we recommend using multiple small answer boxes instead of one large box to convey the expected response format and improve response quality in specific probes. This study makes a valuable contribution to the field of web probing, extends the concept of response quality in list-style open-ended questions, and provides a deeper understanding of how visual design features affect cognitive response processes in web surveys.
Keywords
Introduction
Open-ended questions can provide crucial insights into respondents’ attitudes and evaluations and are an essential addition to closed questions in the toolkit of survey researchers (Singer and Couper 2017). However, they are also more cognitively demanding than closed questions. Respondents cannot rely on pre-defined response categories to deduce the question meaning (Dillman, Smyth and Christian 2009), cannot be reminded of themes they might not have thought of otherwise (Schwarz 1999), and must formulate their answers in their own words (Keusch 2014). Consequently, respondents rely more heavily on the visual information provided (e.g., size of the answer box) as an additional source of information to interpret the meaning of an open-ended question and draw conclusions about the expected response format (Couper et al. 2011). However, despite various efforts to take advantage of visual design features to facilitate the response process and to improve the quality of responses to open-ended questions, problems remain, such as item non-response and answers that are too brief or otherwise inadequate (Reja et al. 2003; Smyth et al. 2009). One reason for the often moderate success of these visual design efforts could be that open-ended questions differ in terms of the required response format and their optimal visual design.
In web surveys, open-ended questions are increasingly used for web probing. Web probing applies probing techniques from cognitive interviewing (Behr et al. 2017). Probes are questions that ask respondents to provide additional information after answering a closed question (Beatty and Willis 2007). Web probing is a crucial tool for assessing the validity and comparability of survey questions (Behr et al. 2017; 2020). Its usefulness has frequently been acknowledged (e.g., Anstötz, Schmidt and Heyder 2019; Fowler and Willis 2020; Geisen and Murphy 2020; Silber, Zuell, and Kühnel 2020; Singer and Couper 2017), and methodological research on web probing is ongoing (Behr et al. 2012; Edgar, Murphy and Keating 2016; Lenzner and Neuert 2017; Meitinger and Behr 2016; Meitinger, Braun, and Behr 2018; Meitinger, Behr and Braun 2021; Neuert and Lenzner 2021; Scanlon 2019). Due to the valuable methodological and substantive insights that this approach can provide, more and more researchers have been using web probing in recent years (e.g., Behr et al. 2014; Braun et al. 2018, 2019; Efremova et al. 2017; Lee et al. 2020; Meitinger 2017, 2018; Schulz et al. 2018).
Web probing predominantly uses three types of probes, each targeting different aspects of the response process. A category-selection probe asks respondents for the reasons why they chose an answer category, a comprehension probe requests a definition of a certain term, and a specific probe asks respondents to provide additional information on a particular detail of a preceding question (Prüfer and Rexroth 2005; Willis 2004). An example of a specific probe would be “Which social security benefits did you have in mind when answering the previous question?”, a potential answer being “family and health benefits, parental allowance, pension.”
So far, specific probes have usually been asked as narrative open-ended questions with one answer box. However, when it comes to optimal visual design, a list-style open-ended question might be the more appropriate format for specific probes. List-style open-ended questions are narrative open-ended questions that ask respondents to enumerate several aspects relating to the issue in question (e.g., “What are the biggest problems facing the country today?”). This question format typically prompts respondents to provide rather short but on-the-spot responses. The purpose of list-style open-ended questions is to reveal the variety of aspects respondents may think of when answering a question on a certain issue (Keusch 2014). Thus, relating to specific probes, multiple small answer boxes would more clearly convey the expected response format because respondents are expected to enumerate briefly but as completely as possible all aspects they thought of when responding to the previous question. However, to the best of our knowledge, no prior studies have tested the use of a list-style open-ended question format for specific probes.
This experimental study aimed to find the most appropriate visual design for specific probes as a type of list-style open-ended question format. The optimal visual design triggers respondents to provide the information in the desired response format––a comprehensive list of all information in a rather concise form. Based on a between-subjects design, we systematically investigated the effects of different numbers of answer boxes in specific probes using response quality indicators known from previous research on list-style open-ended questions, supplemented by several new indicators. We based our hypotheses about how the number of answer boxes affects response quality on the cognitive response process.
Visual Design of List-Style Open-Ended Questions
List-style open-ended questions are usually provided with several small answer boxes instead of one large answer box. Previous studies dealing with the optimal number of answer boxes in list-style open-ended questions are summarized in Table 1.
Previous Studies on Visual Design Variations of List-Style Open-Ended Questions.
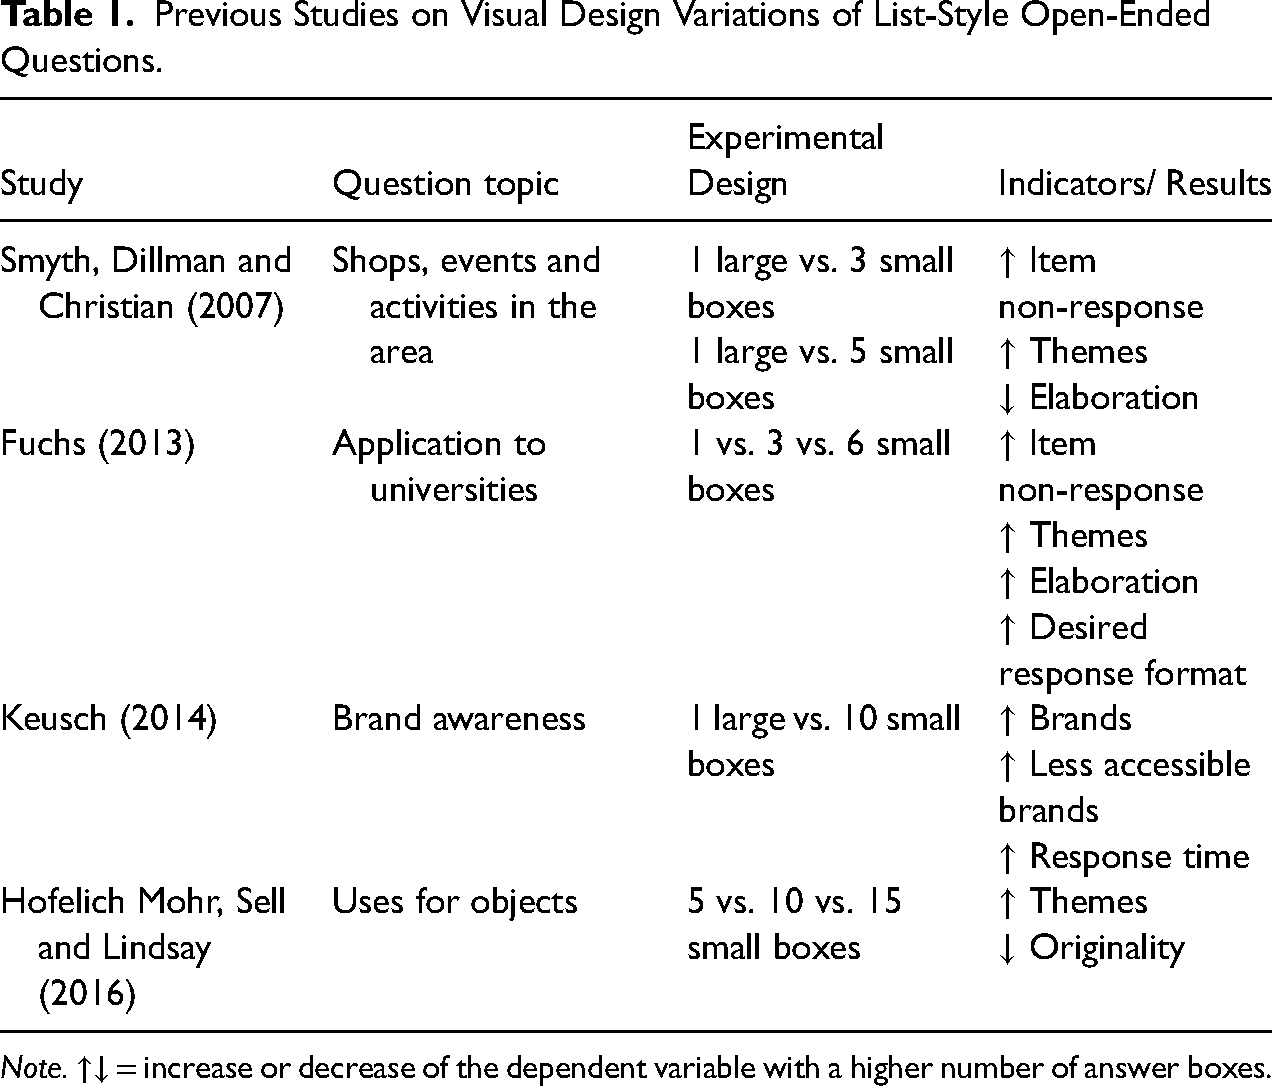
Note. ↑↓ = increase or decrease of the dependent variable with a higher number of answer boxes.
Findings have consistently shown that a higher number of answer boxes increases the number of themes or brands mentioned (Fuchs 2013; Hofelich Mohr, Sell and Lindsay 2016; Keusch 2014; Smyth, Dillman and Christian 2007). However, a higher number of answer boxes also increases item non-response (Fuchs 2013; Smyth, Dillman and Christian 2007). Less consistent results have been found regarding the extent of elaboration; this is the extent to which respondents provide extra details or descriptions of the themes or brands mentioned. Smyth, Dillman and Christian (2007) found a lower percentage of respondents who elaborated on their responses with a higher number of answer boxes. Fuchs (2013) found the reverse, more elaboration with more answer boxes. Further more, Fuchs (2013) showed that respondents were more likely to answer in the desired format when several small answer boxes were provided. Keusch (2014) revealed that respondents mentioned more less accessible brands when they received several answer boxes. However, this increased response time. Additionally, Hofelich Mohr, Sell and Lindsay (2016) reported that the originality of responses decreases with more answer boxes.
Cognitive Processing in Web Surveys
When respondents answer survey questions, they go through several stages of the cognitive response process (e.g., Groves 1989; Sudman, Bradburn and Schwarz 1996; Tourangeau, Rips and Rasinski 2000): (i) Comprehending the question's meaning, (ii) retrieving relevant information from their memory, (iii) forming a judgment based on the retrieved information, and finally, (iv) reporting their response. The cognitive response process is a general model of how respondents answer survey questions, including list-style open-ended questions, that can help us think about the best way to design questions. In self-administered web-based surveys, the additional stage of visual perception precedes these four stages. At this very first stage, respondents perceive and process the relevant visual design features of a question (Jenkins and Dillman 1997; Toepoel and Dillman 2010). Instead of going through one cognitive stage after another, respondents are likely to go back and forth between different tasks; for instance, they may start feedback loops between the comprehension and retrieval stage or any other stage (Sudman, Bradburn and Schwarz 1996:56). Ideally, respondents conscientiously go through all stages of the cognitive response process before giving a response—a response behavior known as optimizing. However, respondents often perform the different stages less thoroughly (weak satisficing) or completely skip one or more stages of the cognitive response process (strong satisficing). Satisficing behavior mainly depends on the difficulty of the response task as well as on the respondents’ ability and motivation to perform the task (Krosnick 1991).
The Current Study
This experimental study aims to find the optimal visual design for specific probes to obtain high-quality answers. For specific probes, an optimal answer is an enumeration of all themes included in the response to the previous closed question. Relating to the cognitive response process, this means that respondents first perceive the specific probe and corresponding answer box(es), comprehend the meaning of the specific probe, recall the information included in the answer to the previous question, decide which information to include in their judgment, and write their answer in the answer box(es).
Depending on the number of answer boxes, we assumed different cognitive mechanisms that occur in the respective stages of the cognitive response process. We also assumed that an increase in the number of answer boxes would encourage respondents to go back and forth between the different stages of the cognitive response process. The various mechanisms and feedback loops triggered by multiple answer boxes can influence response quality in various ways. Figure 1 is a schematic representation of the effects of multiple answer boxes on response quality as a function of the different stages of the cognitive response process. We are aware that the cognitive mechanisms that multiple answer boxes may trigger are most likely interrelated. Their effects on response quality can occur either alone or in interaction with each other. We also acknowledge the complexity that some quality indicators may be influenced by multiple mechanisms and therefore cannot necessarily be attributed to only one of the stages of the cognitive response process. Nevertheless, we chose to assign each response quality indicator primarily to one of the stages of the cognitive response process (except response time which was considered the result of all processing steps). Our theoretical assumptions underlying these associations and the hypotheses derived are elaborated in the following. The operationalization of our indicators is described in the later section Data and Methods.
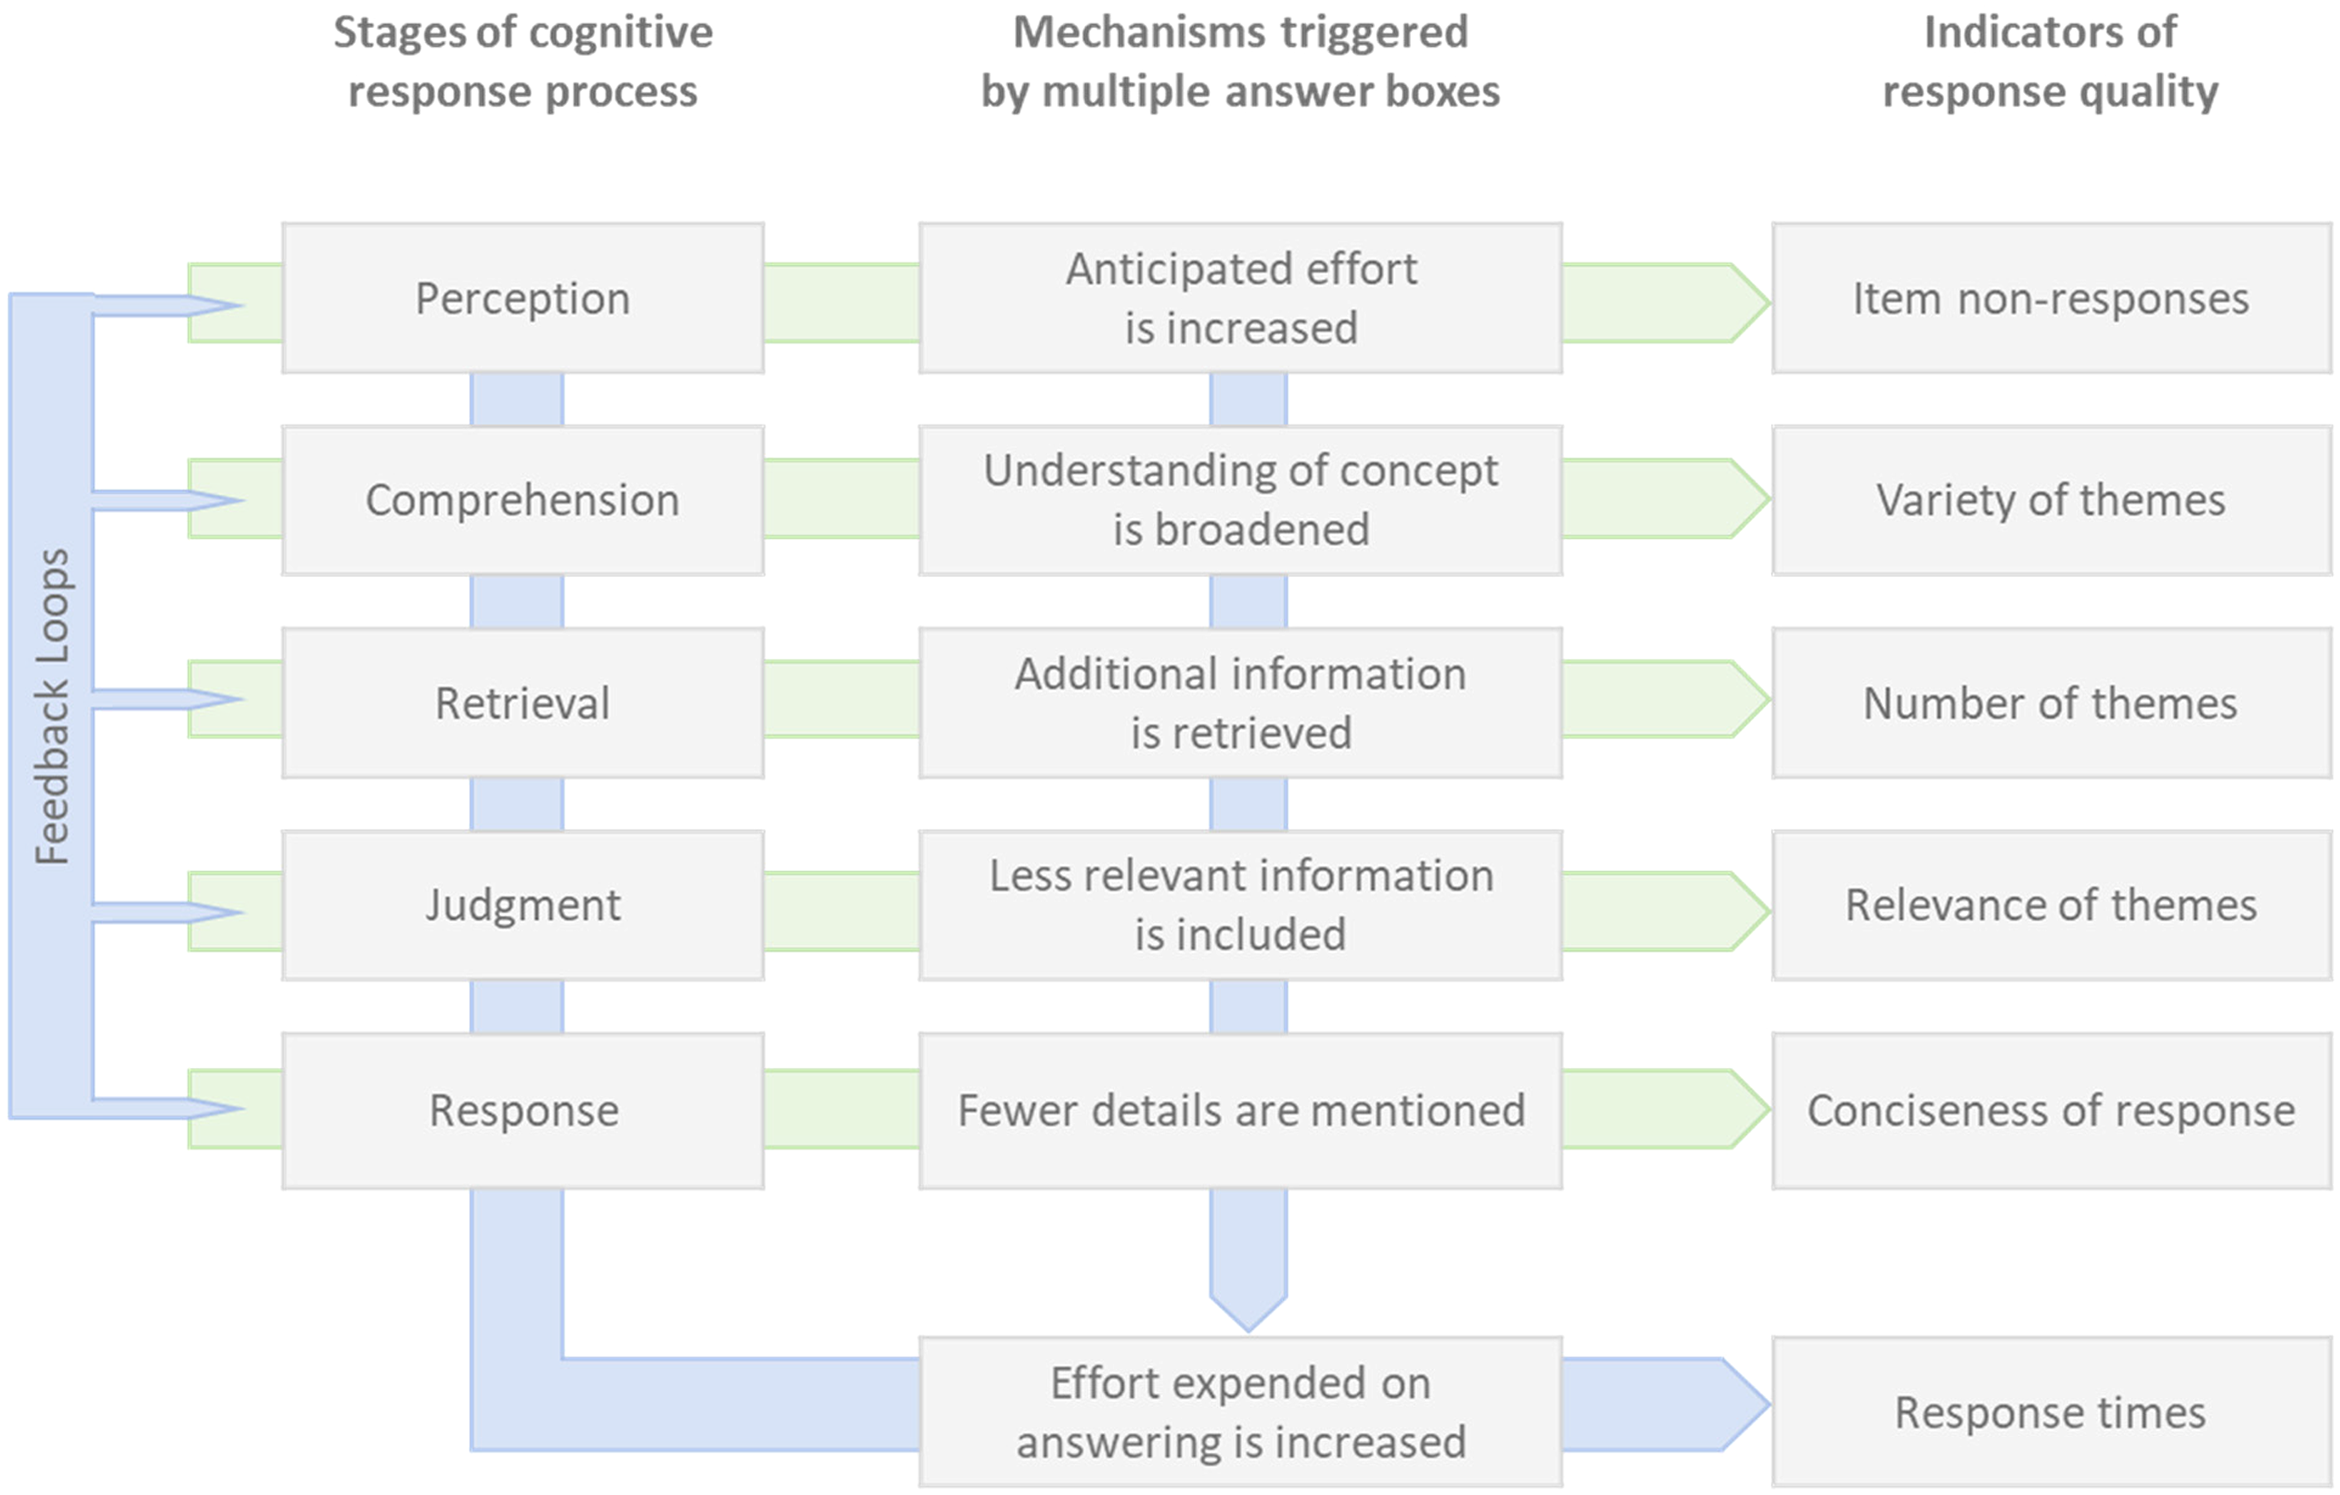
Schematic representation of the effects of multiple answer boxes in specific probes on cognitive processing and response quality.
Effects at the Perception Stage
In general, open-ended questions are more difficult to process than closed questions. Due to a lack of pre-defined response categories, question meanings are more challenging to infer, retrieval and judgment processes need to be based on free recall instead of cued recall, and responses must be written by the respondents in their own words (Schwarz 1999; Zuell and Scholz 2015). This task is likely to be perceived as even more difficult if several answer boxes signal that the answer should be as comprehensive as possible. Providing many answer boxes may have a discouraging effect on respondents already at the perception stage, either because they do not feel able to match the expected response format or because they are not sufficiently motivated to make the necessary effort to do so (Beatty and Herrmann 2002). Because of the anticipated increased effort, respondents may decide not to answer. H1: A higher number of answer boxes increases item non-responses.
Effects at the Comprehension Stage
Providing an adequate answer to a survey question “requires not only an understanding of the literal meaning of the question, but involves inferences about the researcher's intention to determine the pragmatic meaning of the question” (Schwarz 1999:20). To infer the intended (pragmatic) meaning of a question and determine which information is of interest, respondents use the verbal and visual context in which the question is presented (Sudman, Bradburn and Schwarz 1996:62–69). In addition, respondents rely on the norms of conversational conduct described by Grice (1975:45–46), encompassing the four maxims of quantity, quality, relation, and manner. Accordingly, answers should be informative, truthful, relevant, and perspicuous (i.e., clear and precise).
Since there are no verbal response categories in open-ended questions, respondents use the number of answer boxes as relevant visual cues to conclude the intended meaning of the question. Providing several answer boxes creates the expectation that multiple responses are to be listed. To act on the maxim of quantity and to give informative responses, “respondents may hesitate to reiterate information that they have already provided in [their] response” (Schwarz 1999:36). Respondents may feel compelled to broaden their understanding of the underlying theoretical construct of the question to give responses that provide “new” information. Thus, instead of elaborately setting forth the same thought, respondents may think more broadly about the issue in question. And although the literal meaning of the question does not change, multiple answer boxes may alter the pragmatic meaning of the underlying construct, potentially translating into a greater variety of themes mentioned. H2: A higher number of answer boxes leads to a greater variety of themes mentioned
Effects at the Retrieval and Judgment Stages
Once respondents have decided on the meaning of the question, they retrieve relevant information from memory, based on which they then form a judgment. Although respondents store a vast amount of information in their long-term memories, they can only retrieve and use a small percentage of it when answering a survey question (Zaller and Feldman 1992). This is aggravated by the fact that respondents rarely have ready-for-use answers stored in their memory, which is why in most instances, they first have to form a judgment on the spot (Schwarz 1999; Zaller and Feldman 1992). In doing so, they primarily access the information that first comes to mind, “ideas that are at the top of the head at the moment of decision” (Zaller and Feldman 1992:606). Thus, respondents usually use information that is most easily accessible (Bassili 1995; Schwarz, Strack and Mai 1991; Stalans 1993); these salient attitudes are generally issues that are important to respondents (Geer 1991). Moreover, respondents do not necessarily retrieve all potentially relevant information but rather stop the information search process as soon as they retrieve sufficient information to form a satisfying judgment (Krosnick 1991; Schwarz 1999).
A higher number of answer boxes signals multiple responses to be listed, which may encourage respondents to start feedback loops between the retrieval and judgment stages. On the one hand, these feedback loops can lead respondents to extend the retrieval process. Additional information is retrieved to match the expectation of a comprehensive response. As a result, a higher number of themes can be expected. However, since specific probes ask respondents to list the themes they had in mind when answering the previous closed question, this already limits the number of themes respondents can potentially mention in the specific probe. On the other hand, feedback loops between the retrieval and judgment stages may lead to less salient information being included in the judgment process. That is, respondents write the information that is most salient to them in the first answer box. If there are more answer boxes left, respondents may search their memory for additional information. To comply with the maxim of quantity and avoid redundancy, “new” information is retrieved. Thus, respondents may include new but probably less relevant information in their judgments, to the detriment of the maxim of relation. In this context, however, it is essential to note that if respondents include information that—although less relevant—is still relevant, this will lead to a more complete answer. H3: A higher number of answer boxes increases the number of themes mentioned.
H4: A higher number of answer boxes reduces the relevance of themes mentioned.
Effects at the Response Stage
A response should be as informative as possible but not more informative than necessary. Moreover, it should be clear and precise in terms of being unobscured, unambiguous, brief, and orderly (Grice 1975:45–46). Using several small answer boxes gives visual emphasis to both maxims and signals the respondents to provide rather short responses without being wordy. Thus, we assumed that several small answer boxes would encourage respondents to give their answers in as much detail as necessary to be meaningful and codable, but at the same time as briefly enough to match the expected response format. The quality of providing the necessary information in a few words is what we call conciseness of response. H5: A higher number of answer boxes increases the conciseness of responses.
Effects at Several Stages
As already mentioned, we expected that multiple answer boxes promote feedback loops between the different stages of the cognitive response process. To complete multiple feedback loops, respondents must invest more effort. The first few feedback loops might be easy and fast to process, while the cognitive and time effort is likely to increase for later loops (Zaller and Feldman 1992). Therefore, we expected that specific probes with multiple answer boxes would result in longer response times due to more extensive processing on the part of the respondents (Callegaro et al. 2009). H6: A higher number of answer boxes increases the time it takes to answer.
Data and Methods
Sample
The experimental study was embedded in a web survey on “Politics and Work” conducted in November 2017 among participants from a non-probability online access panel in Germany. The panel provider was respondi AG (https://www.respondi.com/EN/), a company that adheres to ISO 26362, an international standard for raising quality and transparency in access panels in market, opinion, and social research. Quotas for gender, age, and education were applied (see Appendix A.1). From the 3,030 panelists invited to the web survey, 498 were screened out because respective quotas were full or because respondents did not meet the age requirements for participation (18 to 69 years). In total, 2,247 respondents completed the survey with a break-off rate of 8% (Callegaro and DiSogra 2008). Among all respondents, 51% were female, the average age was 45, and 34% had a high level of education (i.e., met university entry requirements). The questionnaire included 72 questions (including the quota questions and several assessment questions). On average, the questionnaire took 32.9 min to complete (
Experimental Design
The experimental design was tested with two questions. The first question on “happiness in life” (Q1) comes from the German World Values Survey (2013): “Generally speaking, would you say that you currently are very happy, quite happy, not very happy, or not at all happy?” (translated from German). Q1 was asked at the beginning of the questionnaire directly after the quota questions. The second question on “satisfaction with democracy” (Q2) was adapted from the Eurobarometer (2017): “On the whole, how satisfied are you with the way democracy works in Germany?” (translated from German). Q2 was located close to the middle of the questionnaire. Both questions were answered on a 4-point fully labeled rating scale running from very happy to not at all happy (Q1) and very satisfied to not at all satisfied (Q2). We provided a “don’t know” option in both questions.
The three steps of our experimental design are shown in Figure 2 (using Q1 as an example). After the respondents have answered the closed question (step 1), they received a specific probe (step 2) that asked them to report which aspects they thought of when answering the previous closed question. Based on a between-subjects design, respondents were randomly assigned to one of four answer box conditions. In the control group, respondents answered the specific probe with one large answer box. In the experimental groups, respondents received 3, 5, or 10 small answer boxes, respectively (see Appendix A.2). To clarify the expected response format in the experimental groups, we provided instructions after the question stem (“Please provide one aspect per answer box”) and placeholder texts in each answer box (“aspect 1”, “aspect 2”, etc. in light gray). The placeholder text disappeared when respondents wrote their answers in the corresponding answer box. In each of the four experimental conditions, the wording of the closed question was repeated below the answer box(es) to remind respondents of the question content. Since we found no significant differences in the respondents’ gender, age, and level of education across the experimental conditions, random assignment was deemed successful (see Appendix A.3).
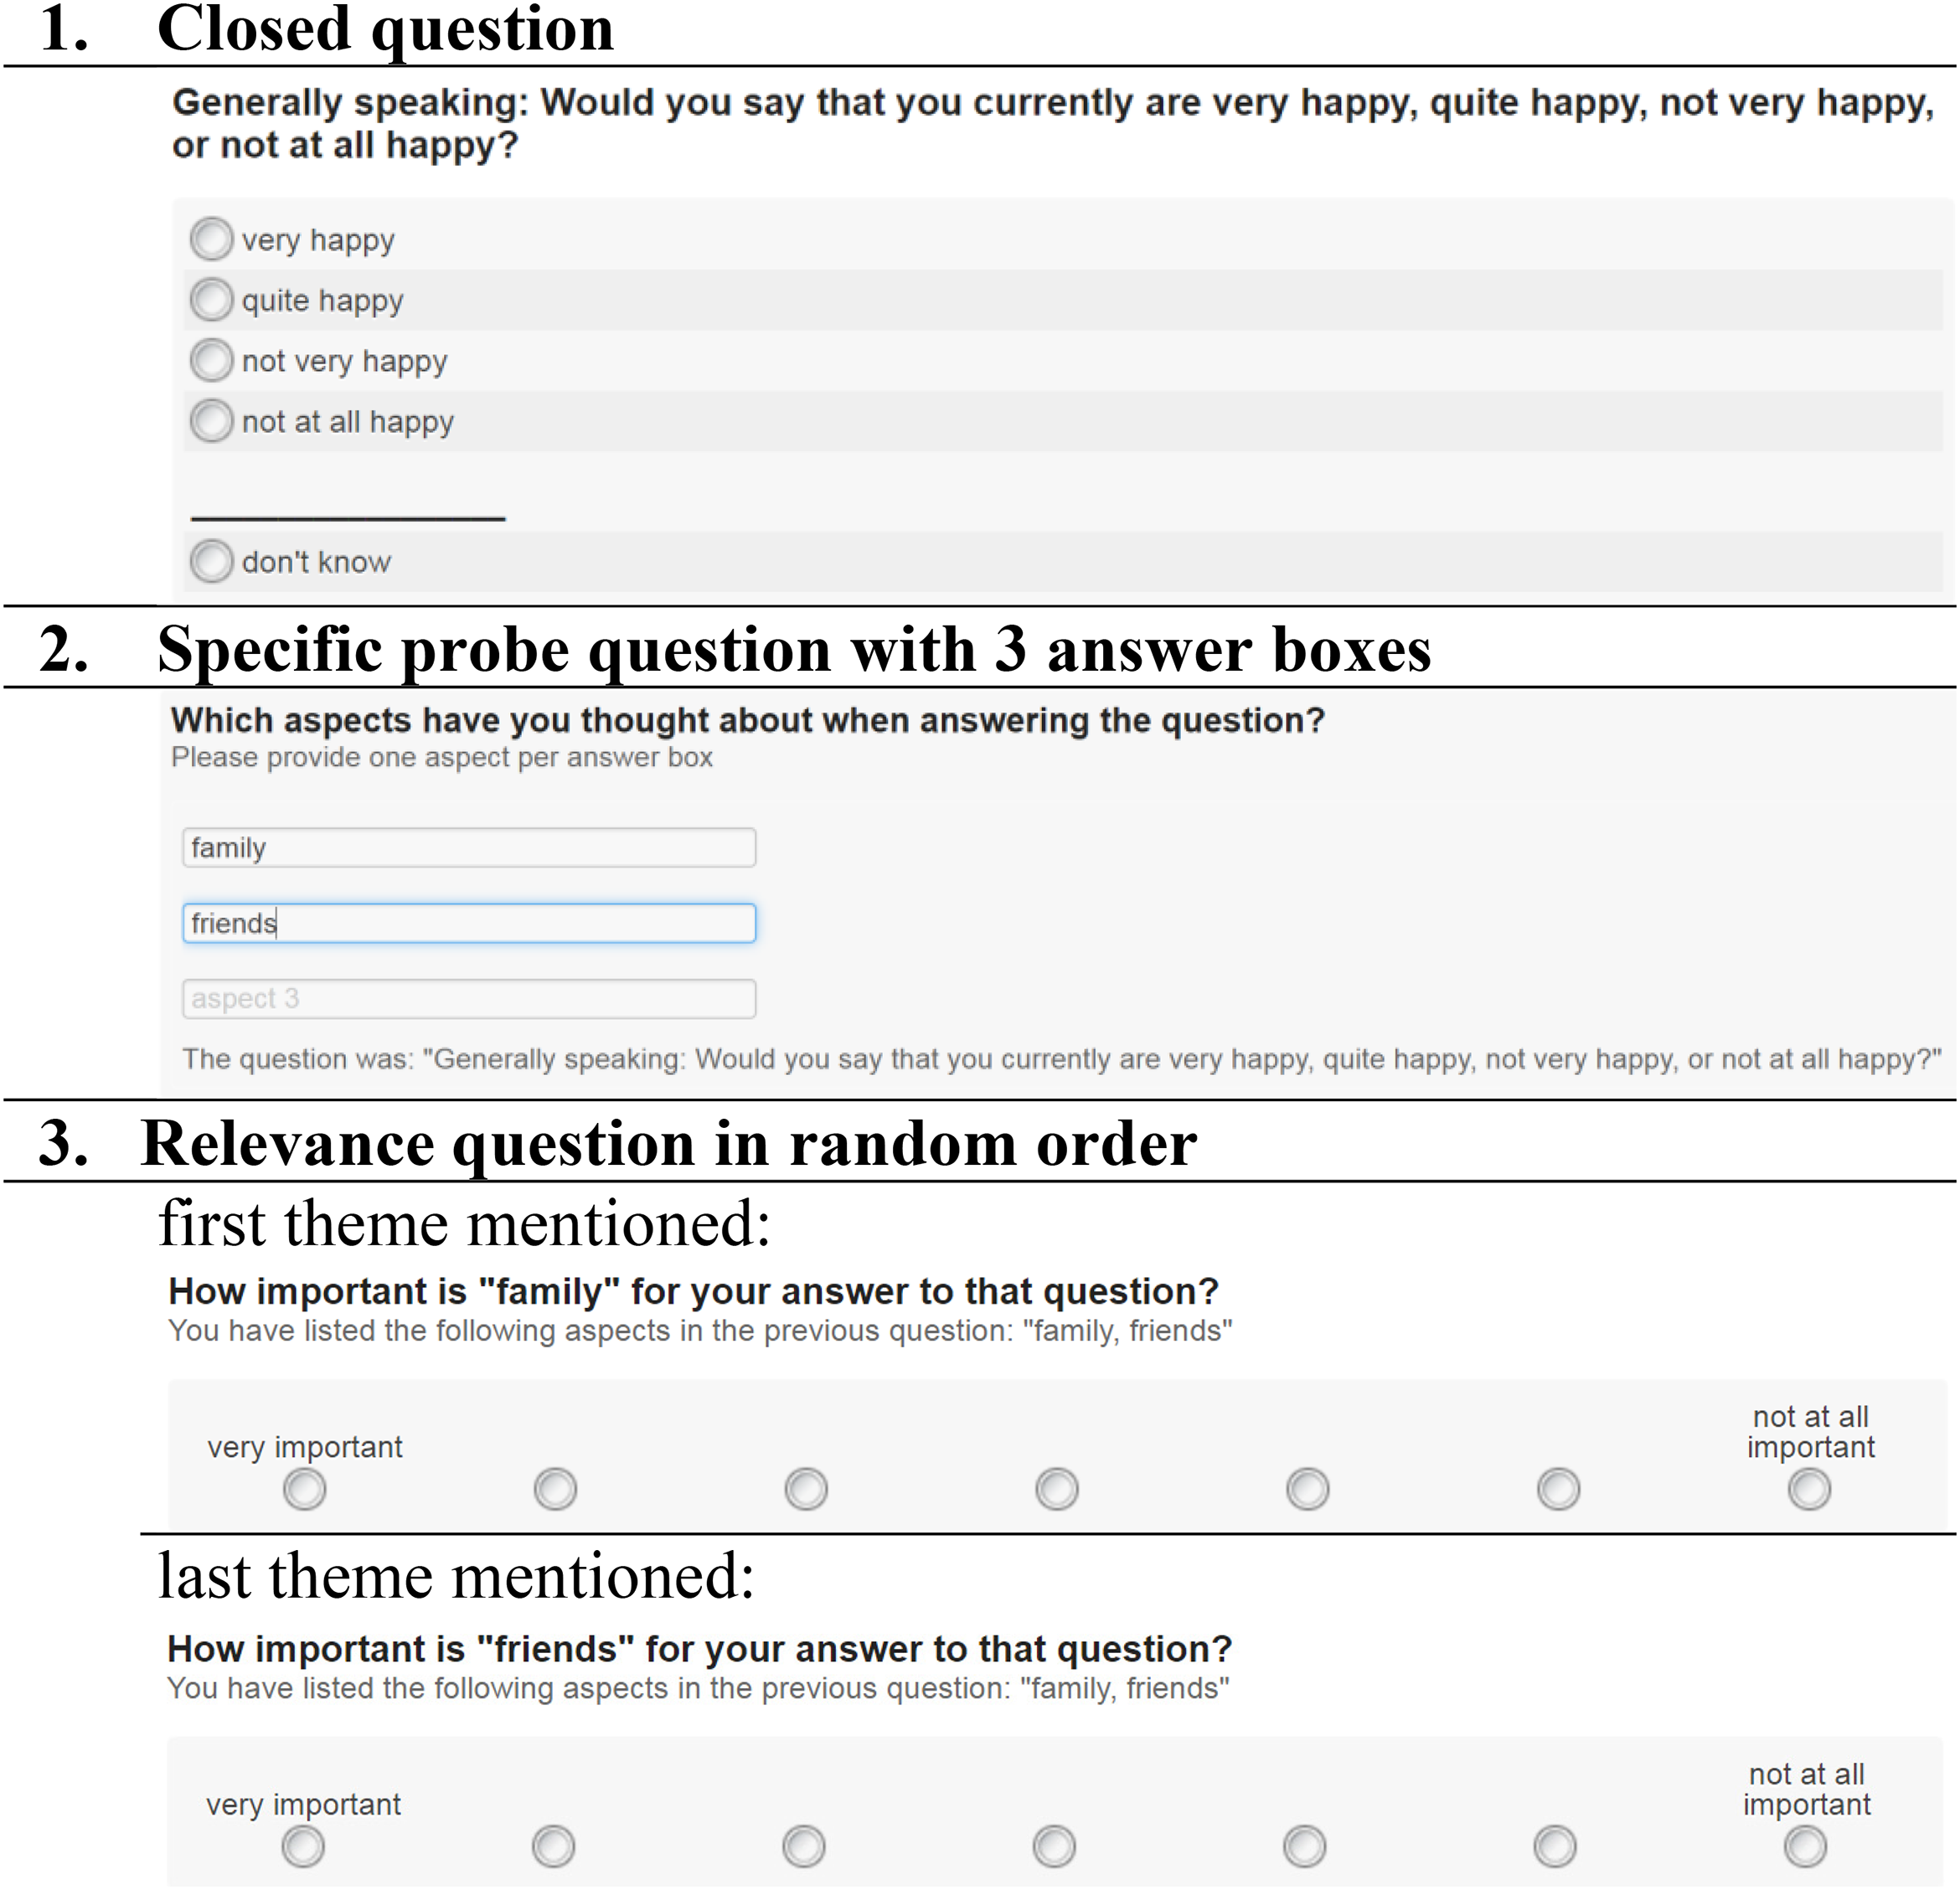
Schematic representation of the experimental design by the example of 3 small answer boxes in Q1 (translated from German).
After the specific probe, all respondents were asked two relevance questions (step 3). Relevance is the situational importance that someone attaches to something in a particular context. We therefore asked how important the respondents thought the first and last theme they mentioned in the specific probe was. In the experimental groups, the wording of the relevance questions was customized for each respondent by inserting the specific content of the first and last aspect, respectively (e.g., “How important is ‘family’ for your answer to this question?”, with “family” as piped text for the first aspect). In the control group, it was technically not possible to adjust the wording of the relevance questions. Therefore, the respondents were asked independently of their previous answers for the relevance of the first and last aspect, respectively (“How important is the first [last] mentioned aspect for your answer to this question?”). The relevance questions had a 7-point end-labeled rating scale ranging from very important to not at all important. The aspects mentioned by the respondents in the specific probe were repeated under the question stem of the relevance questions.
Coding Procedure
Based on the open-ended responses to the specific probes, we developed two separate coding schemes that captured the different themes mentioned and methodological aspects (i.e., problems with the question, different reasons for item non-response). Regarding the substantive coding of themes mentioned, we distinguished between themes (or codes: Q1 = 24, Q2 = 53) and theme areas (or code families: Q1 = 9, Q2 = 6). Several themes could be assigned to one theme area (e.g., the two codes “physical health” and “mental health” both belong to the code family “health-related aspects”). The coding schemes are available from the authors upon request.
The responses to the specific probes were coded by three student assistants who had previous experience in coding and received additional training in applying each coding scheme. All responses were coded by one coder, and 25% of the responses were double-coded by another. Inter-coder reliability was calculated according to Holsti (1969). Holsti's reliability coefficient was computed by multiplying the number of coder agreements with the number of coders and dividing this number by the sum of assigned codes per coder. Inter-coder reliability was deemed satisfactory (91% for Q1 and 83% for Q2). Any coding discrepancies were discussed in the research team and corrected in the final dataset.
Measures
To assess item non-response, we distinguished between complete non-response rates as the proportion of respondents who gave no response at all (i.e., answer box was left blank), and soft non-response rates as the proportion of respondents who gave a response that could not be meaningfully interpreted and coded (e.g., “don’t know” answers, nonsense answers with a random sequence of numbers or characters, non-specific answers without sufficient information for adequate coding) (Holland and Christian 2009; Revilla and Ochoa 2016). We measured the variety of themes using two indicators: the number of theme areas each covering several themes, and the “off-mainstream” rate, calculated as the proportion of respondents who mentioned theme areas other than the two most frequent (“social network” and “health” in Q1; “democratic system” and “societal situation” in Q2). We counted the number of themes mentioned across all theme areas. As a new quality indicator, which to our knowledge has not yet been investigated in previous studies, we measured the relevance of themes using importance ratings of the first and last theme, with high values corresponding to high importance, respectively (based on the respondents’ answer to both relevance questions). We also looked at the differences in importance with the proportions of respondents who rated (i) the last theme as just as important as the first, (ii) the last theme as more important than the first, and (iii) the last theme as less important than the first. We measured the conciseness of responses by the number of characters written per theme mentioned. Finally, we examined two measures of response times: the total response time that elapsed between the complete loading of the web page with the specific probe and the respondent clicking the “Next” button, and, to account for the varying number of themes mentioned, the response times per theme.
Analyses
The final coding of the responses to the specific probes was transferred to SPSS. All analyses were conducted using IBM SPSS Statistics version 24.0. The item non-response analyses were based on all respondents in the final sample who answered the previous closed question. All remaining analyses were constrained to respondents who provided a substantive answer to the closed question, the specific probe, and the two relevance questions (first and last theme). The analyses of the relevance of themes were based on those respondents who mentioned at least two themes and answered both relevance questions. Cases with unreasonably long response times (>1000 s) due to interruptions on the page with the experimental question were excluded. Time outliers were also removed at two standard deviations above the group mean for all remaining analyses. 1 The sample sizes for each set of analyses are shown in Table 2. We performed analyses of variance (ANOVA) for continuous dependent variables and Pearson's Chi-square tests for categorical dependent variables to evaluate differences between experimental conditions. We performed overall tests that included all four experimental conditions and applied a Bonferroni correction for pairwise comparisons of experimental conditions.
Response Quality Indicators Depending on the Number of Answer Boxes in Specific Probes on “Happiness in Life” (Q1) and “Satisfaction with Democracy” (Q2).
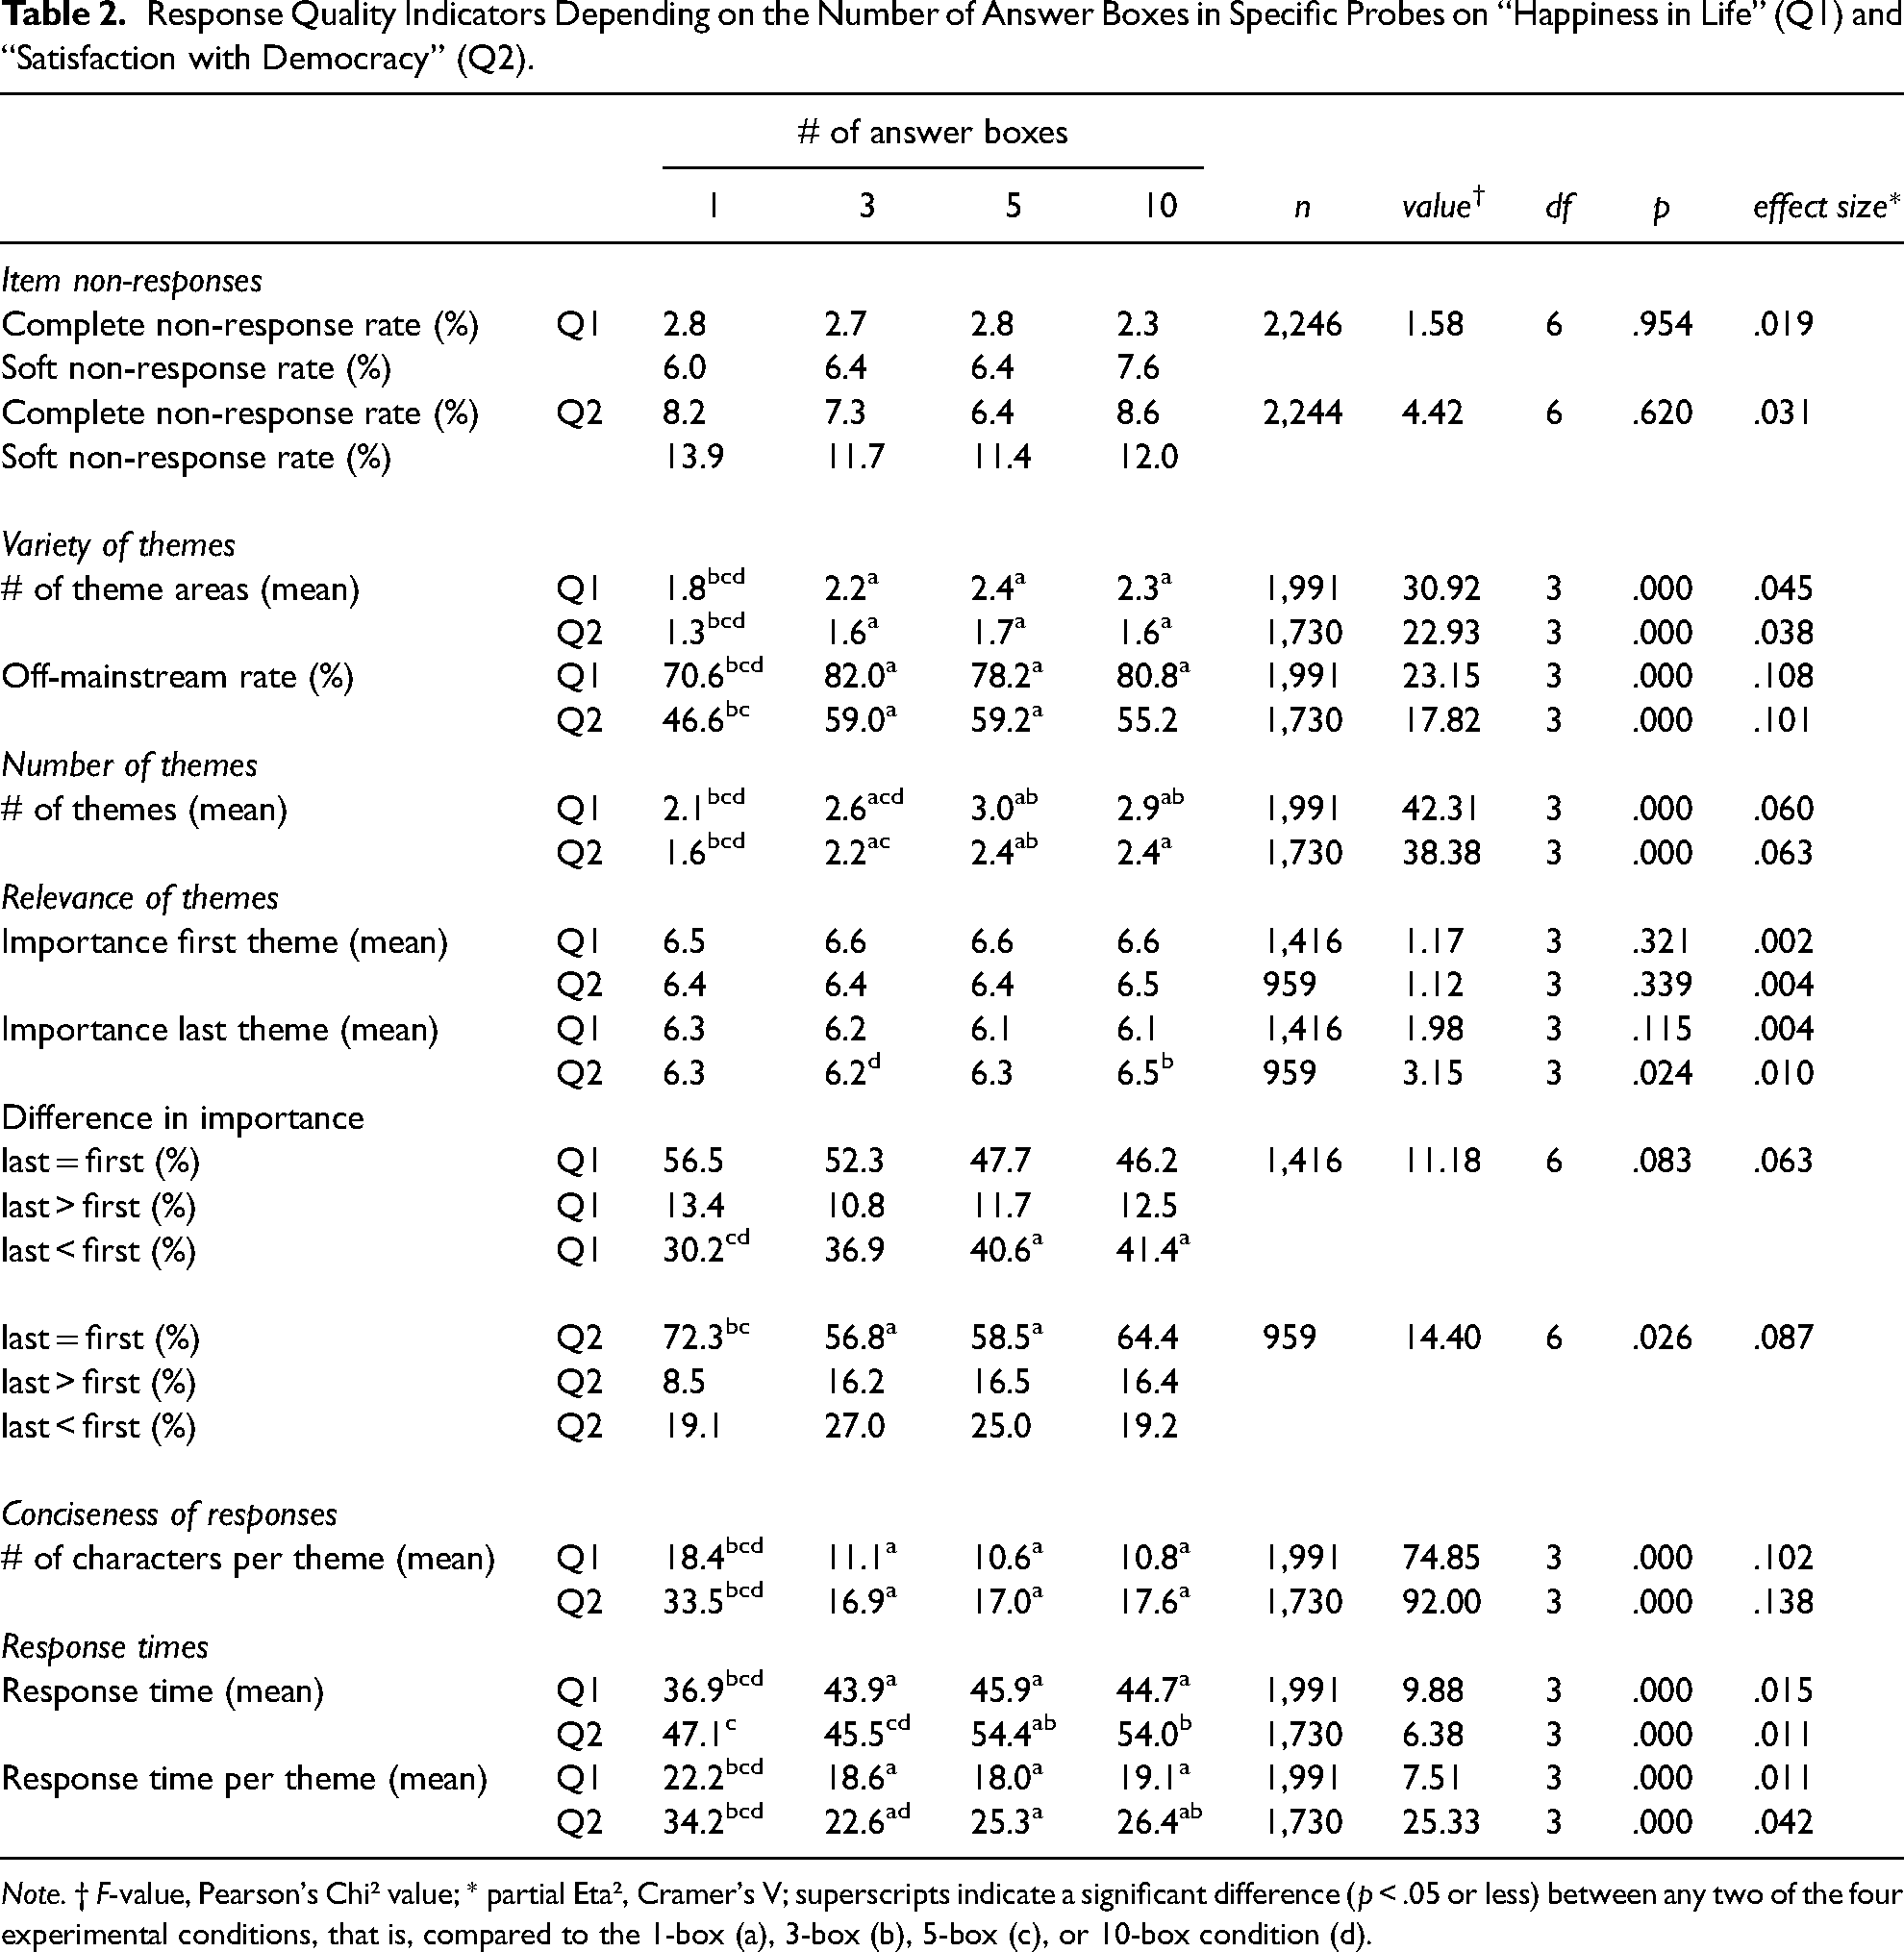
Note. † F-value, Pearson's Chi² value; * partial Eta², Cramer's V; superscripts indicate a significant difference (p < .05 or less) between any two of the four experimental conditions, that is, compared to the 1-box (a), 3-box (b), 5-box (c), or 10-box condition (d).
Results
We present the results of our experimental study in the order in which the various indicators relate to the stages of the cognitive response process. Table 2 summarizes all findings.
Item non-responses. For both experimental questions, item non-response was mainly due to soft non-response. Notably, in Q1, the number of complete non-responses was particularly low (i.e., less than 3% in all experimental conditions). Regarding both types of item non-response, complete and soft non-response, we found no significant differences in Q1 and Q2 by experimental version. Thus, a higher number of answer boxes did not increase item non-response (H1 not confirmed).
Variety of themes. Respondents receiving multiple small answer boxes mentioned significantly more theme areas than respondents receiving one large answer box. In a similar vein, respondents provided with multiple small answer boxes showed significantly higher off-mainstream rates indicating a higher proportion of respondents who mentioned theme areas other than the two most common ones than respondents with one large answer box. However, regarding both indicators, we did not find any significant differences between the three experimental groups. Thus, contrary to our hypothesis, there was no linear increase in the variety of themes with the higher number of answer boxes (H2 not confirmed).
Number of themes. The number of answer boxes had a significant effect on the mean number of themes mentioned. Respondents who received a large answer box reported the fewest themes, while respondents in the 5-box and 10-box conditions named the most. In accordance with our hypothesis, a higher number of answer boxes yielded a higher number of themes (H3 confirmed).
Relevance of themes. We found no significant differences in the respondents’ mean importance ratings between our experimental conditions for the first theme in Q1 and Q2, nor for the last in Q1. Although in Q2, the importance rating in the 3-box condition was slightly but significantly lower than in the 10-box condition, importance ratings were high in both conditions. Similarly, we largely found no differences in the respondents’ tendency to rate the first and last theme differently depending on the number of answer boxes. Based on the two indicators for the relevance of themes, we found no evidence that a higher number of answer boxes reduced the relevance of the themes mentioned (H4 not confirmed).
Conciseness of responses. We found an overall effect of the number of answer boxes on the conciseness of responses. Respondents wrote fewer characters per theme if they received multiple small answer boxes compared to one large answer box. Again, we found no significant differences in the number of characters written per theme between the three experimental groups. Thus, contrary to our hypothesis, there was no linear increase in the conciseness of responses with a higher number of answer boxes (H5 not confirmed).
Response times. We found an overall significant effect on mean response times, as respondents spent more time answering several small answer boxes than one large answer box in Q1. Regarding differences between the experimental groups, we found significantly higher mean response times in the 5-box and 10-box conditions compared to the 3-box condition in Q2, but no significant differences between the experimental groups in Q1. Hence, the results are mixed regarding our hypothesis that a higher number of answer boxes leads to longer response times (H6 partly confirmed).
When dividing the mean response times by the number of themes mentioned, we found that respondents spent significantly less time per theme if they received several small answer boxes compared to one large answer box. We found no significant differences between the different experimental groups, except for lower mean response times per theme in the 3-box condition compared to the 10-box condition in Q2. Therefore, longer overall response times in the experimental groups compared to the control group can be explained by the fact that respondents mentioned more themes when they answered a specific probe with several answer boxes compared to one large answer box.
Discussion and Conclusions
In the present study, we assessed the effect of varying numbers of answer boxes on the quality of responses to specific probes presented in a list-style open-ended question format. In line with our expectations, we found that providing several small answer boxes yielded a higher number of mentioned themes. This finding is consistent with previous studies on list-style open-ended questions (Fuchs 2013; Hofelich Mohr, Sell and Lindsay 2016; Keusch 2014; Smyth, Dillman and Christian 2007). Although several small answer boxes instead of one large answer box increased the variety of themes and the conciseness of the responses, increases were not linear with the number of answer boxes, contrary to our predictions. And, although our expectation proved unfounded, it was good news that a higher number of answer boxes did not affect item non-response. Thus, the anticipated effort does not appear to be higher when specific probes are presented with multiple answer boxes. We also did not find significant differences regarding the relevance of the themes mentioned. As expected, answering specific probes requires more effort when several small answer boxes are provided. This was reflected in higher response times. However, the longer response times seem justified given the higher number of themes mentioned when multiple small answer boxes are provided.
The results of our study have important consequences for the field of cognitive interviewing and pre-testing. Earlier web probing studies used one answer box per probe question (Behr et al. 2017). Our results show that providing multiple small answer boxes instead of one large answer box can increase the quality of responses to specific probes. Looking at the different stages of the cognitive response process and how they are related to the different indicators of response quality as proposed in our theoretical model, we conclude based on our findings that the stages of comprehending a specific probe, recalling the themes included in the answer to the previous closed question, and writing them into the answer boxes are affected by the decision whether to provide one large or several small answer boxes. In contrast, judgments about which themes are sufficiently relevant to be mentioned seem to be unaffected by the visual design of answer boxes. Our findings highlight the impact of visual design on cognitive response processes in web surveys. Studies developing new visual design formats should relate their indicators of response quality to the different stages of the cognitive response process. By uncovering the underlying cognitive processes, we can design questionnaires that proactively address the respondents’ cognitive challenges and improve response quality.
We were surprised to find hardly any differences in response quality between our multiple answer box conditions. We found differences only in the number of themes mentioned and the time spent responding. However, these results do not allow us to draw conclusions about the optimal number of answer boxes. It seems to be more critical for specific probes to use a list-style open-ended question format with several small answer boxes than to ask how many small answer boxes should be provided. The lack of difference between our multiple answer box conditions could also be due to the specific type of question tested in our study. Specific probes ask respondents to enumerate all themes they had in mind when responding to the previous closed question. Ideally, respondents will have used only relevant information to answer the closed question so that they can also mention only relevant themes when answering the specific probe question. Moreover, it can be assumed that respondents had only a limited number of themes in mind when answering a previous closed question, thus creating a ceiling effect for possible themes that respondents can mention in the specific probe question. And given this limited number of themes, the influence of the visual design on response quality might also be limited. This may be different for general attitude questions in list-style open-ended question formats (e.g., “What is the biggest problem facing the country today?”). These types of questions allow respondents to think about an unlimited number of aspects that could lead to a more significant impact of the number of answer boxes on respondents’ answers to list-style open-ended questions.
This study focused on specific probes; nevertheless, our findings provide an essential contribution to assessing response quality in (list-style) open-ended questions in general. Our research has shown the added value of matching the indicators of response quality to the different stages of the cognitive response process. Moreover, we extended the list of previously used indicators for response quality in open-ended questions (i.e., the average number of themes, response elaboration, response time, and item non-response) to include the following measures or indicators: the mean number of theme areas and the off-mainstream rate as measures of the variety of themes, the relevance of themes, the number of characters per theme as a measure of the conciseness of responses, and the response time per theme to account for the effort required to provide a comprehensive response. The set of indicators used in this study provided a more comprehensive understanding of response quality in specific probes and new insights into cognitive processes in list-style open-ended question formats in general. Nevertheless, some of the new and established indicators still need to be improved. For example, the relevance of themes did not reveal as much variance in responses as expected. Respondents seem to always attach great importance to the themes listed. Therefore, it is advisable to find an alternative way to measure the relevance of issues, for example, by asking paired comparison questions (i.e., “Which of the two aspects do you consider more important?”) or even without relying on respondents’ self-reports.
In addition, we considered item non-response and response time as “global” measures that cannot be unambiguously assigned to a specific stage of the cognitive response process. Both indicators are established measures of response quality, but the challenge of ambiguous interpretation remains. Item non-response is typically interpreted as the respondents’ (un)willingness to respond; however, it could also be the result of an (in)ability to respond (Beatty and Herrmann 2002; Scholz and Zuell 2012). Based on our coding scheme, we were able to distinguish between different types of item non-response. We saw that complete non-response (i.e., leaving the answer box blank) accounts for the smaller proportion; more often, it is soft non-response (e.g., “I have no idea,” “it depends,” “dfngx,”), which means something is written in the answer box, but no substantive information that can be meaningfully interpreted and coded. However, we found no evidence that the visual design of specific probes differentially influenced respondents’ willingness or ability to provide substantive responses. Nevertheless, when coding (list-style) open-ended questions, we recommend distinguishing between different types of item non-response to identify potentially different mechanisms of non-substantive answers. Similarly, response times can be interpreted differently; they can indicate the extent of respondents’ effort (i.e., optimizing vs. satisficing), but they can also indicate respondents’ problems in responding (Olson and Parkhurst 2013). By relating the response time to the number of themes mentioned, we can conclude that the additional time required depending on the visual design is due to optimal response behavior and not due to response problems. This is an excellent example of how response time measures can best be interpreted in combination with other indicators of response quality.
Limitations and Future Research
Several limitations need to be acknowledged and gaps remain for future research. This study was based on a sample of a non-probability-based online panel. The advantages of such panels are their accessibility and relatively low cost. For this reason, such convenient opt-in samples are usually used for pre-testing work involving web probing (Behr et al. 2017). However, it should be noted that commercial panel respondents are accustomed to answering surveys and are considered particularly well-disposed towards surveys and highly motivated to participate (Baker et al. 2013). As we know from previous research, the influence of visual design features on respondents’ answers can vary depending on how interested and involved respondents are in the survey (e.g., Holland and Christian 2009; Roßmann, Gummer and Silber 2017). Thus, it is conceivable that using multiple answer boxes may affect the cognitive response processes differently, depending on the respondents’ motivation and engagement. To investigate the generalizability of our results, we recommend replicating our experimental design using a more general sample with presumably less motivated or engaged respondents.
In our study, respondents could freely decide on the device used to complete the survey. We know from previous research that response quality to open-ended questions can differ depending on the device chosen. Smartphone respondents are likely to provide shorter responses to open-ended questions compared to respondents using their desktop computers or laptops and usually take longer to type their answers (e.g., Lugtig and Toepoel 2016; Mavletova 2013; Revilla and Ochoa 2016; Struminskaya, Weyandt and Bosnjak 2015). However, in additional analyses 2 , we found no indication that response quality to specific probes differs between desktop and smartphone respondents, with the exception that respondents using their smartphone took more time over their responses. Furthermore, there was no evidence that differential effects of the visual design of specific probes depended on the device type. However, the sample size of smartphone users was small and we did not have a random assignment to the device types, so possible interaction effects should be tested in a further, preferably experimental study.
In our experimental groups, the respondents received multiple answer boxes along with an instruction and placeholder text, both of which were intended to clarify the expected response format (i.e., one aspect per answer box). It may be that our visual design clarified the response task more within this context than would have been the case without these additional elements (e.g., Metzler, Kunz and Fuchs 2015; Smyth et al. 2009). Since all experimental groups received the same visual design, we could not draw any conclusions about the potential of such instructions and placeholder texts to promote the desired response format. However, we consider it promising to systematically test this in a further experiment with specific probes and, more generally, with list-style open-ended questions.
In this paper, we proposed a theoretical model of how different mechanisms triggered by multiple answer boxes may affect response quality at different stages of the cognitive response process. For this purpose, we attributed different indicators of response quality to different stages of the cognitive response process. Admittedly, it was a highly simplified model that may not capture sufficiently the complexity of the relationship between visual design, cognition, and response quality. And, based on our data, we could not test whether the assumed cognitive mechanisms actually caused respective differences in response quality. Our goal was to advance the discussion of how the processing of visual designs in web surveys is related to the different stages of the cognitive response process and better understand what mechanisms drive improvements in response quality to make more targeted adjustments to questionnaire design. This study is a first step toward developing a comprehensive theoretical framework, though the mechanisms underlying each finding have not yet been fully fleshed out. Future research needs to further elaborate the complexity of this theoretical framework.
Supplemental Material
sj-docx-1-smr-10.1177_00491241221077241 - Supplemental material for Visual Design and Cognition in List-Style Open-Ended Questions in Web Probing
Supplemental material, sj-docx-1-smr-10.1177_00491241221077241 for Visual Design and Cognition in List-Style Open-Ended Questions in Web Probing by Katharina Meitinger and Tanja Kunz in Sociological Methods & Research
Footnotes
Authors’ Note
Declaration of Conflicting Interests
The author(s) declared no potential conflicts of interest with respect to the research, authorship, and/or publication of this article.
Supplemental Material
Supplemental material for this article is available online.
Notes
Author Biographies
References
Supplementary Material
Please find the following supplemental material available below.
For Open Access articles published under a Creative Commons License, all supplemental material carries the same license as the article it is associated with.
For non-Open Access articles published, all supplemental material carries a non-exclusive license, and permission requests for re-use of supplemental material or any part of supplemental material shall be sent directly to the copyright owner as specified in the copyright notice associated with the article.