
Abstract
Multistate models are often used in social research to analyze how individuals move between states. A typical application is the estimation of the lifetime spent in a certain state, like the lifetime spent in employment, or the lifetime spent in good health. Unfortunately, the estimation of such quantities is prone to several biases. In this paper, we study the bias due to the often implicitly used assumption that there are no unobserved transitions between states. This assumption does often not hold for the panel data typically used to estimate multistate models, as the states occupied by individuals are only known at specific points in time, and further transitions between panel waves are not recorded. We present partially identified estimates of the lifetime spent in a state, or worse-case bounds, which show the maximum possible level of bias due to unobserved transitions. We provide two examples studying the lifetime spent in disability (disabled life expectancy; DLE). The first example applies our methods to results on cohort trends in DLE in the U.S. taken from Crimmins et al. (2009). In the second example, we replicate findings from Mehta and Myrskylä (2017), and apply our methods to data from the U.S. Health and Retirement Study (HRS) in order to estimate the effects of health behaviors on DLE.
Keywords
Introduction
Multistate models are often used in quantitative social research to analyze how individuals move between different states (Piccaretta and Studer 2019). Based on longitudinal data, the rates or the probabilities of transitioning between states are estimated and used to calculate quantities such as the expected lifetime spent in a specific state. Applications of multistate models include transitions between labor force states (Harris, Zhao, and Zuccheli 2021; Hayward and Lichter 1998; Lorenti et al. 2020), change of family status (Bonetti, Piccaretta, and Salford 2013; Schoen, Landale, and Daniels 2007; Studer, Struffolino, and Fasang 2018), poverty dynamics (Bernstein et al. 2018; Hale, Dudel, and Lorenti 2021), and migration (Klabunde et al. 2017; Raymer, Willekens, and Rogers 2019; Vega and Brazil 2015).
The estimation of multistate models using longitudinal data is prone to several biases. Among the sources of bias that have attracted considerable interest in parts of the literature are unobserved transitions (Hardy et al. 2005; Wolf and Gill 2009). Unobserved transitions are attributable to study design and are a property of the data used to estimate multistate models. They occur when the states that individuals occupy are recorded at fixed time intervals such as every 24 months. Because the transitions that take place during the period between observations are not recorded, some transitions might be missed.
This article describes a procedure that allows us to assess the potential bias in estimates of the lifetime spent in a state caused by unobserved transitions. Based on minimal assumptions, the method yields identification bounds, in the sense of Pearl (2015) and Manski (1993) that can be interpreted as worst-case bounds for bias. Identification bounds, or set estimates, mean that the result of the estimation procedure is not a single, specific value but an interval. Identification bounds essentially show the information that can be gleaned about the lifetime spent in a state from the data without making strong assumptions. The identification bounds we present are sharp. Tighter identification bounds can be achieved if the researcher has additional information, which can sometimes be derived from the data, or if the researcher is willing to commit to stronger assumptions.
Rather than casting the exposition in general terms, we concentrate on a particular application, life expectancy with disability (or disabled life expectancy [DLE]) and disability-free life expectancy (DFLE), as a means to develop and illustrate ideas. This will keep the discussion focused and facilitate notation. Both DLE and DFLE are important indicators of population health (Nusselder and Peeters 2006; Stiefel, Perla, and Zell 2010), especially in aging populations, among whom disability is a growing health concern. For this reason, DLE and DFLE have been extensively studied in social science and health research. Among the topics that have recently been addressed in the literature are differences in DLE by gender, ethnicity/race, and education (Crimmins and Saito 2001; Solé-Auró, Beltrán-Sánchez, and Crimmins 2015); other socioeconomic determinants (Chiu 2019; Magnusson Hanson et al. 2018; Zimmer et al. 2020); changes in DLE and DFLE as a measure of the compression of morbidity (Cai and Lubitz 2007); and the effects of health behaviors like smoking and drinking on DLE (Mehta and Myrskylä 2017). Measures similar to DLE, such as the lifetime spent with or without a certain disease or ailment, have also received considerable attention (e.g., Zimmer and Rubin 2016).
For DLE, unobserved transitions are especially problematic if they happen shortly before death (Agree and Wolf 2017; Gill et al. 2005; van den Hout and Matthews 2009; Wolf and Gill 2009; Yi, Danan, and Land 2004). Most unobserved transitions before death are from nondisabled to disabled (and then to death), as an individual’s health often deteriorates immediately prior to death, and the likelihood that the person will recover from disability shortly before death is low (Yi et al. 2004). Because a portion of the lifetime spent being disabled is therefore missed, DLE tends to be biased downward. Simulation studies have been conducted to assess the potential bias caused by unobserved transitions before death (Wolf and Gill 2009), and a correction procedure was proposed by Yi et al. (2004). The results of these efforts underline that the bias due to unobserved transitions is a cause for concern and might threaten the validity of DLE estimates. Unobserved transitions from being disabled to being nondisabled, and vice versa, that do not happen before death likely cancel each other out over a lifetime and are thus considered to be less problematic (Gill et al. 2005; Wolf and Gill 2009).
To illustrate our method, we present two examples. The first example takes estimates of DLE and DFLE published by Crimmins et al. (2009). We show that the conclusion of the original study—across cohorts, DLE did not increase but DFLE expectancy did—requires implicit assumptions. The second example is based on the U.S. HRS from 1992 to 2014, replicating and expanding on the results of Mehta and Myrskylä (2017). We calculate the DLE of groups with different health behaviors and show that the differentials in DLE found between these groups are relatively robust to bias. We also demonstrate how identification bounds can be narrowed using empirical data. For this example, the Stata code can be downloaded online from the Open Science Framework via https://osf.io/y8qz6/. In addition, we outline an additional example in the final section of the article showing how our method can be applied to topics other than DLE. This additional example uses results of a multistate model of labor market transitions taken from Lorenti et al. (2020).
Bounds on Bias Due to Unobserved Final Transitions
Notation and Setup
We consider a multistate model of disability as shown in Figure 1. Individuals can be nondisabled and disabled. They can stay in the state they occupy, or they can transition to the other state; i.e, nondisabled individuals can become disabled, and disabled individuals can recover. The model also includes the absorbing state dead. Applications of multistate models with a similar structure include transitions between the two states “in the labor force” and “out of the labor force” (e.g., Skoog and Ciecka 2010) or migration between two countries (e.g., Vega and Brazil 2015). Transitions between states can be described using transition probabilities or rates, which are estimated from longitudinal data. While not explicitly shown in Figure 1, the transition probabilities or rates can depend on age and other variables.
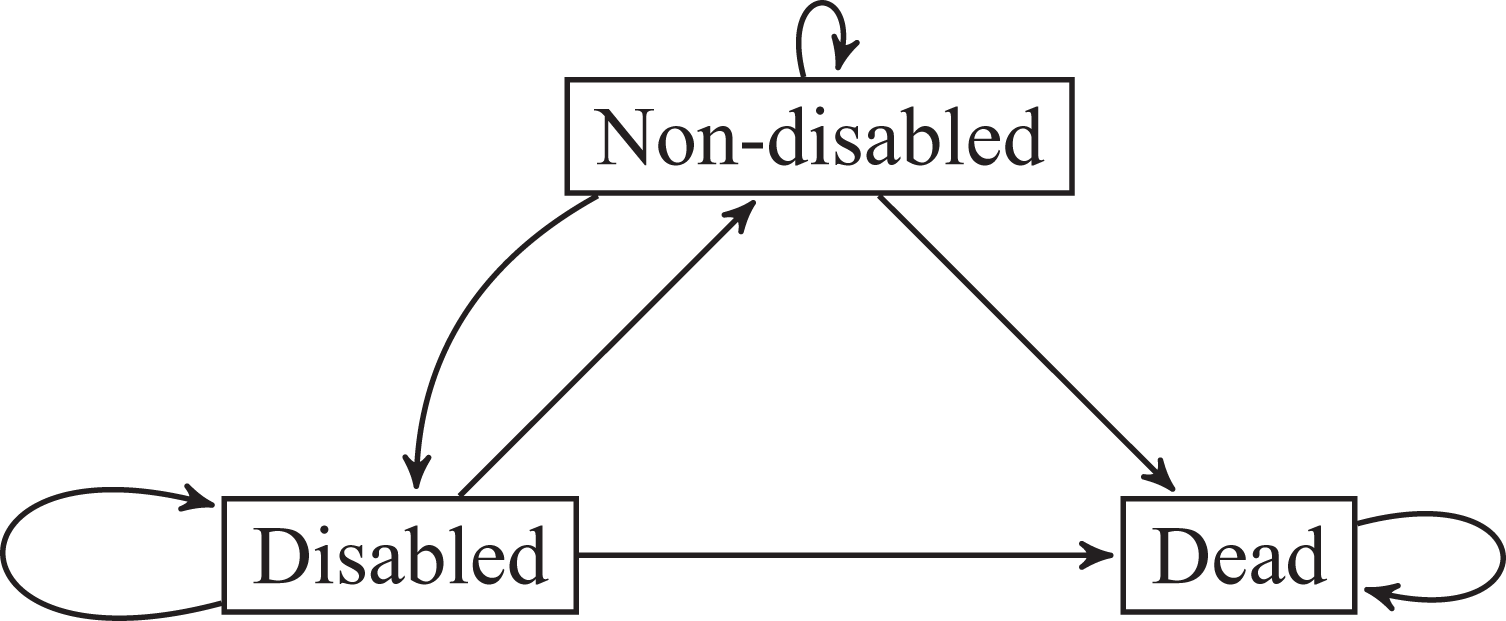
State space and possible transitions of the multistate model of disability.
The longitudinal data used for estimating the multistate model are collected every
For each individual in the data, St captures the state the individual is in at the beginning of the interval
We assume that the multistate model and its transition probabilities are estimated correctly. That is, we assume that transition probabilities
Decomposing DLE
Let U denote a variable capturing the lifetime individuals spent in the disabled state, and let H denote a variable capturing the lifetime individuals spent in the disability-free state. For DLE, we write
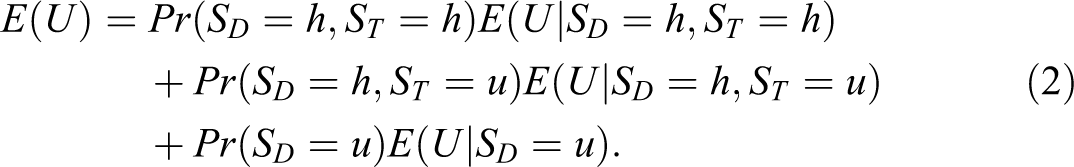
To show how transitions before death are usually ignored, and what degree of bias this implies, we decompose DLE in two steps. In the first step, DLE can be decomposed in the following way:

where h stands for the nondisabled state and u represents the disabled state. That is, DLE is decomposed into the DLE of the individuals who were last observed to be nondisabled,
DLE can be further decomposed by introducing unobserved transitions between states, after being in state SD, and before death. For the sake of simplicity, we assume that between the last observed state SD and death, no recovery from disability is possible. That is, there might be unobserved transitions before death from being nondisabled to being disabled but not the other way round; this assumption is not necessarily required, and we discuss how to remove it below in Removing Further Assumptions section. Let ST capture the state a transition happens to from SD. If for an individual
Thus, the first term on the right-hand side of equation (1) is further decomposed into the DLE of individuals who were observed to be nondisabled before death and who stayed in this state until death,
Sharp Bounds on Bias
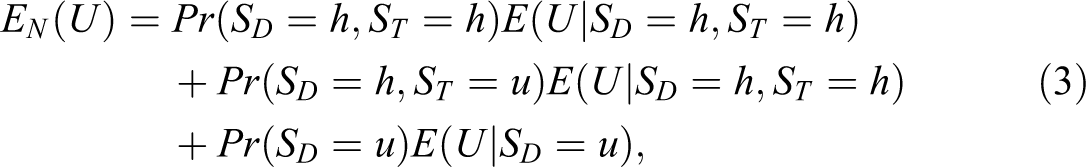
As ST is not observed, the individual parts of equation (2) cannot be estimated. For this reason, it is (often implicitly) assumed in the literature that no transitions happen shortly before death, i.e.,
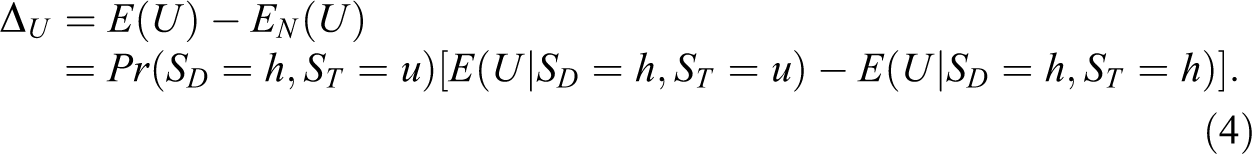
The bias of such models is given by the difference between (2) and (3),
Writing

Worst-case bounds for the bias in DLE,
Bounds on Disabled and Non-DLE
Let
Tightening the Bounds Using Additional Information and Assumptions
The worst-case bounds presented above can be narrowed by introducing additional assumptions and by using empirical data. Whether the assumptions are appropriate will differ from case to case.
Often, the estimates of DLE and DFLE are based on the assumption that transitions occur, on average, at mid-interval or, formally,
Without making additional assumptions, the bounds for the probability that individuals who were nondisabled at the last observation and became disabled before dying,
A simple argument for deriving tighter bounds on

where w represents the state “dead”; if we assume that the probability of dying can be no bigger than the probability of becoming disabled, then
Applications
Trends in DLE and DFLE in the Longitudinal Studies of Aging (LSOA)
As a first example, we consider the identification bounds of the results presented by Crimmins et al. (2009). The authors studied the remaining DLE at age 70 and the DFLE at age 70 in the United States. DLE and DFLE were calculated for and compared across two cohorts using multistate life tables and data from the LSOA I and II, which were supplements to the National Health Interview Survey. Comparing the two cohorts, Crimmins et al. (2009) found that DLE remained rather stable, while DFLE increased for the younger cohort (LSOA II) by about
LSOA I was conducted in the years 1984, 1986, and 1988 and supplied data for the first cohort while LSOA II was conducted in 1994, 1996–1997, and 1999–2000 and supplied data for the second cohort. DLE and DFLE were defined as life expectancy with or without limitations in activities of daily living (ADL disability; includes difficulties in bathing, dressing, eating, getting in/out of a bed or chair, and toileting), and/or limitations in instrumental ADL (instrumental ADL disability: preparing meals, shopping for groceries, managing money, using the telephone, and doing light housework).
The point estimates of DLE and DFLE reported by Crimmins et al. (2009) are shown in the first lines of Figure 2 (DLE) and Figure 3 (DFLE). The results for LSOA I are shown in orange, and the results for LSOA II are shown in green. These point estimates are based on the assumption that there are no unobserved transitions from nondisabled to disabled.
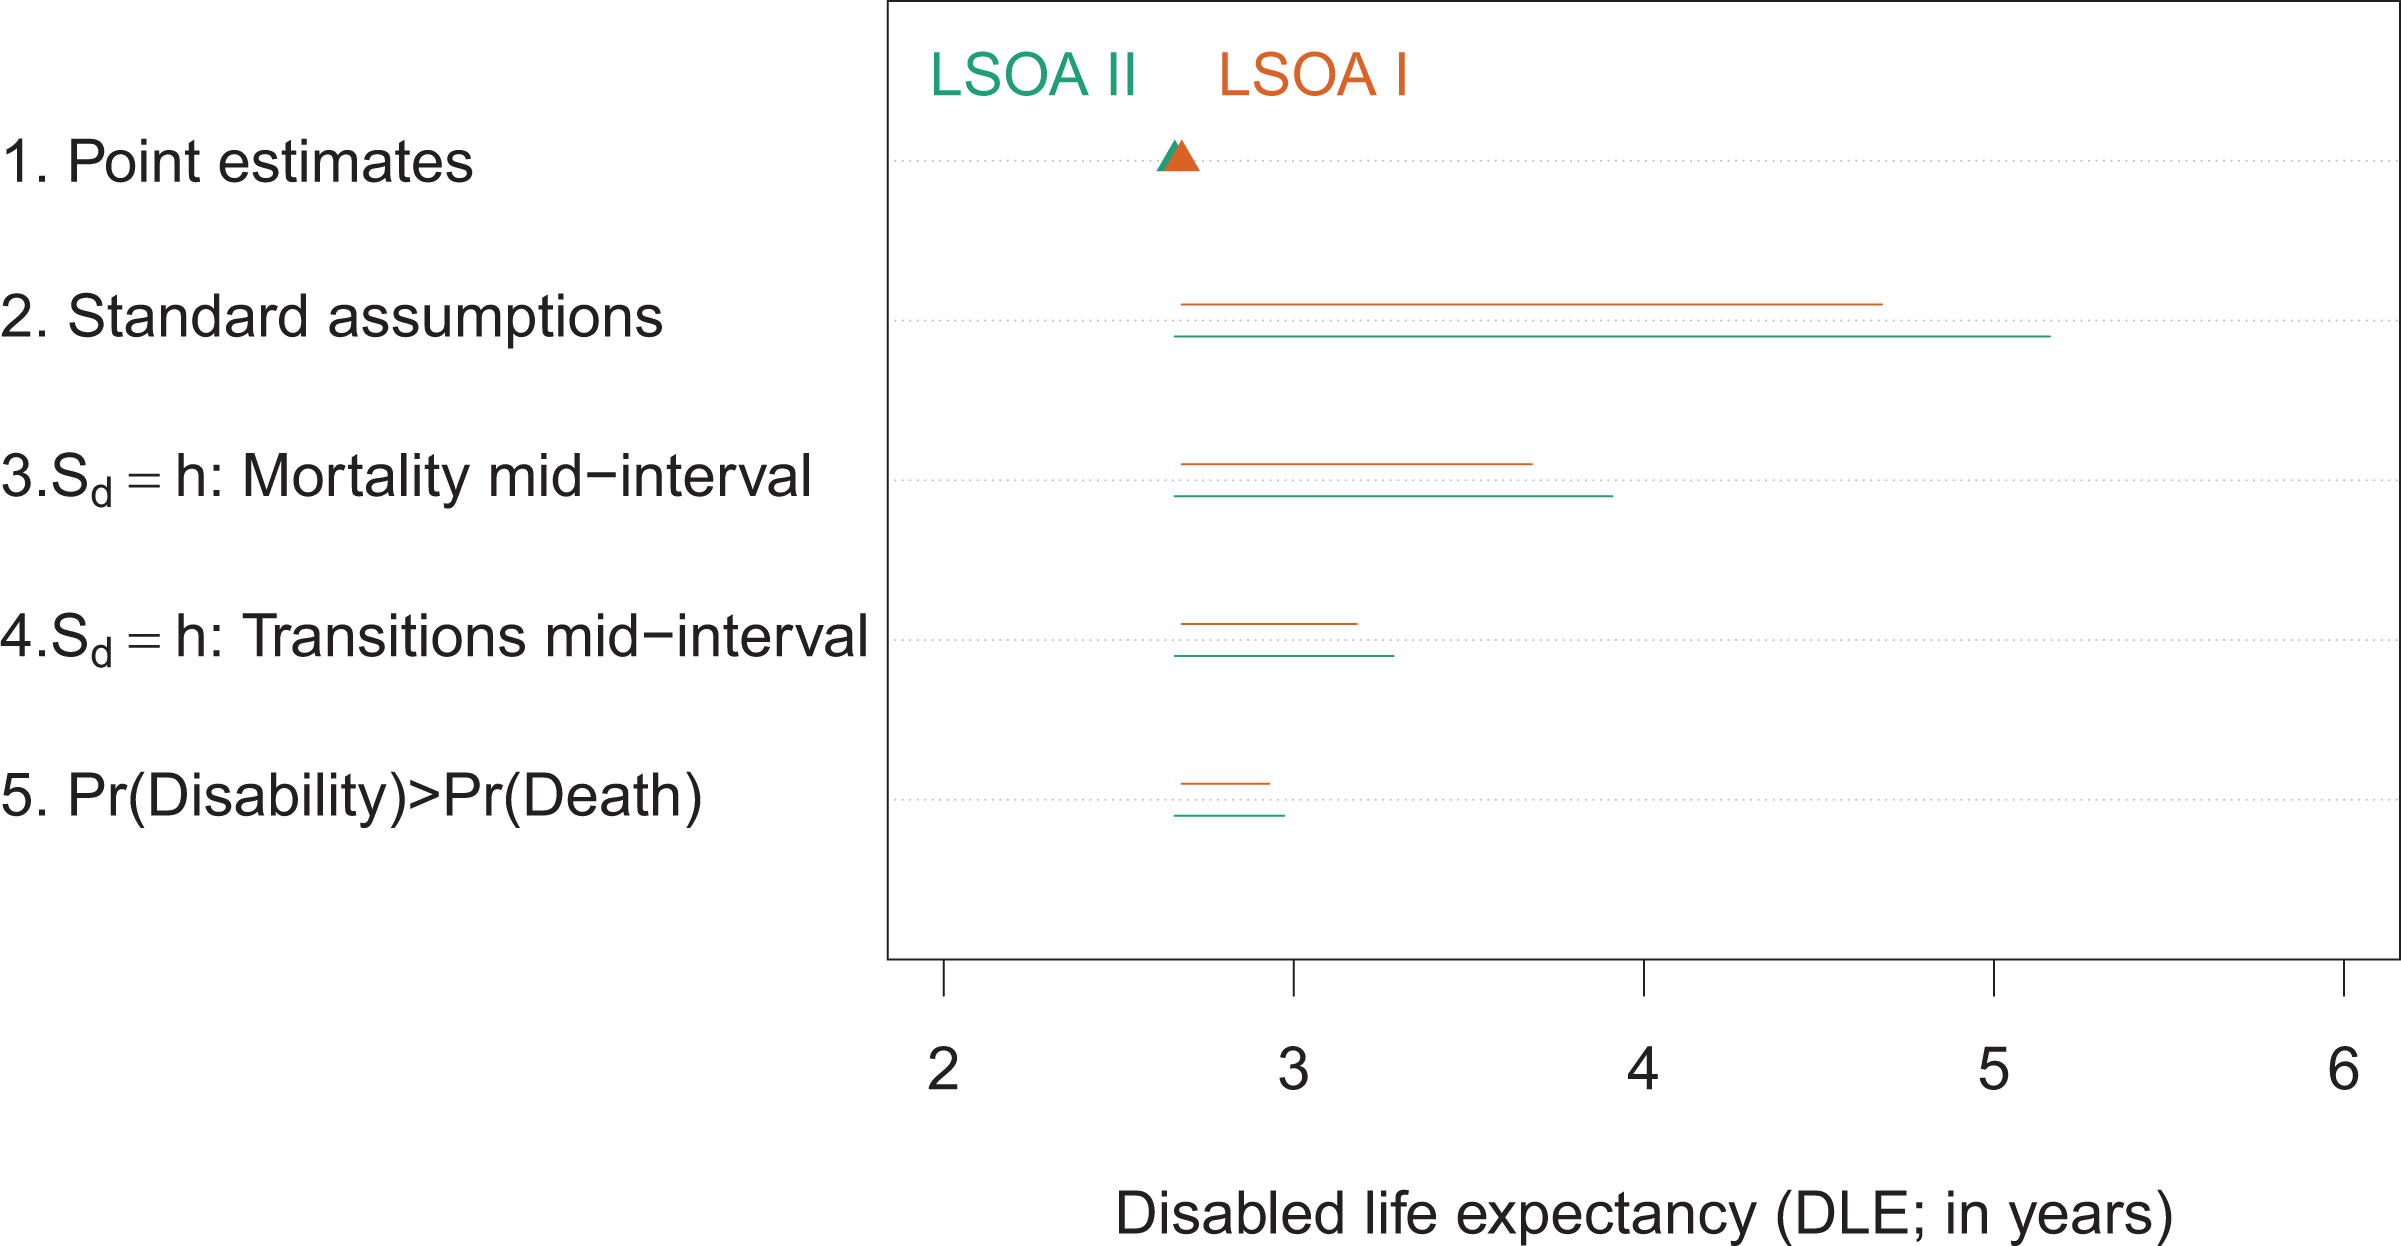
Point estimates and identification bounds of disabled life expectancy based on Crimmins et al. (2009). Point estimates are in the first line of the figure; the following lines show the identification bounds arising from different sets of assumptions, using
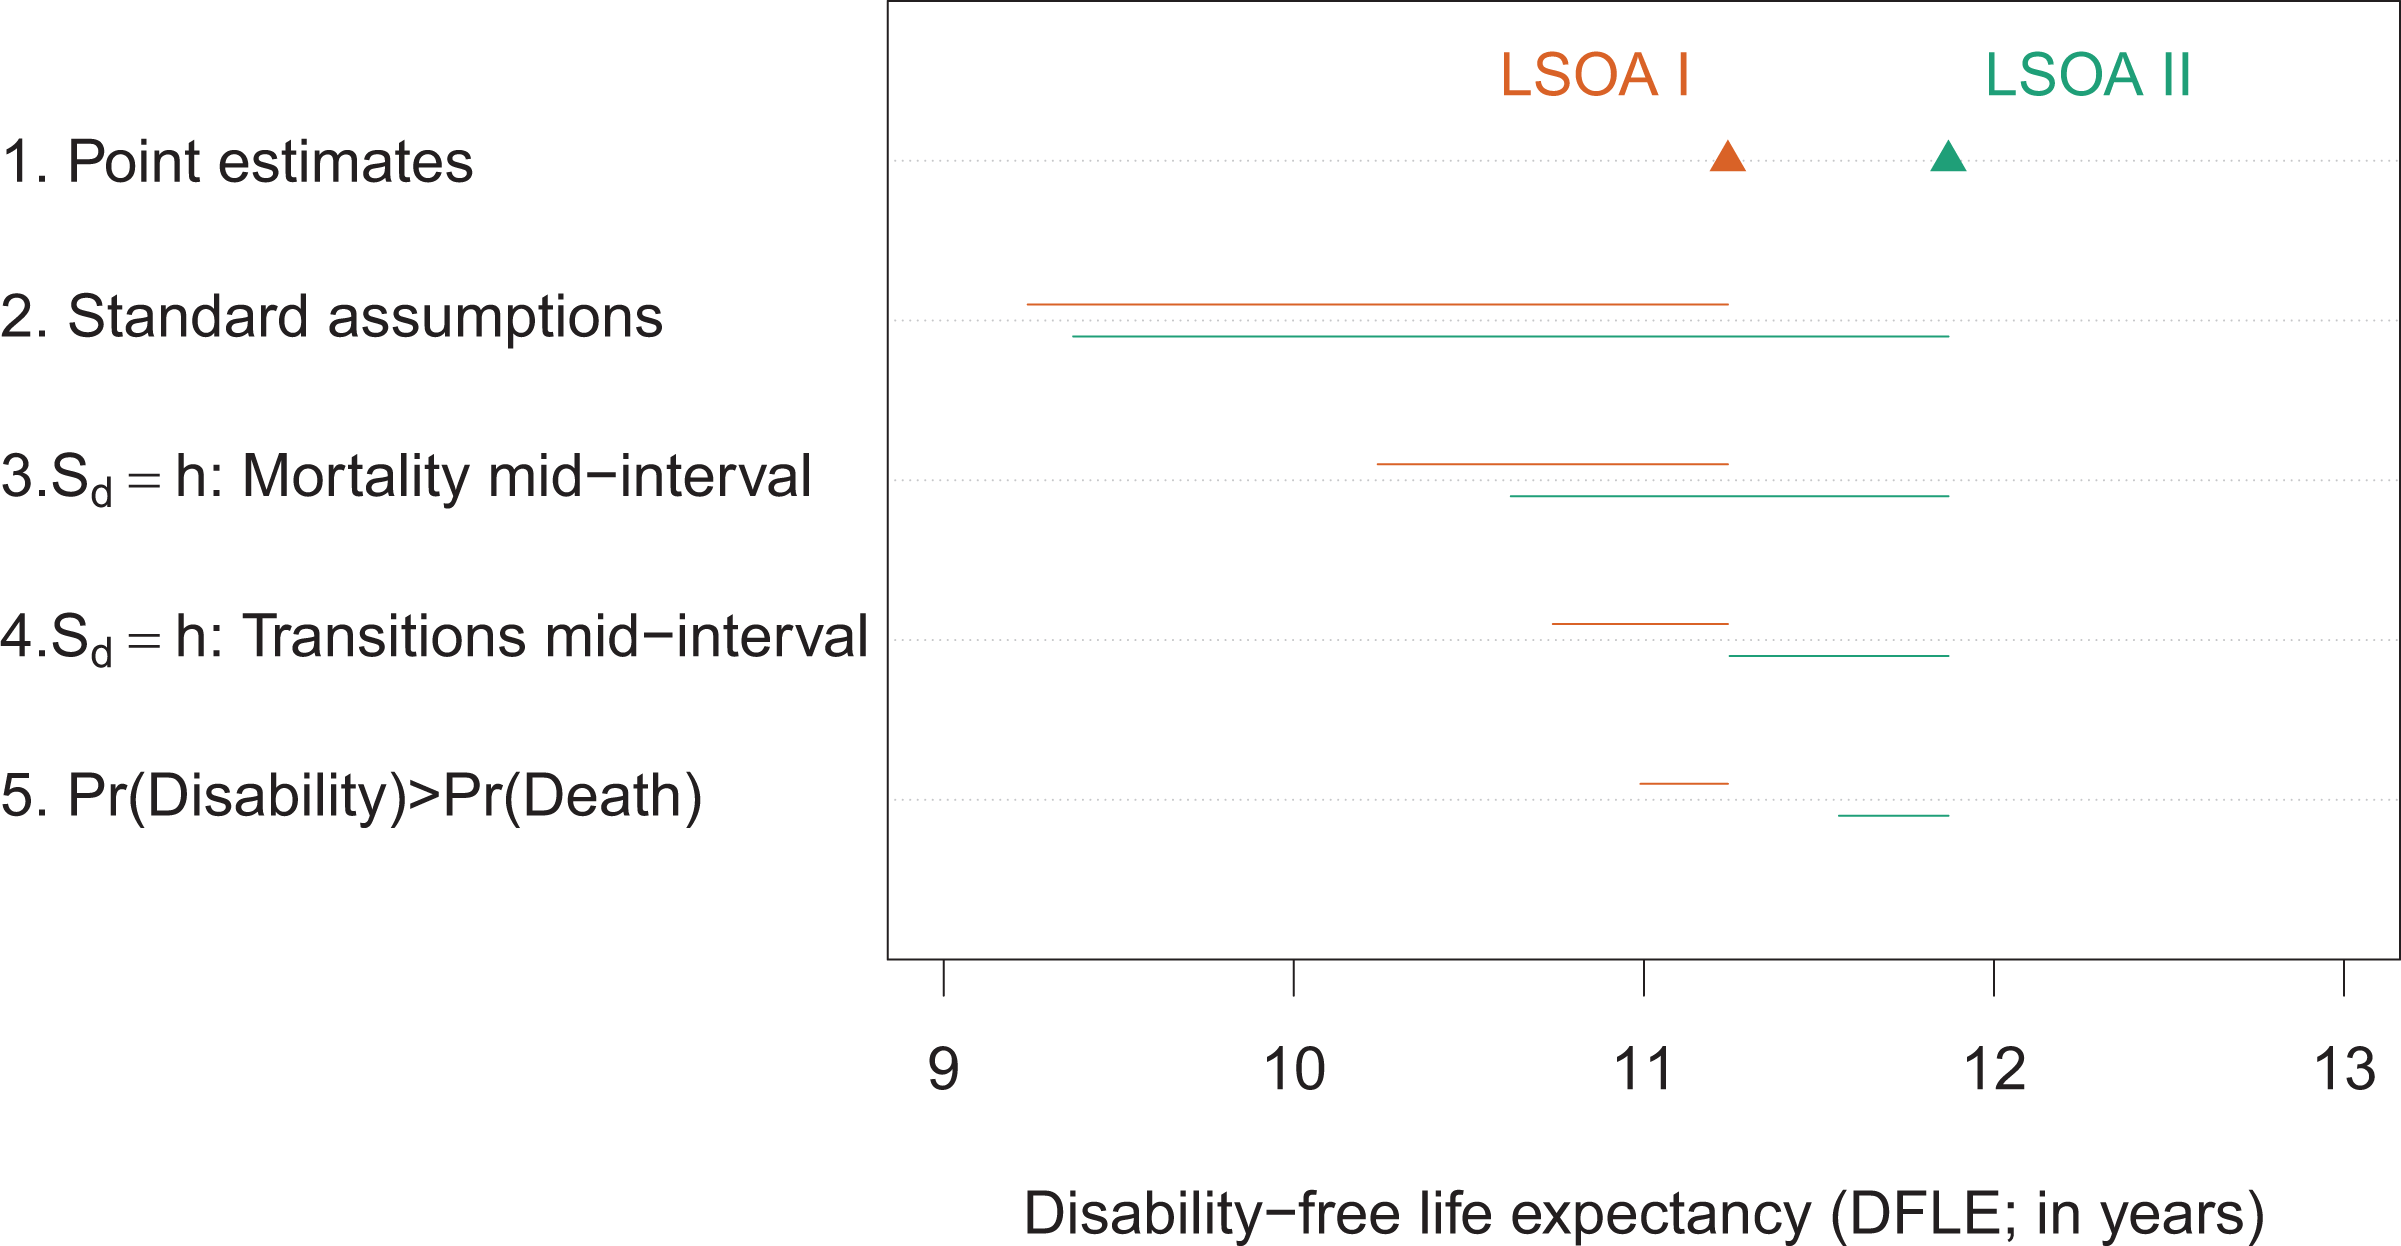
Point estimates and identification bounds of disability-free life expectancy based on Crimmins et al. (2009). Point estimates are in the first line of the figure; the following lines show the identification bounds bias from different sets of assumptions, using
Applying the reasoning laid out in the previous section, lines two to five of Figure 2 and Figure 3 show the identification bounds for DLE and DFLE using different assumptions. The second line in the figures shows the bounds resulting from using
The more restrictive the assumptions are, the narrower the identification regions become. For DLE, the identification regions for LSOA I and LSOA II always overlap, regardless of the assumptions made. In this context, “overlap” means that one or both of the endpoints of one identification region are between the endpoints of the other region. This generally implies that, given the assumptions used, it cannot be ruled out that the estimates have the same values. In this specific application, it means that LSOA I and LSOA II might have the same levels of DLE. If instead of DLE, the proportion of remaining life expectancy in disability is studied—i.e., DLE divided by life expectancy—similar findings emerge: For LSOA I, the bounds for the proportion of lifetime spent in disability is between
The point estimates for DFLE are further apart. Nevertheless, as line 2 in Figure 3 shows, when standard assumptions are applied, the identification regions of LSOA I and II overlap. Introducing mid-interval mortality conditional on
The identification intervals presented in Figure 2 and Figure 3 are conditional on the sample. That is, the bounds show whether the samples are compatible with the statement that participants of LSOA I and LSOA II have the same DLE or DFLE. The uncertainty expressed in the intervals is solely due to (potential) unobserved transitions. Measuring uncertainty due to sampling variance—i.e. statistical inference—can follow in a second step. If the identification intervals overlap, and it is not possible to determine whether there are differences between the two samples, then detecting differences in the population will not be possible either. How statistical inference can be conducted for identification intervals is discussed in the next subsection.
DLE and Health Behaviors in the HRS
As a second example, we reestimate a subset of the results of Mehta and Myrskylä (2017). The Stata code is available online. Using data from the HRS, these authors studied differentials in DLE at age 50 and in DFLE at age 50 by health behaviors. Among other results, they found that individuals with advantageous health behaviors—i.e., individuals who never smoked and who were not obese—had a considerably higher DFLE than individuals with an average behavioral profile and than individuals who were engaging in adverse behaviors. While the observed differences in DLE between the advantageous behavior group and the average behavior group were small, adverse behaviors were found to be associated with increased DLE.
Our data source is the HRS. The HRS is a panel survey of U.S. residents aged 50 and older that covers a wide range of socioeconomic and health indicators. It is conducted by the Survey Research Center of the Institute for Social Research of the University of Michigan and is supported by the National Institute on Aging and the Social Security Administration. For an overview of the data, see Juster and Suzman (1995). Respondents are surveyed biannually (
We consider health behaviors that fit what Mehta and Myrskylä (2017) called low-risk and high-risk behavioral profiles (LRB1, HRB1). The LRB1 group consists of people who had never smoked and were of normal weight or overweight at the time of the interview (body mass index, or BMI, of 20–30). The HRB1 group consists of people who had ever smoked (including current smokers) and were obese (BMI
Based on the longitudinal data for 2000 to 2014, we model transitions using discrete-time competing risk models (Allison 1982), controlling for age, gender, and health behaviors, and using sampling weights. The transition probabilities derived from these models are used in Markov chains to calculate DLE, while assuming that transitions between states occur, on average, at mid-interval. To calculate the DLE and the DFLE of the AVG, we calculate the transition probabilities at population averages of smoking and obesity.
Standard errors for the endpoints of the identification intervals can be calculated using the bootstrap resampling method, whereby for each bootstrap replication, the transition probabilities and DLE are reestimated. To construct confidence intervals, we follow Horowitz and Manski (2000). Let
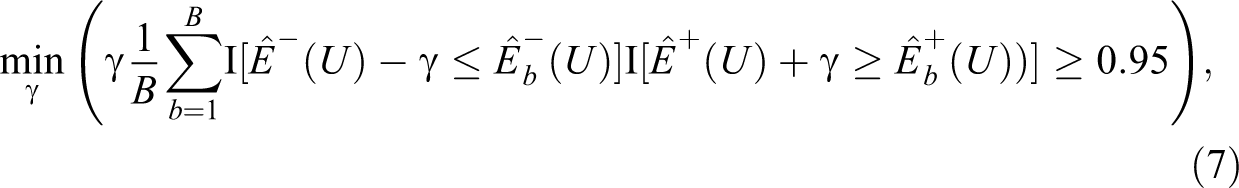
where
The HRS data allow us to narrow the bounds on
Results are shown in Figures 4 (DLE) and 5 (DFLE). As in the previous example, the figures show point estimates as well as several sets of identification bounds arising from different sets of assumptions. Confidence intervals are shown as dashed lines. The results in both figures are for men and women combined; results by gender are available upon request.
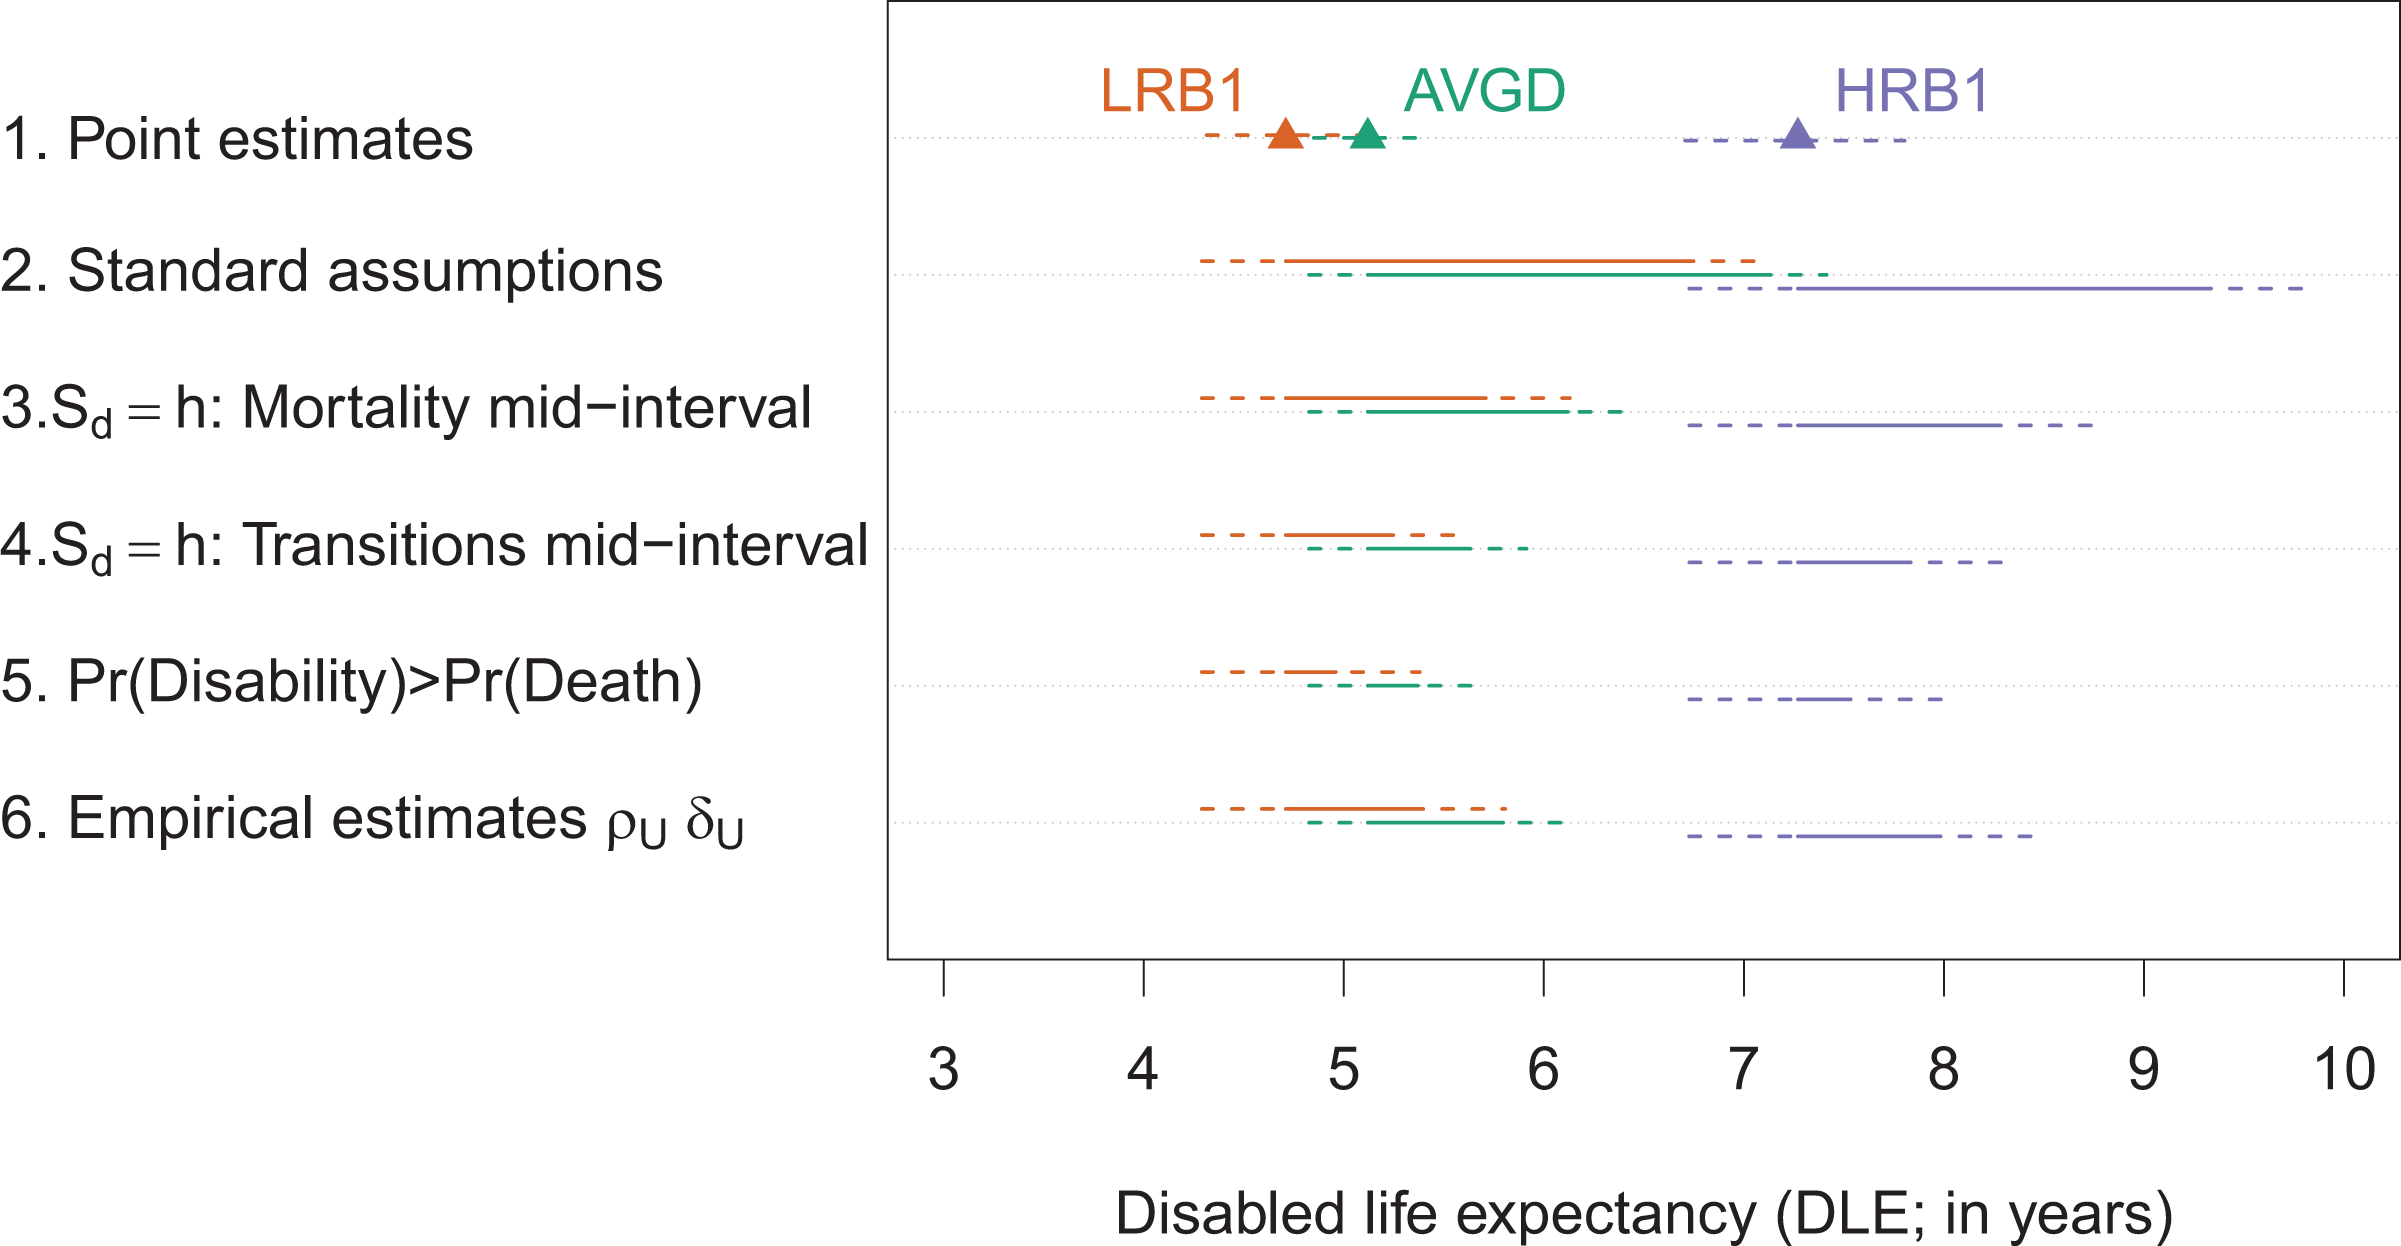
Point estimates and identification bounds of disabled life expectancy using Health and Retirement Study data. Confidence intervals are shown as dashed lines. Point estimates in the first line of the figure; the following lines show the identification bounds bias from different sets of assumptions. Results for low-risk behavioral profile (LRB1) are in orange, results for average profile AVG are in green, and results for high-risk behavioral profile (HRB1) in purple. Source: Health and Retirement Study, own calculations.
The first line of Figure 4 shows that the point estimate of DLE of LRB1 is slightly lower than that the one of the population average (
If we are willing to accept the assumptions that transitions to death happen at observational midpoints if
The identification bounds using the empirical estimates for the upper bounds of
Figure 5 shows results for DFLE, which can be seen as the flip side of the DLE bounds. Again, we obtain results similar to those of Mehta and Myrskylä (2017). The differences between the average group and the two other groups are vast (
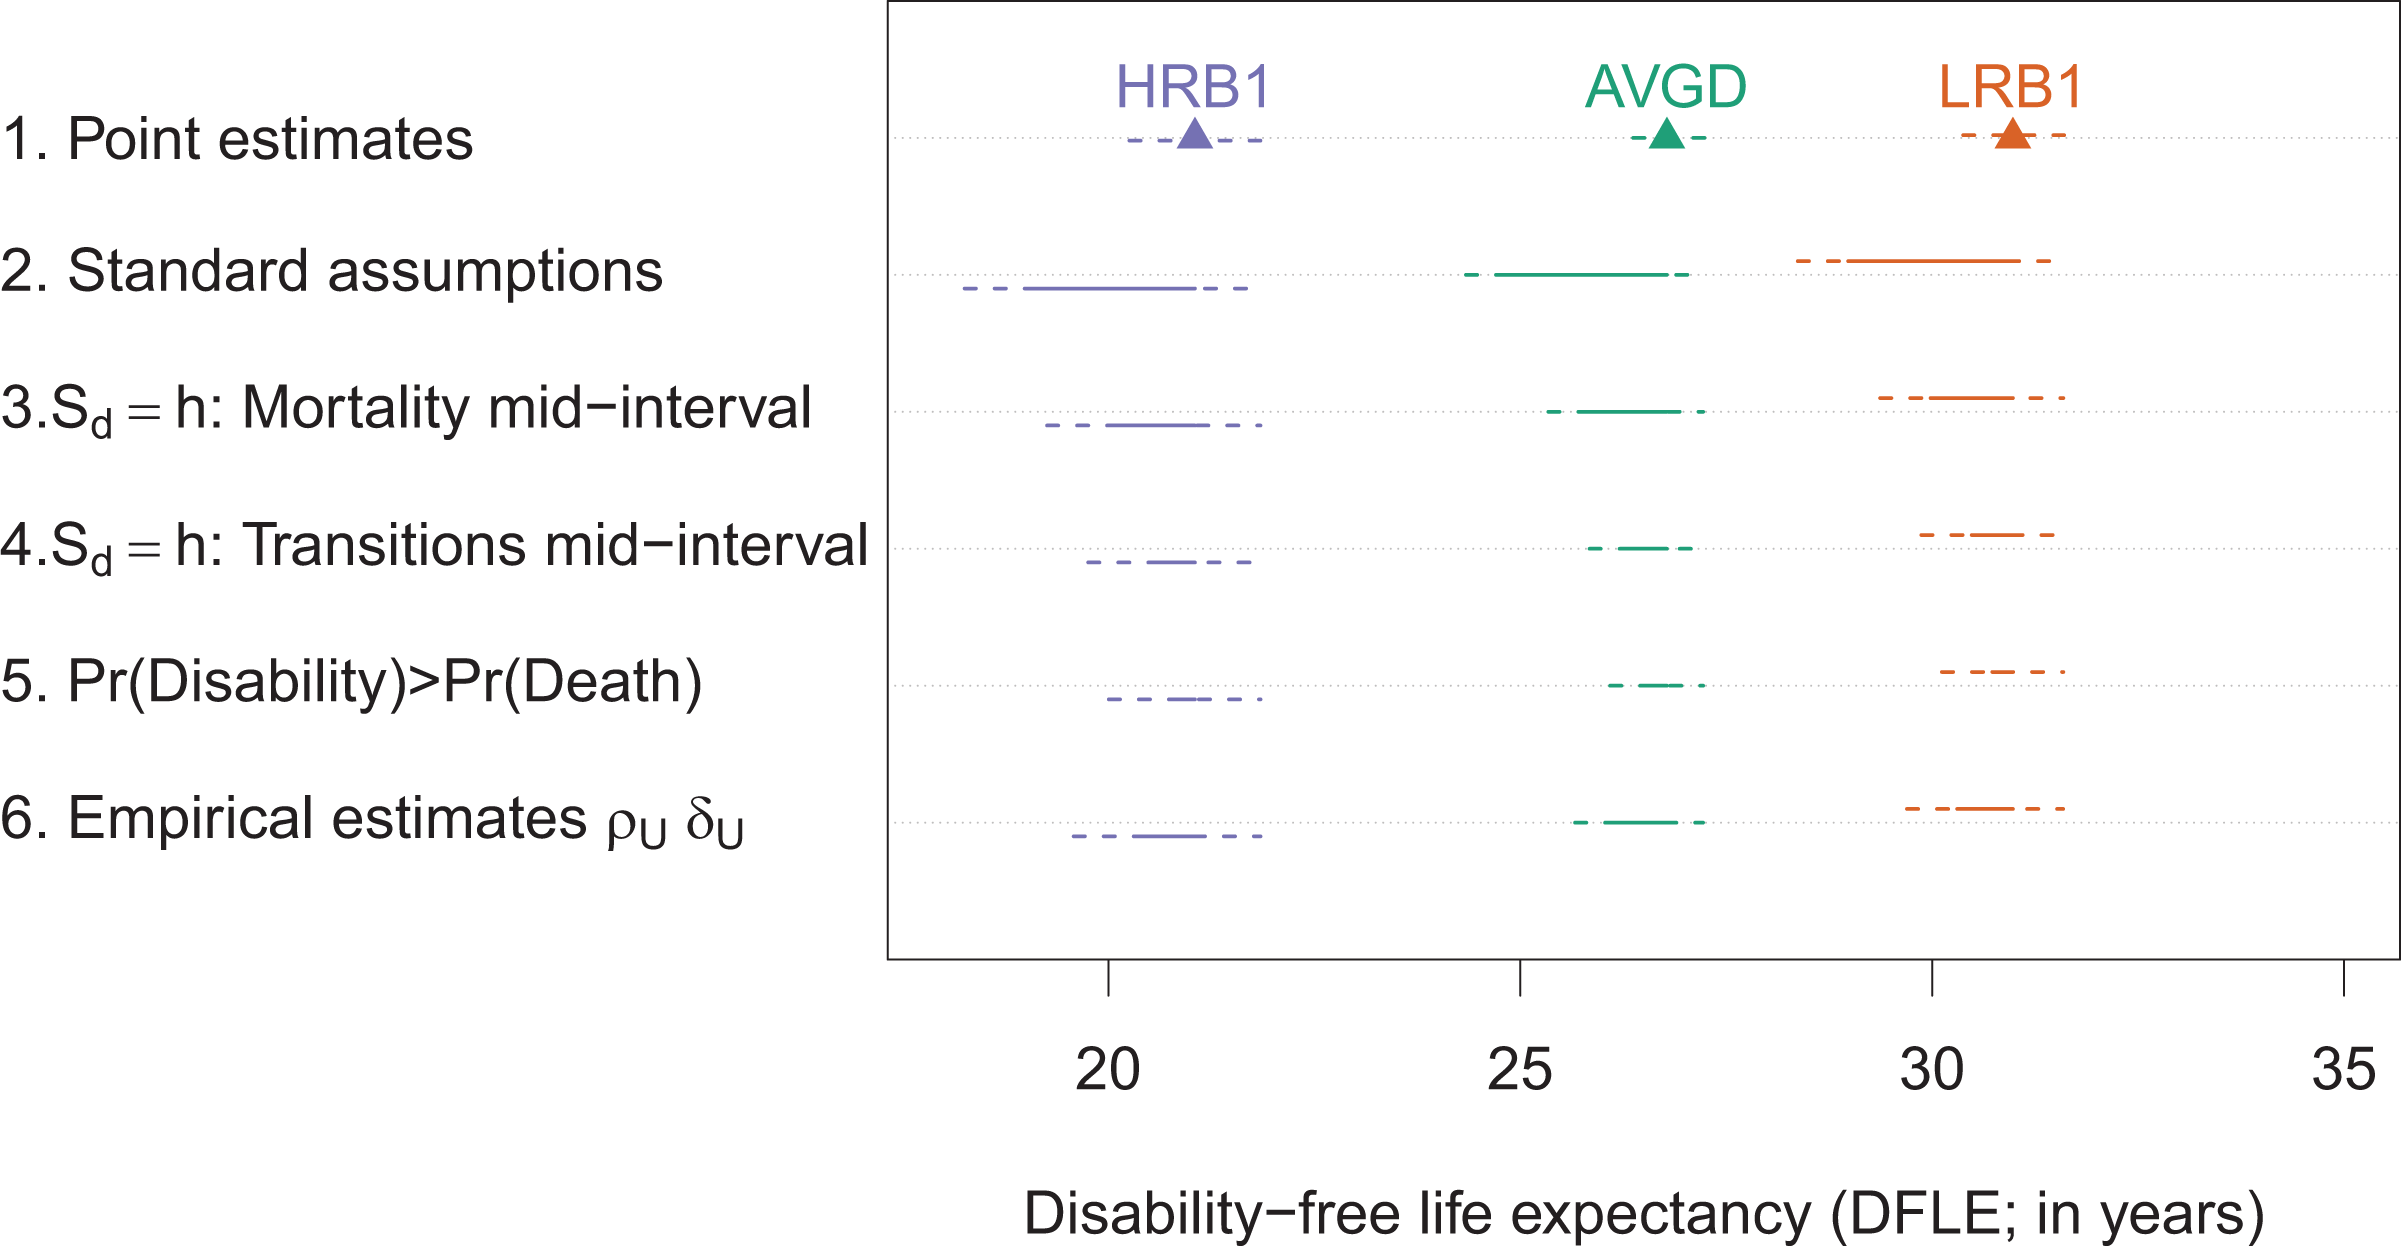
Point estimates and identification bounds of disability-free life expectancy using Health and Retirement Study data. Confidence intervals are shown as dashed lines. Point estimates in the first line of the figure; the following lines show the identification bounds bias from different sets of assumptions. Results for low-risk behavioral profile (LRB1) are in orange, results for average profile AVG are in green, and results for high-risk behavioral profile (HRB1) are in purple. Source: Health and Retirement Study, own calculations.
Removing Further Assumptions
Unobserved Recovery
So far, we have assumed that in the last interval before death, there might be unobserved transitions from nondisabled to disabled, but not the other way round; i.e., that there is no unobserved recovery. While it has been argued in the literature that unobserved recovery is less relevant than unobserved disability (e.g., Yi et al. 2004), this assumption is not required and can easily be removed. Unobserved recovery leads to the overestimation of DLE. If both unobserved recovery and unobserved transitions to disability occur, then overestimation and underestimation will cancel each other out to some extent.
This means that the maximum possible amount of overestimation through unobserved recovery will occur if there are no unobserved transitions to disability. In this case, bias can be bounded in a manner similar to that used for underestimation, as described in Bounds on Bias Due to Unobserved Final Transitions section. It is given by

where
Combining bounds on overestimation and underestimation gives the following bounds on DLE:

where
Intervals Other Than the Death Interval
We have focused on unobserved transitions in the last observed interval before death, given that for earlier intervals, unobserved transitions to disability and unobserved recovery likely cancel each other out (Gill et al. 2005; Wolf and Gill 2009). However, our approach could also be applied to unobserved transitions in earlier intervals, either instead of or in addition to the interval before death. The same reasoning as in Bounds on Bias Due to Unobserved Final Transitions section can be applied. Unlike in the death interval, not everyone will die in the earlier intervals, but we can allow for this by choosing
Ultimately, the bounds will become too wide to be informative if too many intervals are considered at once. As an extreme case, let us assume that DLE at birth is to be estimated; i.e., DLE and DFLE sum to total life expectancy at birth. With unobserved transitions possible in all age intervals and no further assumptions applied, the bounds for DLE can range from (close to) zero to (close to) total life expectancy at birth. At the one extreme, it is possible that the individuals who are observed in the disabled state are in this state only at the time of the interview, having transitioned to disability shortly before the interview, and then recovered immediately thereafter. At the other extreme, a similar set of circumstances could apply to the healthy state. While such scenarios are rather unrealistic, they show the effect of using only a few assumptions.
Conclusions
In this article, we have presented a method that allows researchers to calculate the potential bias in multistate models due to unobserved transitions between states. Specifically, we have provided simple expressions for the bounds of the worst-case level of bias and applied them to estimates of DLE potentially biased by unobserved transitions shortly before death. Our method can easily be applied to any study of DLE and to any DLE results published in the literature, without the need to access the underlying data. This feature was illustrated by the first example we provided, which was based on results published by Crimmins et al. (2009). Our second example was based on data from the HRS. It showed how mild assumptions and empirical estimates can be combined for the calculation of identification bounds.
Our method is generally applicable to any study of the expected lifetime spent in a state of interest, and it is not limited to estimating DLE. In particular, our method can be applied to any estimate published in the literature, without the need to estimate a multistate model. For instance, Lorenti et al. (2020) provide results on the expected lifetime spent working at age 50 (working life expectancy; WLE), and they show how WLE depends on early-life socioeconomic status (SES). Their estimates are based on the biannual HRS data and a multistate model with three states: working, disabled, and not working, including retirement. One of the key findings is that men with low early-life SES have a WLE of 9.5 years. This estimate of WLE is potentially too high, as individuals who are last observed to be working and then die might transition to disability before dying. However, in this case, the bounds on bias will be low: The probability of the last observed state before death being working is relatively small because working individuals will be much younger and healthier than nonworking individuals. Even if we assume that for men with low early-life SES this probability is 25 percent and combine it with the assumption of mid-interval transitions (
Our method is also compatible with different types of modeling approaches, as long as they provide estimates of the time spent in a state. This includes multistate approaches as well as descriptive analyses of real cohorts. Moreover, the narrowing of identification bounds is not restricted to the assumptions discussed in this article, and any set of assumptions that the researcher is willing to make can be used, regardless of whether they are based on substantive knowledge or empirical estimates.
Footnotes
Declaration of Conflicting Interests
The author(s) declared no potential conflicts of interest with respect to the research, authorship, and/or publication of this article.
Funding
The author(s) received no financial support for the research, authorship, and/or publication of this article.