
Abstract
An increasing age of respondents and cognitive impairment are usual suspects for increasing difficulties in survey interviews and a decreasing data quality. This is why survey researchers tend to label residents in retirement and nursing homes as hard-to-interview and exclude them from most social surveys. In this article, I examine to what extent this label is justified and whether quality of data collected among residents in institutions for the elderly really differs from data collected within private households. For this purpose, I analyze the response behavior and quality indicators in three waves of Survey of Health, Ageing and Retirement in Europe. To control for confounding variables, I use propensity score matching to identify respondents in private households who share similar characteristics with institutionalized residents. My results confirm that most indicators of response behavior and data quality are worse in institutions compared to private households. However, when controlling for sociodemographic and health-related variables, differences get very small. These results suggest the importance of health for the data quality irrespective of the housing situation.
Keywords
Residents living in retirement and nursing homes are often labeled as hard-to-survey and are excluded from many social surveys (Schanze and Levinson 2019). They are a very small population and hard-to-sample and they are hard-to-reach because the access to the institutions can be restricted by gatekeepers (Schanze and Levinson 2019; Tourangeau 2014). Another important reason for the label and the exclusion are characteristics that have been confirmed in many previous research studies: Compared to private household residents, residents of retirement and nursing homes are older on average, suffer from worse health, and live with functional and cognitive impairment more often (Agüero-Torres et al. 2001; Einio et al. 2012; Gaugler et al. 2007; Laferrère, Aaron Van Den, and Karel Van Den 2012; Lang 2014; Luppa et al. 2008; Maxwell et al. 2013; Toot et al. 2017). Those characteristics obviously make them more difficult to interview (Tourangeau 2014). In an expert survey carried out among survey researchers with experiences in nursing and retirement homes, 14 of the 21 researchers (66.7 percent) agreed that residents of long-term care institutions are at least somewhat or even very hard to interview (Schanze and Levinson 2019). 1
Nevertheless, the European Union–financed Synergies for Europe’s Research Infrastructures in the Social Sciences project identified nearly 100 survey programs that already collected data in retirement homes, nursing homes, health-related institutions, or assisted living facilities (Schanze and Levinson 2019). Those survey programs sometimes have a broad research interest or a more specific focus on health or aging, and they are conducted at a national level like the French Enquêtes Capacités, Aides et REssources des seniors, the U.S. Health and Retirement Survey, and the UK Household Longitudinal Study or with a cross-national design like the European Health Interview Survey or the Survey of Health, Ageing and Retirement in Europe (SHARE). If institutionalized elderly are potentially harder to interview, can this be detected in the survey data?
When respondents answer survey questions, they need to cope with a complex task. This task and the various intellectual steps respondents need to perform were described multiple times in great detail (Alwin 2007; Alwin and Krosnick 1991; Knäuper et al. 2016; Schwarz 1999; Tourangeau, Rips, and Rasinski 2000): As the first step, respondents need to understand the meaning of the question and identify which information are required to answer it. Following the comprehension, respondents need to access relevant information from their memory and retrieve it. The retrieved information needs to be formatted to match the given answer scale of the survey question. Before voicing their reply to the interviewer, respondents need to judge whether the information is correct and whether it might be socially undesirable to answer the question honestly. As the last step, respondents need to communicate their reply.
The intensity and accuracy of running through this cognitive process is moderated by several factors (Alwin and Krosnick 1991; Krosnick 1991), namely, (1) the difficulty of the survey item as such, whether it uses complicated, abstract, or ambiguous words (Alwin and Krosnick 1991; Colsher and Wallace 1989; Fuchs 2009; Lenzner 2012; Schwarz 2007); (2) the ability and characteristics of respondents; (3) their motivation to answer the item correctly (Fox, Diani, and Streiner 2007; Knäuper et al. 2016); and (4) the impact of interviewer–respondent interactions (Beullens, Loosveldt, and Vandenplas 2018; Loosveldt 1997; Ongena and Dijkstra 2007), at least in survey modes that rely on interviewers.
The difficulty of specific survey questions and interviewer effects are not at the heart of this article. I will examine the impact of respondents’ characteristics on difficulties to interview them and on the quality of survey data by comparing survey responses of elderly respondents living in private households and institutions in SHARE. 2 My research question is to what extent the response behavior and the quality of data of respondents in institutions for the elderly differ from that of respondents living in private households? Do the characteristics of institutionalized residents make them hard-to-interview and does it also lead to a worse data quality? And are residents of private households comparably hard-to-interview when taking into account their sociodemographic characteristics and health condition?
In the following section, I will continue by summarizing previous research on the question of why respondents sometimes fail to answer survey questions appropriately, how age and cognitive impairment affect those processes, and whether institutionalization as such influences response behavior and data quality. The subsequent section describes the survey data I used and my research design, which mainly consists of matching institutionalized respondents to comparable respondents living in private households. I present the results on a number of indicators for hard-to-interview respondents and data quality and will conclude with an answer to the overall question, whether institutionalized residents are really unique in terms of response behavior and whether it is feasible to conduct survey interviews with this “hard-to-interview” group in general social surveys.
Why Do Respondents Fail to Answer Survey Questions Properly?
Throughout decades of research, scientist examined why respondents sometimes fail to run through the process of answering survey questions in a proper way. Instead of answering questions in an optimal way, respondents sometimes defect to a more careless and less motivated answering behavior coined as weak or strong satisficing by Krosnick (1991). As indicators of satisficing, Krosnick reviewed earlier studies on primacy and recency effects, acquiescence, which is the tendency to agree to questions irrespective of their content, endorsing the status quo, nondifferentiation, don’t know replies, and mental coin flipping resulting in random responses. As mentioned above, question difficulty, respondents’ characteristics and ability, their motivation, and interviewers can all lead to such a response behavior.
Looking at respondents’ characteristics, many researchers assume that older respondents differ from younger respondents in terms of question comprehension, accessibility and retrieval of information, ability to translate behaviors or attitudes into the given scales of questions, communication abilities, and even motivation (Beullens et al. 2018; Knäuper et al. 2016). Age is one of the most common usual suspects for a lower data quality (Alwin 2007; Alwin and Krosnick 1991; Andrews and Herzog 1986; Beullens et al. 2018; Colsher and Wallace 1989; Fuchs 2009; Knäuper 1999; Knäuper et al. 2016; Kühn and Porst 1999; Lang 2014; Loosveldt 1997; Motel-Klingebiel, Klaus, and Simonson 2014; Schwarz 1999).
Several studies investigated the impact of age on a range of quality indicators. The degree of item nonresponse, especially “don’t know” responses, increases significantly with age (Koch and Blohm 2009; Colsher and Wallace 1989; Fuchs 2009; Knäuper 1999; Knäuper et al. 1997; Pickery and Loosveldt 1998), while early papers found a negative impact of age on reliability and valid variance (Alwin and Krosnick 1991; Andrews and Herzog 1986; Colsher and Wallace 1989; Rodgers, Herzog, and Andrews 1988). This finding was confirmed in a recent analysis by Kroh, Winter, and Schupp (2016). In a meta-analysis of survey experiments, Knäuper (1999) found stronger response order effects (recency and primacy effects) for older respondents, which results in the increasing preference for extreme responses with advancing age (He et al. 2014; Kieruj and Moors 2013). Another experiment found no differences in the response behavior by older respondents depending on whether labels of a question were numbered or not, which was not the case for respondents younger than 70 years (Schwarz and Knäuper 1999). Both studies relate those findings to an aging-related decrease in working memory capacity and cognitive resources. Beullens et al. (2018) identified age as a driving factor of an increased need for clarification, interview length, and stronger interviewer effects. This may indicate a shift from a standardized but artificial interview process to a more conversational approach resembling everyday conversations (cf. Beullens et al. 2018; Kühn and Porst 1999), which in fact can also help to improve respondents’ comprehension of survey items and thereby improve the accuracy of responses (Schober and Conrad 1997; West et al. 2018).
As a positive response behavior, a negative impact of age on acquiescence was found in three studies using the Big-Five inventory and other items (Costello and Roodenburg 2015; He et al. 2014; Lechner and Rammstedt 2015), whereas another study could not find any significant impact of age on acquiescence in two different surveys when controlling for various other variables (Olson and Bilgen 2011). To explain acquiescence, respondents’ psychological traits, the desire to be perceived in a positive light, and a lack of cognitive sophistication are cited as relevant factors next to interviewer effects (Olson and Bilgen 2011). However, acquiescence is sometimes difficult to find (cf. Kieruj and Moors 2013) and difficult to explain. As Roberts et al. (2019:615) conclude, “there is likely considerable variation in individual and cultural propensity to acquiescence for reasons other than lack of motivation or ability […].”
Despite the strong theoretical expectations and some confirmed hypotheses, the literature on the impact of age on the quality of survey responses shows mixed or weak effects. This can be explained by potential confounding of age effects with other important explanatory variables, most importantly education and cognitive impairment (Knäuper 1999). Regarding education, Alwin (2007) found that the difference between age groups is not significant when controlling for education. This can be related to cohort effects since older respondents enjoyed a shorter education while being in their adolescence compared to the younger age cohorts. Secondly, even though age or education is not sufficient indicator for cognitive impairment (Kühn and Porst 1999; Loosveldt 1997), an advanced age is confounded with an increased cognitive decline (Salthouse 2009). When cognitive functioning declines, a problematic respondent behavior becomes more likely, for instance, the extent of item nonresponse increases (Fuchs 2009). On the other hand, a worse working memory also reduces the likelihood of question order effects since respondents do not remember previous questions accurately (Fuchs 2009; Schwarz 1999).
Moreover, as previous research shows, data quality does not decrease linearly with age. Early research with U.S. panel data already showed an insignificant impact of age on test–retest reliability in 96 attitudinal measures with one exception: “[…] declines in reliability accompanying aging […] primarily occur in the oldest age group” (Alwin and Krosnick 1991:173). In a more recent paper, Beullens and colleagues (2018:9) examined several indicators of respondents’ behavior and arrived at a similar conclusion regarding the nonlinear impact of age, concluding that “[…] up to the 54–62 age-group, little difference can be found among the respondents. It is only in the two oldest age-groups that the differences become very clear, with the oldest age-group (71 and above) being the most distinct.” Those findings can probably be explained with an accelerated cognitive decline at older ages (Salthouse 2009), even though the reliability of survey items can also be negatively influenced by more rapid changes of the living situation and respondents’ characteristics in old age, for instance, when moving to an institution due to the health condition.
When it comes to old age and cognitive impairment, institutionalized residents living in retirement and nursing homes are especially challenging and interesting. As many studies showed, age, health, and functional or cognitive impairment are significantly related to the likelihood of living in or moving to a nursing or retirement home (Agüero-Torres et al. 2001; Einio et al. 2012; Gaugler et al. 2007; Laferrère et al. 2012; Luppa et al. 2008; Maxwell et al. 2013; Toot et al. 2017).
Few scientific studies explicitly analyzed whether residents living in long-term care institutions have the capacity to be interviewed and how the resulting data quality looks like. In Austria, a small-scale survey in nursing homes examined residents’ ability to participate in a survey on their quality of life (Lang 2014). Again, age as such was not a significant predictor of a lower response rate: Residents who could not take part in the survey needed a higher level of care were more disoriented and in worse general health (Lang 2014). This study emphasized the importance of cognitive impairment and health.
Regarding potential difficulties of survey questions for institutionalized residents, Sangl et al. (2007) concluded that nursing home residents mostly ignored reference periods given by questions but rather referred to single events, thereby simplifying the response task. Moreover, residents preferred numbered scales from 0 to 10 instead of fully labeled scales because they “were not distracted by the meaning or emotional content of the words” (Sangl et al. 2007:71). Fox and colleagues (2007) tested various survey questions in a similarly challenging target group consisting of older adults in hospitals. The authors came to the conclusion that this population especially struggled with long questions with multiple parts. The comprehension of respondents was also worse for negatively framed items because for those questions, disagreement indicates a positive statement. In addition, they found that questions with a low relevance to respondents caused frustration and tiredness among residents.
Most large-scale survey programs cannot take into account specific requirements of subgroups of respondents by adapting questions or survey procedures. Thus, considering the specific characteristics of residents in retirement and nursing homes, I expect more difficult interviews in institutions and a worse data quality compared to private households. This expectation is in line with the hard-to-interview label of institutionalized elderly used by many survey researchers. Moreover, it is my second hypothesis that those differences are mainly driven by the age and related factors such as health and cognitive condition of institutionalized residents. Hence, I expect much smaller differences between institutions and private households when controlling for sociodemographic and health-related variables. Given the absence of previous literature on those research questions, it remains to be seen whether differences will completely disappear.
Data and Analysis
Earlier studies of data quality and satisficing in the field of survey methodology have analyzed a wide set of indicators, as Roberts and colleagues (2019) summarized in a recently published systematic review. Those indicators comprise primacy and recency effects, acquiescence, nondifferentiation, extreme responses, replies to trap question, or correlations of several variables (Roberts et al. 2019). This article examines the share of proxy interviews and ratings of respondents’ performance by interviewers as indicators of hard-to-interview respondents, the selection of middle and positive extreme categories to survey items as response patterns, and item nonresponse and acquiescence as indicators of data quality. I will also analyze how the indicators of hard-to-interview respondents influence the data quality indicators.
Data Preparation and Variables Used
I use waves 5, 6, and 7 of the SHARE, the three last waves of this survey collected in a number of European countries and Israel in 2013, 2015, and 2017 (Börsch-Supan 2019a, 2019b, 2019c). SHARE is a cross-national panel survey, which covers institutionalized respondents living in retirement and nursing homes and respondents living in private households older than 50 years old (Börsch-Supan et al. 2013). 3 In a similar approach to that of Schanze and Zins (2019), I pooled the SHARE waves 5–7 and kept only the most recent observation for each respondent. I used this method to increase the number of institutionalized respondents in my analysis. Omission of information about waves and change across waves is justified because I am mainly interested in the response behavior as such and not in substantive analyses of institutionalization or changes over time within respondents. Following the pooling of waves, I dropped countries with 15 or less institutionalized respondents in the three waves, resulting in a data set with more than 77,500 unique observations in 18 different countries; 2,002 of those observations were identified as institutionalized residents using three different variables in SHARE (2.5 percent of the pooled waves). 4
As dependent variable, I will start with the share of proxy interviews as a first indicator of a hard-to-interview respondent. Proxy interviews are a tool to safeguard the data quality when being confronted with difficult respondents. According to the SHARE Release Guide, “only if physical and/or cognitive limitations make it too difficult for a respondent to complete the interview her-/himself, it is possible that the respondent is assisted by a so-called proxy respondent to complete the interview” (Munich Center for the Economics of Aging 2019:13). Even in cases of hearing impairment or Alzheimer’s disease, some parts of the SHARE interview are nonproxy modules and need to be completed by the respondent, if possible.
As the second and third indicator of hard-to-interview respondents, I analyze how interviewers rated respondents in terms of requiring additional clarifications and their willingness to answer questions. 5,6 Asking for clarifications while interpreting a question is not a direct indicator of bad data quality because respondents asking for additional explanations might intend to answer survey questions more accurately and with a higher quality compared to respondents who refrain from asking questions (Revilla, Saris, and Krosnick 2014). In any case, this kind of response behavior will make the survey interview longer and more difficult for interviewers. Moreover, previous research indicated a link between an increased need for clarification with the tendency to provide inadequate answers (Loosveldt 1997) and with a more limited understanding of questions and larger interviewer effects (Beullens et al. 2018), especially among older respondents. The rating of respondents’ willingness serves as a proxy for their motivation, which was defined as an important explanatory factor for satisficing alongside task difficulty and respondents’ ability (Krosnick 1991). When analyzing ratings by interviewers, it should be kept in mind that interviewers sometimes use heuristic cues while replying to evaluation questions (Kirchner, Olson, and Smyth 2017). In those cases, a higher age, and especially institutionalization, could lead to a more negative rating of respondents, even though their behavior might be comparable to the behavior of younger respondents or respondents living in private households.
Following the first three measures of hard-to-interview respondents, I will move on to indicators of data quality. First, I will investigate two different batteries of items in SHARE, namely, the CASP inventory and a short version of the Big-Five inventory. The CASP inventory was developed before the first wave of SHARE was fielded in 2004 to measure the health-related quality of life (von dem Knesebeck et al. 2005). In SHARE, the CASP inventory consists of 12 items measuring four different dimensions, namely, control, autonomy, self-realization, and pleasure (CASP). Each of the items gives a short statement to respondent (e.g., “I feel that life is full of opportunities”), respondents are asked to rate how often this statement applies to them on a four-point Likert-type scale. A short version of the Big-Five inventory was introduced in the seventh wave of SHARE. 7 This Big-Five inventory contains 11 items measuring five different dimensions of personality (abbreviated as OCEAN). Respondents receive brief statements asking them to what extent they agree or disagree a certain trait applies to them on a five-level Likert-type scale. Both item batteries are in a nonproxy part of the questionnaire and should only be administered to the respondent.
As the first step, I compare the item nonresponse within the two batteries across the two housing situations. I will mainly focus on the average number of missing values across all CASP and Big-Five items and the share of respondents having at least one missing item in the two batteries. I will also consider different types of item nonresponse, namely, refusals, don’t know responses, and missing values caused by the incapacity of respondents to reply. If respondents are not capable of answering CASP or Big-Five questions themselves, SHARE asks their interviewers to either assign a system missing value or indicate another type of item nonresponse, usually “don’t know.” According to the SHARE user support team, the routing of respondents who relied on proxies did not work properly in wave 7, which is why those respondents received more don’t know replies and nearly no system missing values. This routing error should not affect my aggregate analysis of item nonresponse and the conclusions.
As second step, I compare response patterns in Big-Five items. Due to the uneven number of scale points in Big-Five items, a midpoint is intended to measure a neutral attitude of respondents (“neither agree nor disagree”). While previous analysis showed clear advantages of a 5-point Agree–Disagree Scale compared to longer scales (Revilla et al. 2014), other authors found a large number of respondents hiding their nonattitude by selecting the midpoint (Raaijmakers et al. 2000; Sturgis, Roberts, Smith 2014). When probing respondents who selected the midpoint, it turned out that a majority of those respondents did actually not know whether they should agree or disagree to the given statement (Sturgis et al. 2014). This could help to explain the correlation of an increasing selection of midpoints when the clarity of items decreases (Velez and Ashworth 2007). The selection of middle response options is labeled as weak satisficing (Roberts et al. 2019) and was shown to have a negative impact on the reliability of attitude measures (Alwin and Krosnick 1991). This is why I compare the share of middle response selection between institutionalized respondents and respondents living in private households. Additionally, I briefly examine the selection of end points for Big-Five items as another response pattern, which proved to be more prevalent among older respondents (He et al. 2014; Kieruj and Moors 2013). The proportion of midpoints, strong disagreement, and strong agreement across 11 items was calculated within respondents. I excluded missing values from this calculation and only used their substantive replies as denominator. As a limitation, I cannot directly associate response patterns with data quality without a proper experimental designs or probing respondents to provide more information about the underlying reason for their choices. Still, this comparison also serves to prepare the subsequent analysis of acquiescence. Respondents making overly use of midpoints will obtain lower scores of acquiescence.
Batteries of items that intend to measure a latent concept with multiple dimensions are well suited to analyze data quality. Any deviations of empirical findings from theory might indicate measurement errors and a worse data quality. In first exploratory analyses of the CASP inventory, the 12 items did not load as expected by theory (Hyde et al. 2003). This finding is not unique and was already observed in an earlier study (Borrat-Besson, Ryser, and Gonçalves 2015). In the light of those empirical difficulties, I decided to restrict my analysis of the CASP inventory to the analysis of item nonresponse and focus on the better developed Big-Five inventory. The short version of the Big-Five inventory was already used in earlier studies to analyze data quality (Lechner and Rammstedt 2015; Rammstedt, Goldberg, and Borg 2010; Rammstedt and Kemper 2011; Soto et al. 2008) because the items are balanced within each latent dimension (e.g., “being lazy” and “doing a thorough job”). In theory, indicating agreement with one item of a dimension would require respondents to answer with disagreement to the second item of the respective dimension, resulting in a highly negative correlation. When measuring the Big-Five items on the 5-point scale reaching from one to five, the mean of items within a dimension is expected to be 3.0. A deviation from this pattern within dimensions and across the five dimensions, in other words any values higher than 3.0, indicates a tendency to agree to mutually exclusive statements to a larger extent than expected by theory. This kind of acquiescence was labeled as weak satisficing and is a sign of a worse data quality. When calculating the acquiescence scores within dimensions, a missing value in one or both of the paired items led to an exclusion of the respective respondent for this given score. For the overall acquiescence score, I only included respondents if they answered at least five or more out of the 10 Big-Five items used for this score. This led to the exclusion of a small number of respondents (N = 91) with a higher degree of item nonresponse. 8
Propensity Score Matching (PSM)
In the course of my analysis, I will first compare various indicators of response behavior and data quality for institutions and private households to check whether respondents in institutions are harder to interview as expected by most survey researchers. Likely differences between the two populations are also driven by confounding variables since institutionalized elderly differ from respondents in private households on average, in particular in terms of age, health, and cognitive impairment. The statistical method of PSM is commonly used to overcome the selection bias in nonexperimental studies that are interested in isolating the impact of a certain treatment or quasi-treatment by creating a control group post hoc (Caliendo and Kopeinig 2005; Dehejia and Wahba 2002). PSM helps to control for differences in confounding variables by identifying cases living in private households that bear a greater resemblance to institutionalized residents in a number of predefined characteristics. This method helps to examine whether institutionalization leads to a more problematic response behavior or whether this is rather caused by other characteristics that can be found in institutions and in private households.
After comparing all respondents, I match on a small number of basic sociodemographic variables, namely, respondents’ age, their gender, whether they are widowed or not, and their level of education (labeled as Basic PSM in this article). Age is grouped into four categories, reaching from 50 to 59 years, 60 to 69 years, 70 to 79 years, and 80 years and older. Gender is coded as 0 if respondents were male and 1 if respondents were female, while widowhood is also dichotomous, identifying widowed respondents with a value of 1. The level of education is measured with the International Standard Classification of Education (ISCED) scheme that aims to generate a comparable measurement of educational achievements across countries. SHARE uses the seven-level ISCED-97 scale, which ranges from 0 (preprimary education) to 6 (second stage of tertiary education).
As the third step, I add three health-related variables to the abovementioned set of sociodemographic variables in the PSM (full PSM). In previous studies, a combination of sociodemographic and health-related variables proved to be decisive in increasing the likelihood of institutionalization in older age cohorts (Schanze and Zins 2019). In this analysis, the diagnosis of dementia serves as a dichotomous measure of cognitive illness and potential cognitive decline. A 7-point count variable on limitations in activities of daily living (ADLs) measures the ability of respondents to cope with six different tasks of daily living: dressing, including putting on shoes and socks; walking across a room; bathing or showering; eating, such as cutting up your food; getting in or out of bed; and using the toilet, including getting up or down. And finally, the self-rated health of respondents is a third health-related indicator measuring the subjective perception of respondents regarding their state of health on a 5-point scale reaching from poor, fair, good, and very good to excellent.
When selecting variables for the PSM, a number of conditions need to be fulfilled. As a first requirement, variables used for matching should influence the treatment and the outcome simultaneously (cf. Caliendo and Kopeinig 2005). All variables used in the matching procedure are expected to influence the housing situation as quasi-treatment and the response behavior and data quality as outcomes. This is especially the case for age, education, diagnosis of dementia, and the self-rated health. I only included explanatory variables with a statistically significant impact on the likelihood of institutionalization and tried to limit the number of matching variables as much as possible to avoid an increase of variance in propensity scores resulting in a lower number of matched cases (cf. Caliendo and Kopeinig 2005).
Following the conditional independence assumption, the variables used for matching should not be influenced by the treatment or the anticipation of the treatment (Caliendo and Kopeinig 2005). Age, gender, widowhood, and education should definitely be exogenous and independent from the housing situation. The same holds for dementia as a health condition, which should not be caused by institutionalization. The perception of what people are able to do (limitations in ADL) and their self-rated health could be more influenced by their context. However, it is difficult to postulate whether respondents will rate their health as better or worse due to their institutional environment. Some respondents might rate their abilities or health worse simply because they live in a retirement or nursing home, whereas other institutionalized respondents might compare themselves with their cohabitants who are worse off and therefore arrive at a better self-rated health. However, I do not expect a systematic distortion into one direction and assume that the potential deviation is negligible for the following analyses.
As matching algorithm, I used radius matching (Dehejia and Wahba 2002). The conditional propensity of being institutionalized is calculated in a multivariate logistic regression with the abovementioned explanatory variables within each country. Radius matching excludes control cases that are too different from institutionalized cases by applying a caliper, which is often defined as 25 percent of the standard deviation (SD) of the propensity scores explaining institutionalization (Lunt 2014). I also applied the caliper of this size. To avoid matches across countries and different health-care systems, I used the countries as strata and only matched institutionalized respondents within their respective countries, which is why I excluded countries with 15 or less institutionalized residents, because the group of institutionalized residents is too small to run a meaningful logistic regression as part of the PSM. The stratified matching is meaningful to avoid an undetected impact of confounding contextual variables that exert a differing influence between countries. To increase the number of control cases for each institutionalized case within countries, I did not stratify for waves but matched across the three waves. An institutionalized respondent in Austria in wave 5 could only be matched to another Austrian respondent, but the control case could also be interviewed in wave 7 or vice versa. This matching strategy yielded a sufficiently large number of control cases in all of the 18 countries (Lunt 2014, c.f.). Only in the Netherlands, a little less than 20 respondents in private households were available as a potential match for each institutionalized respondent. In all the other countries, the number of control cases was well above this threshold, reaching 115 control cases in Finland as the maximum. As a result of the radius matching, all control cases within the bounds of the caliper receive a weight determined by their distance to the members of the institutionalized group measured by the propensity score. The weight for institutionalized cases equals 1, while the weight for respondents in private households ranges between 0.00047 and 1.5 in the basic PSM (SD = .056) and between 0.001 and 7.5 in the full PSM (SD = .11).
Exploration of the PSM
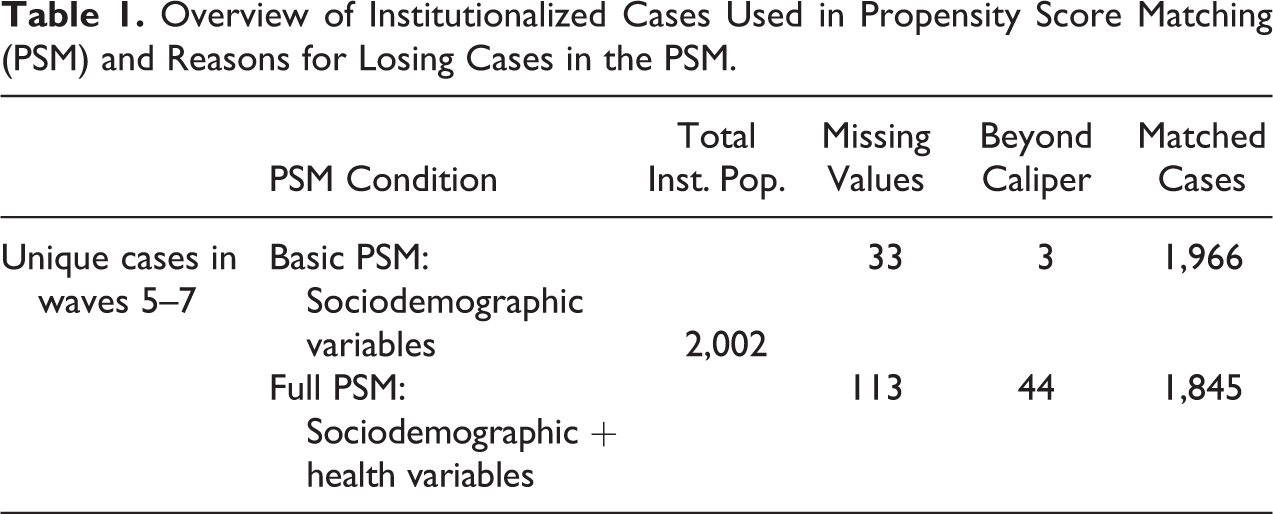
Table 1 shows the number of unique cases observed in institutions in the three waves and the respondents I lost in the process of matching. The large number of control cases in the pooled SHARE samples allowed for excellent matches with a very small number of matches beyond the border of the predefined caliper. Depending on the type of matching, 33 institutionalized respondents in the sociodemographic PSM (basic PSM) and 113 institutionalized respondents in the second, more advanced iteration (full PSM) are excluded because they had missing values in one of the variables used for matching. The caliper prevents matches for three institutionalized respondents for the basic sociodemographic characteristics. While matching with sociodemographic and health-related variables, 44 institutionalized respondents are not matched due to the absence of comparable control cases living in private households. Checking those 44 institutionalized respondents, the data show that unmatched institutionalized residents do not differ from matched cases in terms of age, gender, widowhood, education, and self-perceived health. However, unmatched institutionalized residents have a higher likelihood of dementia and face more limitations in ADL. Adding it up, 1.8 percent of the institutionalized respondents could not be matched in the basic PSM due to missing values and the absence of control cases, while 7.8 percent could not be matched in the full PSM due to those reasons. To control for the impact of the systematic dropouts, I will always show and discuss the results for the unmatched sample. Hence, I will refer to unmatched institutionalized cases in the presentation of results to assess whether the dropouts are not at random.
Overview of Institutionalized Cases Used in Propensity Score Matching (PSM) and Reasons for Losing Cases in the PSM.
PSM should help to counterbalance the impact of confounding variables while investigating the statistical impact of the housing situation on the response behavior. In a logistic regression analysis following both rounds of matching, the large majority of explanatory variables did no longer have a statistically significant influence on the likelihood of institutionalization. For the sociodemographic matching only age (odds ratio [OR] = 1.10, p = .003) and widowhood (OR = 0.88, p = .023), for the sociodemographic and health-related matching only age (OR = 1.11, p = .004) had a very small, nearly absent but statistically significant explanatory power.
Since I am using panel data, a previous participation of respondents and resulting panel experience could have a presumably positive impact on the response behavior. Panel respondents are more experienced with the various steps they need to perform while answering survey questions (Kroh et al. 2016). While Kroh et al. (2016) found more reliability with growing panel experience, another study did not detect any consistent impact of panel experience on multiple quality indicators in two U.S. panels (Sun, Tourangeau, and Presser 2019). Checking the panel experience of respondents in my unmatched data set, institutionalized respondents have a slightly longer period of panel participation than respondents in private households, partly related to the higher age of institutionalized respondents in the data. When matching institutionalized respondents with respondents living in private households, the panel experience does not differ any longer. On average, both groups participated in 3.7 previous waves. Hence, previous panel experience should have no impact on the results I will present in the following section. The same holds for the origin of respondents. If the survey interview is conducted in a language other than the native language of respondents, additional difficulties arise and might have a negative impact on the quality of survey data. In the pooled data set, roughly 12 percent of the respondents were not born in the country of interview in private households and institutions. When applying the two PSM conditions, this share does not change much. Hence, differences between the two populations cannot be explained with underlying differences in the number of foreign-born residents with potential language difficulties.
Results
Proxy Interviews and Interviewer Observations
Interviewers decide whether a proxy respondent is required who can answer a part of the questionnaire on behalf of the respondent. Moreover, following the survey interview, interviewers in SHARE rate their respondents in terms of need for clarification and their willingness to answer the questions. As mentioned earlier, those measures can be classified as subjective measures of data quality and might also be driven by a more negative perception of institutionalized residents by the survey interviewers.
Table 2 shows the share of proxy respondents for the entire pooled sample and for the respondents analyzed under the two different matching conditions. In the first row of Table 2, the difference between respondents living in private households and institutions is obvious. Proxy respondents are required with a much higher likelihood in institutions than in private households. Every third interview relied on proxy informants in contrast to only 6.5 percent in all private households. However, when controlling for age, gender, widowhood, and education, and even more so when matching respondents additionally with health-related variables, the share of proxy interviews increases dramatically in private households as well. Under the second matching condition, proxy interviews occur only 4.1 percentage points more often in institutions than in private households. As a consequence of systematic item nonresponse and unmatched cases, the share of proxy interviews slightly decreases in institutions. This observation can be made for several of the following results, indicating that institutionalized respondents who are lost in the course of PSM are more difficult to interview.
Proxy Interviews in Three Waves of the Survey of Health, Ageing and Retirement in Europe, Comparing Private Households and Institutions.
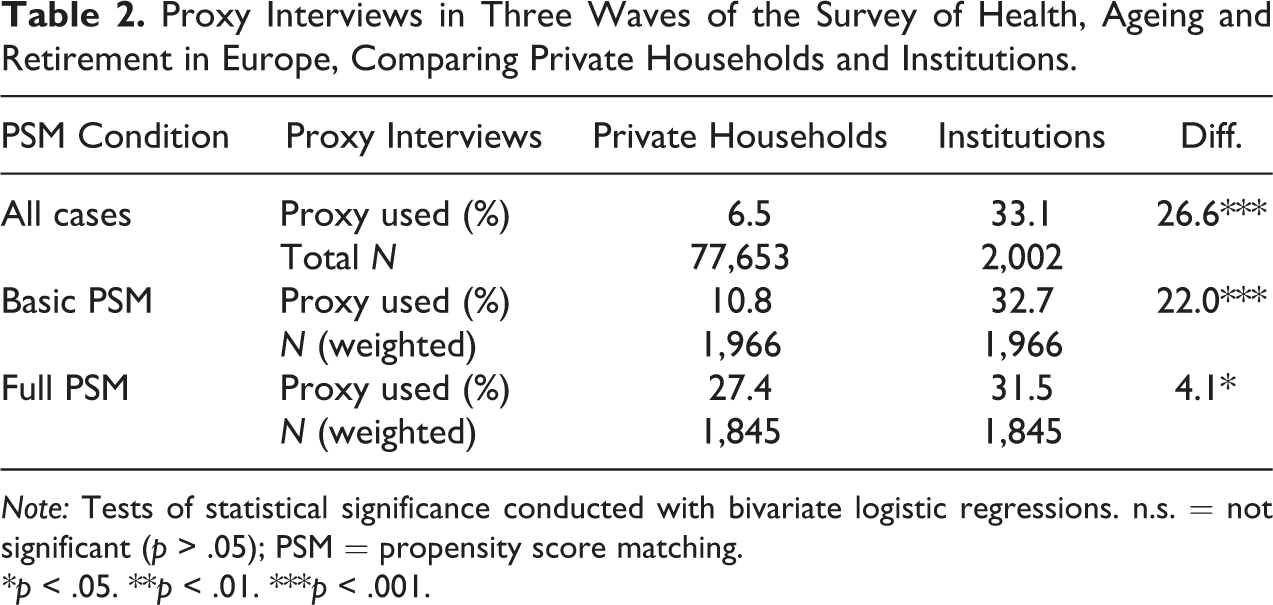
Note: Tests of statistical significance conducted with bivariate logistic regressions. n.s. = not significant (p > .05); PSM = propensity score matching.
*p < .05. **p < .01. ***p < .001.
Table 3 shows the rating of interviewers regarding respondents’ need for additional clarifications while answering the survey questions. The table displays a similar pattern like Table 2 on proxy interviews. Large differences occur in the first row comparing the two groups of respondents without matching them. Those differences get smaller when matching respondents on sociodemographic variables and continue to decline when matching on health-related variables in addition to the sociodemographic variables. Health seems to be the stronger driver of more difficult interviews compared to age, gender, education, or widowhood. Even though the gap between institutionalized and residents in private households closes, a statistically significant difference between the two group still remains. In the full PSM condition, 9.1 percent of institutionalized respondents ask for clarification always or very often, whereas this is only the case for 7.5 percent of comparable respondents living in private households. A check with a dummy variable capturing the origin of respondents showed a positive impact on the need for clarification for unweighted data. 9 However, in both PSM conditions, the origin of respondents did not have a statistically significant influence on the dependent variable next to institutionalization.
Respondents Asking for Clarification, Comparing Private Households and Institutions Across Three Waves of the Survey of Health, Ageing and Retirement in Europe.
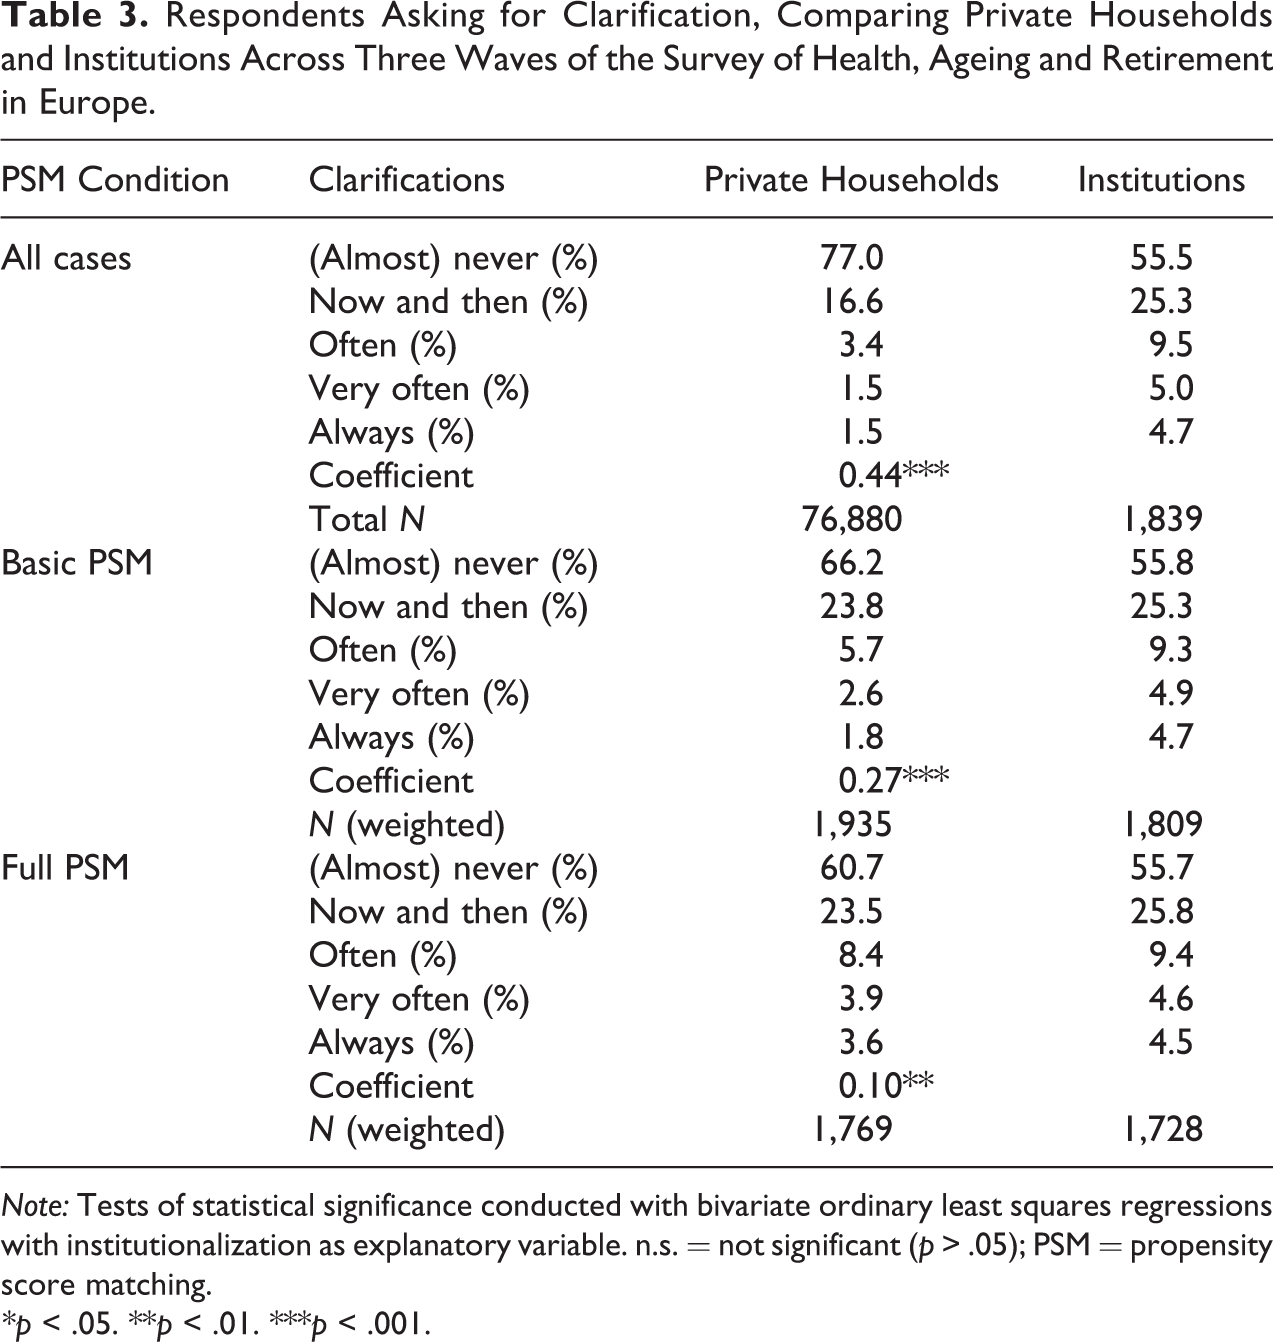
Note: Tests of statistical significance conducted with bivariate ordinary least squares regressions with institutionalization as explanatory variable. n.s. = not significant (p > .05); PSM = propensity score matching.
*p < .05. **p < .01. ***p < .001.
As the last indicator of hard-to-interview respondents, I consider interviewer ratings regarding respondents’ willingness to answer (see Table 4). In contrast to the previous indicator, this variable might be more difficult to measure but also advances a behavior that can be clearly linked to a worse data quality. As Krosnick (1991) pointed out, respondents’ motivation is a crucial aspect in explaining satisficing and its negative impact on survey data. Apparently, around 8.5 percent of all institutionalized residents and 2 percent of respondents in all private households are very unwilling to answer. At the other end of the scale, every second respondent in institutions and two of the three respondents in private households are rated as very cooperative. The lower willingness in institutions cannot be fully related to institutionalization as such. As the two steps of the PSM show, sociodemographic variables and health are the true explanatory factors for respondents’ willingness to answer, whereas institutionalization only has a marginal impact on the dependent variable.
Respondents’ Willingness to Answer Questions, Comparing Private Households and Institutions Across Three Waves of the Survey of Health, Ageing and Retirement in Europe.
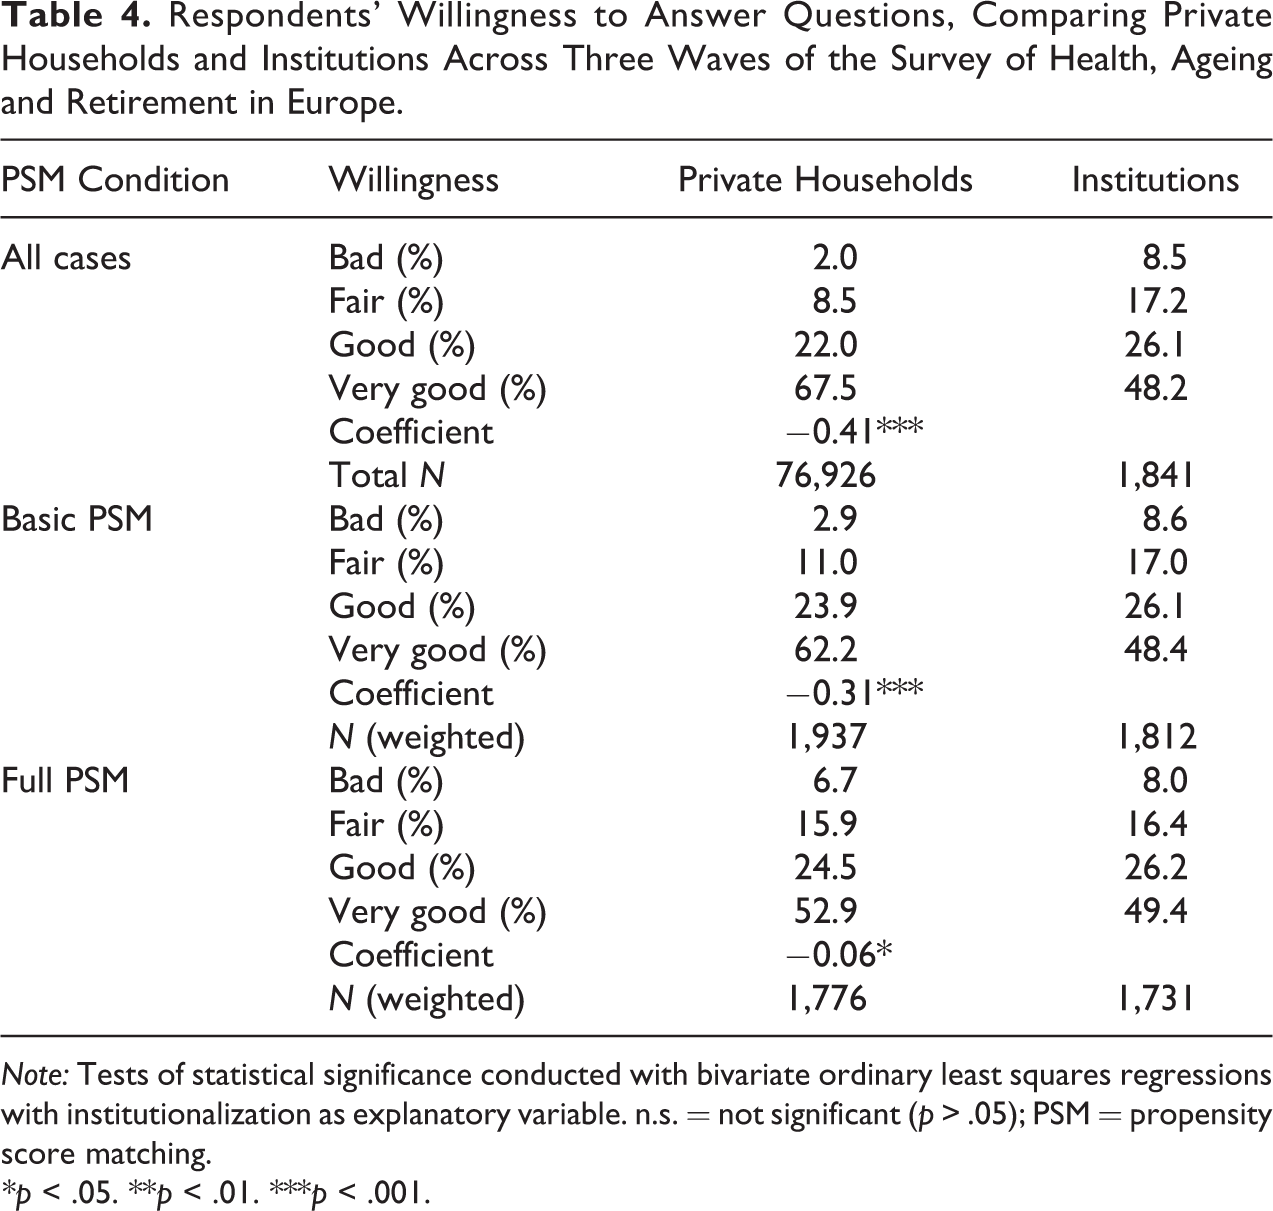
Note: Tests of statistical significance conducted with bivariate ordinary least squares regressions with institutionalization as explanatory variable. n.s. = not significant (p > .05); PSM = propensity score matching.
*p < .05. **p < .01. ***p < .001.
Item Nonresponse
As Koch and Blohm (2009) emphasized in their analysis of item nonresponse, the specific type of item nonresponse matters and should make a difference in the analysis of missing values. Tables 10 and 11 in the Online Appendix (which can be found at http://smr.sagepub.com/supplemental/) show the average proportion of the different types of item nonresponse for the CASP and Big-Five items for the two different types of housing and the different PSM conditions.
For the CASP items, a large fraction of the missing values are system missing values, especially in institutions (roughly 10 percent). The majority of those cases can be explained with the dropout of respondents who relied on proxies in other parts of the survey interview in wave 6. Due to the malfunctioning routing mentioned above, Big-Five items and CASP items administered in wave 7 did not receive many “other missing” codes. For this wave, the large majority of proxy cases were recorded with a don’t know answer in both populations (see Table 11 in the Online Appendix, which can be found at http://smr.sagepub.com/supplemental/).
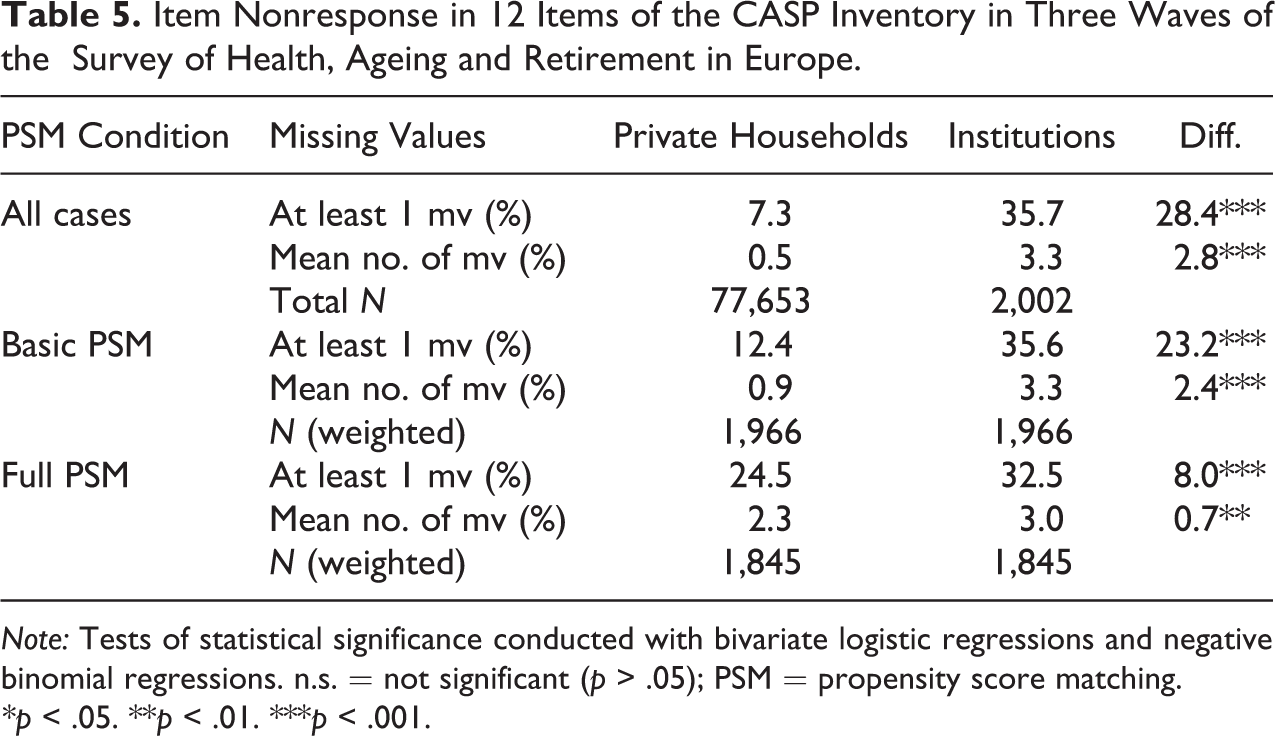
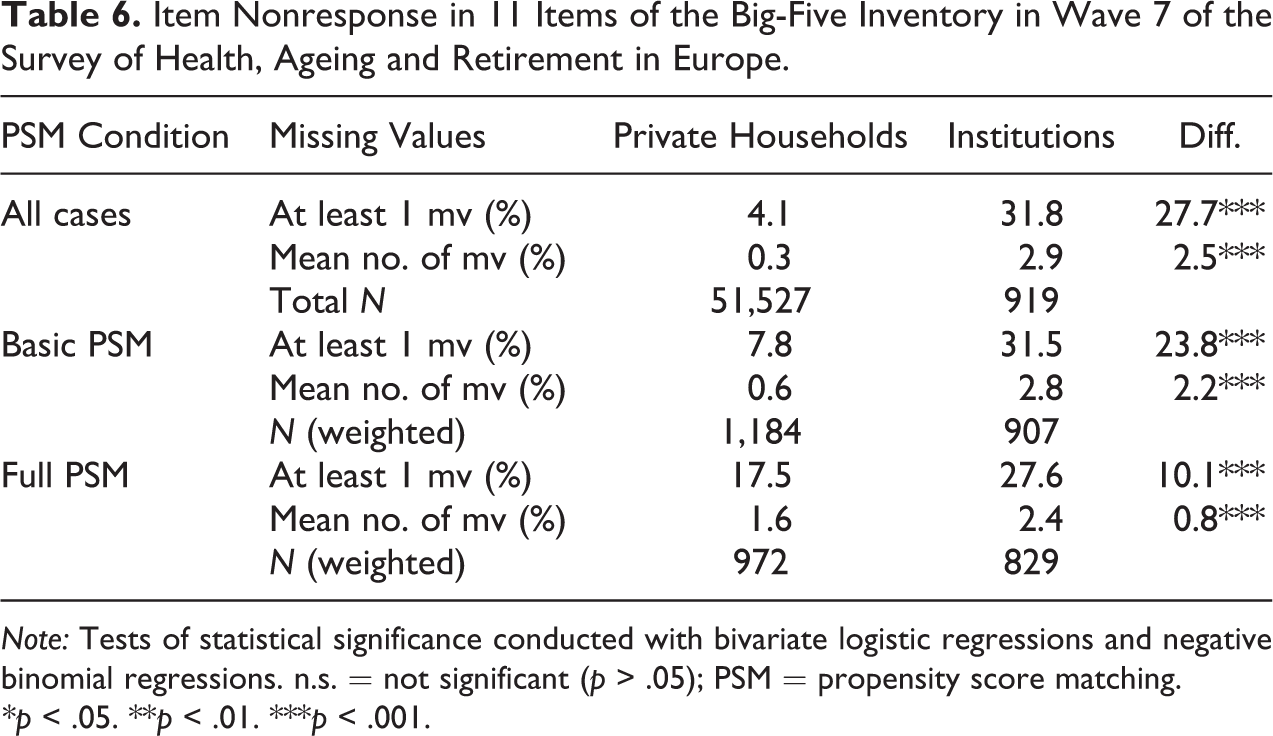
Since system missing values indicate that respondents were not capable to answer survey questions themselves, I decided to keep this code in the aggregate analysis of item nonresponse. Tables 5 and 6 show the share of respondents with at least one missing value for 12 CASP items and for 11 Big-Five items, respectively. Moreover, the tables also show the average number of missing values for both item batteries.
Item Nonresponse in 12 Items of the CASP Inventory in Three Waves of the Survey of Health, Ageing and Retirement in Europe.
Note: Tests of statistical significance conducted with bivariate logistic regressions and negative binomial regressions. n.s. = not significant (p > .05); PSM = propensity score matching.
*p < .05. **p < .01. ***p < .001.
Item Nonresponse in 11 Items of the Big-Five Inventory in Wave 7 of the Survey of Health, Ageing and Retirement in Europe.
Note: Tests of statistical significance conducted with bivariate logistic regressions and negative binomial regressions. n.s. = not significant (p > .05); PSM = propensity score matching.
*p < .05. **p < .01. ***p < .001.
In institutions, roughly every third respondent did not reply to a least one item in the CASP item battery. On average, 3.3 items of the 12 items were suffering from item nonresponse within this group of respondents. The equivalent numbers are much lower among the 77,653 respondents living in private households. A large majority of about 92.7 percent of the respondents did not have any missing values in the CASP items, on average only 0.5 items had a missing value. The gap in item nonresponse gets closer when respondents are matched on sociodemographic variables and health-related variables. The share of respondents in private households with a least one missing value nearly doubles when matching for sociodemographic variables, and it doubles again when adding health-related variables to the PSM. In the full PSM condition, 24.5 percent of all respondents living in private households had at least one missing values, which is still 8 percentage points less than their institutionalized counterparts. Again, the systematic dropout of certain institutionalized respondents in the matching leads to an improvement of this data quality indicator, namely, to a decrease of missing values in the institutionalized group.
For the Big-Five items, the overall level of item nonresponse is a bit lower compared to the CASP items. Apart from that, the pattern looks similar to Table 5. The size of the gap between both groups closes in the process of matching respondents, but its size is still large enough to be statistically significant. When matching on sociodemographic and health-related variables, item nonresponse for at least one item is more likely by about 57.7 percent in institutions. Institutionalized residents answer nearly one item less on average than comparable respondents living in private households. In both item batteries, a significant difference in the degree of item nonresponse persists even though the differences shrink markedly.
Hard-to-interview respondents who require information by proxies in other parts of the survey achieve a higher level of item nonresponse in both item batteries. The differences to all other respondents amount to four more missing items in private households (p = .00) and 2.5 more missing items in institutions (p = .00). Respondents with a better rating of their willingness abstain less often from replying in both item batteries (coeff. = −.89, p = .00 for the CASP items), while those respondents asking more often for clarification also achieve a higher average number of missing values in CASP and Big-Five items (coeff. = .43, p = .00 for the CASP items). As for the proxy indicator, differences for interviewer ratings are less distinct in institutions than in private households, even not statistically significant for the interviewer rating of asking for clarification. In private households, the impact of the three indicators gets also constantly smaller when matching respondents with their institutionalized counterparts. In the group of respondents who are more challenging to interview due to their age or health, even those respondents who are not using the support by proxy or are very willing to be interviewed still produce more missing values than respondents in the full sample.
Response Patterns in Big-Five Items
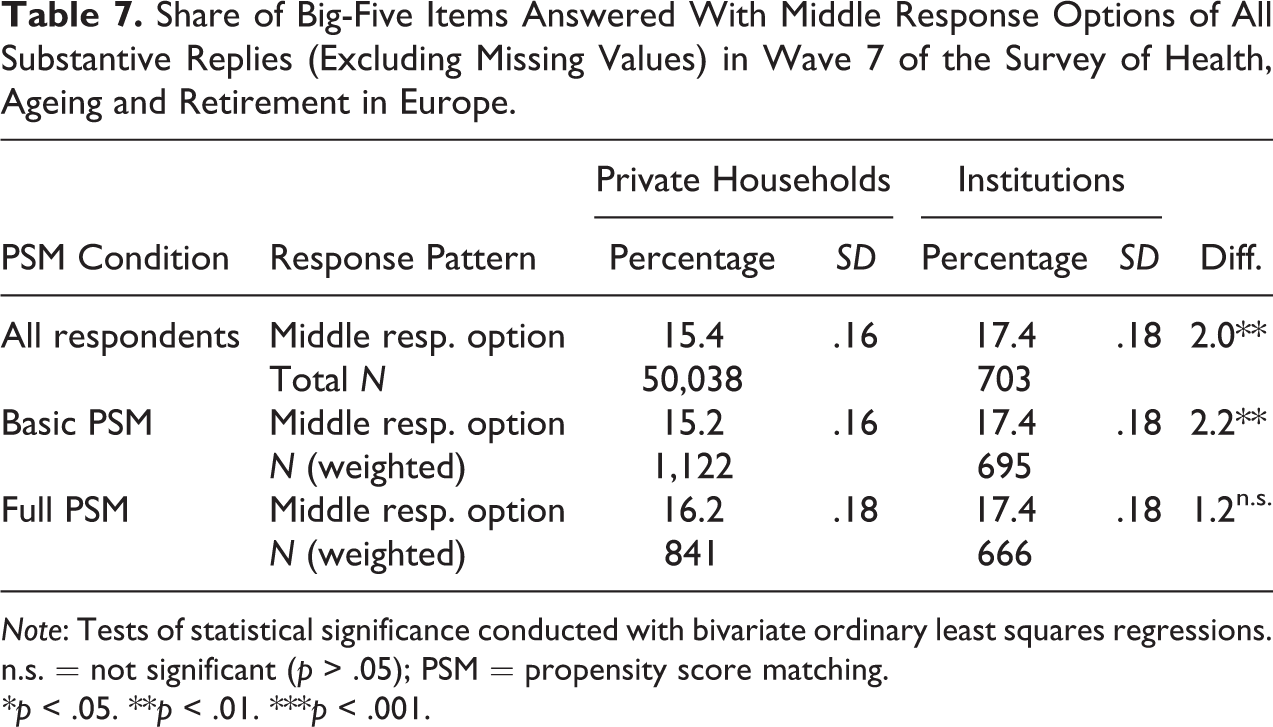
Before examining acquiescence in the Big-Five inventory, I briefly investigate the response patterns in this item battery in addition to item nonresponse. Table 7 and Table 12 (in the Online Appendix, which can be found at http://smr.sagepub.com/supplemental/) show the share of middle response options and strong agreements in 11 Big-Five items in relation to all substantive responses. Thus, items with missing values are excluded from the denominator.
Institutionalized respondents pick the middle response option more often than respondents living in private households (see Table 7). This difference amounts to nearly 2 percentage points and it is statistically significant (p = .001). The gap gets even bigger when matching respondents for sociodemographic variables, before shrinking when adding health-related variables to the set of sociodemographic variables in the PSM. In the full PSM condition, the difference between the two types of housing is not statistically significant any longer (p = .188).
Share of Big-Five Items Answered With Middle Response Options of All Substantive Replies (Excluding Missing Values) in Wave 7 of the Survey of Health, Ageing and Retirement in Europe.
Note: Tests of statistical significance conducted with bivariate ordinary least squares regressions. n.s. = not significant (p > .05); PSM = propensity score matching.
*p < .05. **p < .01. ***p < .001.
Looking at strong agreement and strong disagreement, institutionalized respondents tend to give more negative extreme responses (“strongly disagree”) in Big-Five items (results not shown). The difference in the respective proportion amounts to 1.2 percentage points in the full sample (p = .013) and gets smaller and statistically insignificant when matching respondents. On the other end of the response scale, institutionalized respondents use the “strongly agree” response option slightly less often than respondents living in private households: 18.4 Percent of all items answered by institutionalized respondents are answered with strong agreement, while this is the case for 19 percent of the items answered by respondents in private households (see Table 12 in the Online Appendix, which can be found at http://smr.sagepub.com/supplemental/). However, this difference is not statistically significant (p = .375), the same observation holds for the two matching conditions.
Respondents relying on proxy interviews in other parts of the survey interview tend to reply more often with middle response categories (coeff. = .07, p = .00) and less often with strong agreement (coeff. = −.03, p = .00). The same pattern can be observed for those respondents who ask more often for clarification, while respondents with a better rating of their willingness respond significantly less often with the middle response option in private households (coeff. = −.06, p = .00) and institutions (coeff. = −.05, p = .00). Notwithstanding a lack of further information about the underlying reasons for this response pattern, those results could lead to a cautious support of previous analyses on the background of middle response options (Alwin and Krosnick 1991; Sturgis et al. 2014), linking it to respondents who are more difficult-to-interview in institutions and private households. In the Big-Five items, it is used more often by institutionalized respondents and by older respondents with a worse health condition.
Acquiescence and Factor Structure in the Big-Five Inventory
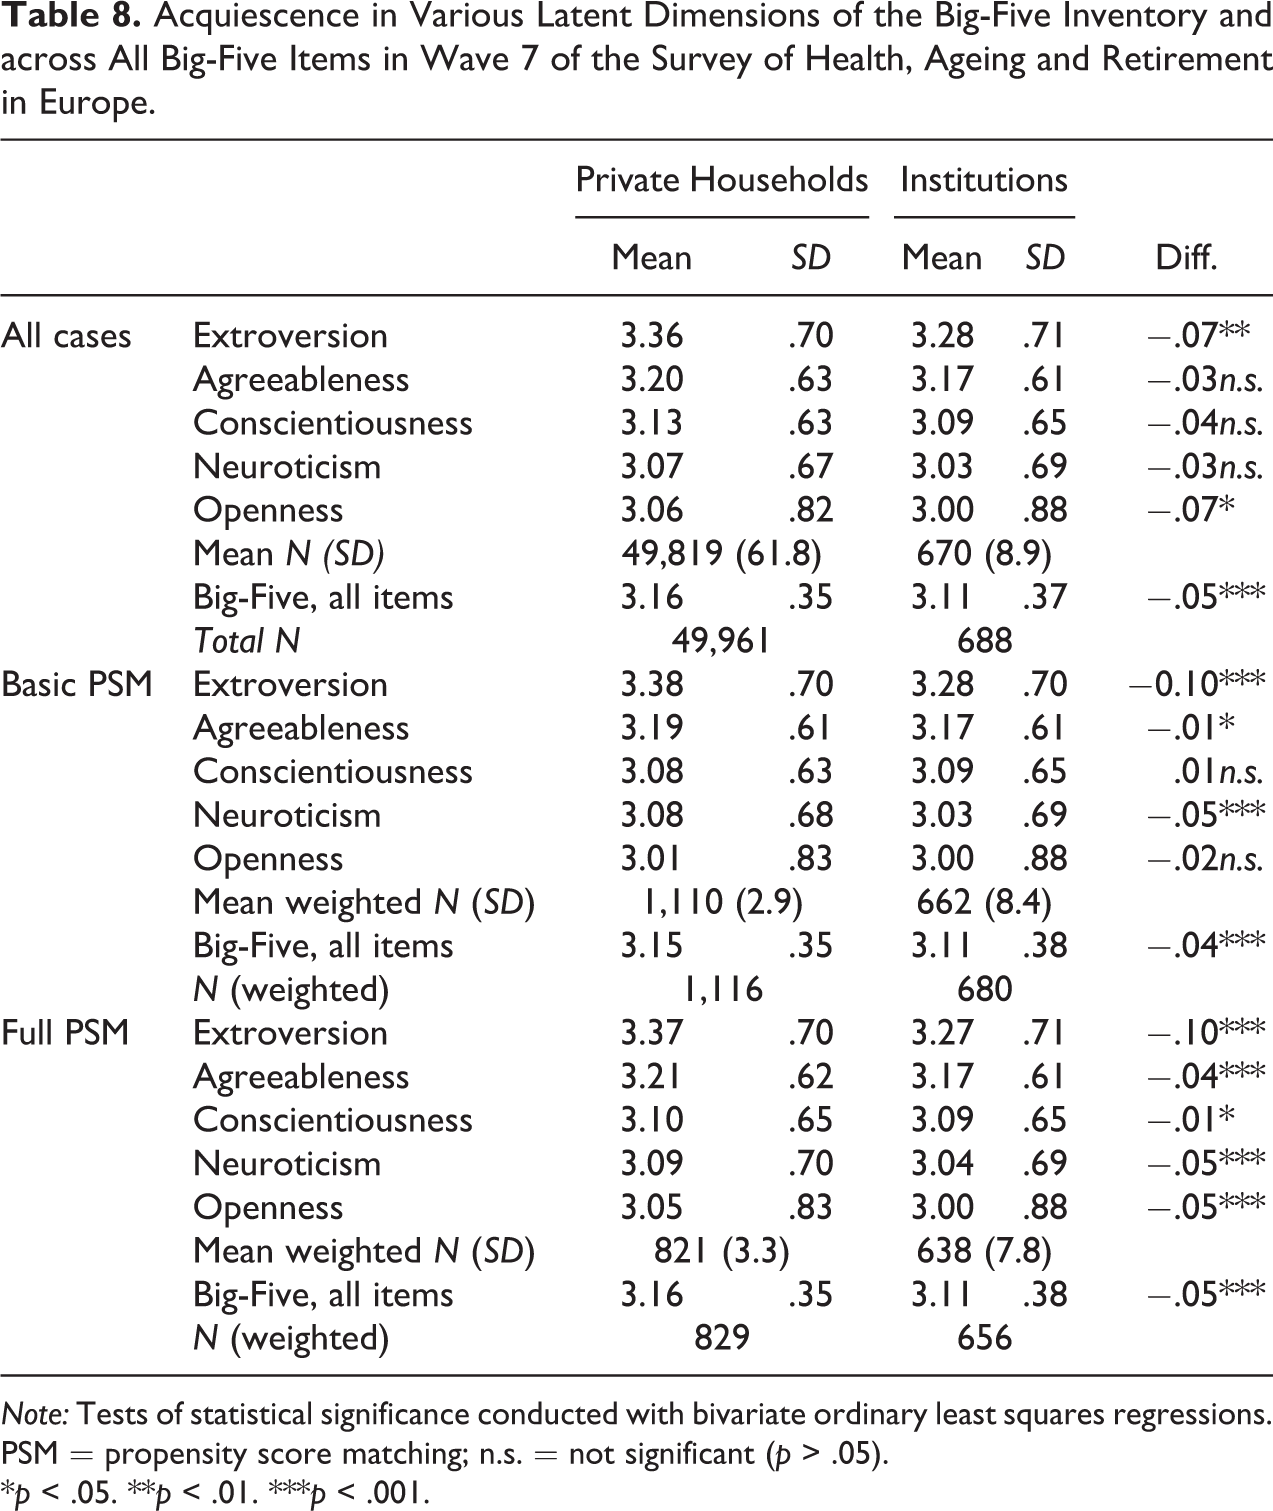
Similar to earlier studies, I use the Big-Five inventory to check for acquiescence as another behavior leading to a worse data quality (Rammstedt et al. 2010; Rammstedt and Kemper 2011; Soto et al. 2008). Table 8 shows a simple measure of acquiescence with values higher than 3.0 indicating acquiescence. A comparable level of acquiescence can be found in the Big-Five items in SHARE as in previous analyses of this item battery (Rammstedt et al. 2010; Rammstedt and Kemper 2011; Soto et al. 2008). Moreover, somewhat surprisingly it is more prevalent in private households than in retirement and nursing homes. The extent of acquiescence differs across the different Big-Five dimensions, with the highest degree of acquiescence for two items measuring extraversion and two items measuring agreeableness. Those differences in acquiescence between domains could be caused by different living circumstances, namely, if certain concepts do not apply to respondents’ lives or by comprehension issues (Soto et al. 2008). However, both explanations would rather lead to the hypothesis that institutionalized respondents with their more special living circumstances and larger comprehension issues (see Table 3) show a more acquiescent response behavior. This is apparently not the case.
Acquiescence in Various Latent Dimensions of the Big-Five Inventory and across All Big-Five Items in Wave 7 of the Survey of Health, Ageing and Retirement in Europe.
Note: Tests of statistical significance conducted with bivariate ordinary least squares regressions. PSM = propensity score matching; n.s. = not significant (p > .05).
*p < .05. **p < .01. ***p < .001.
In contrast to all previous indicators of data quality analyzed in this article, acquiescence does not change when running through the two stages of PSM. Significant differences between institutionalized respondents and respondents living in private households do not get smaller when matching for sociodemographic variables and even when adding health-related variables.
Thus, earlier conclusions regarding mixed results of acquiescence (Roberts et al. 2019) can be cautiously confirmed in the present analysis. Apparently, acquiescence is independent from respondents’ ability as measured by age, gender, widowhood, education, dementia, self-rated health, and limitations in ADLs. Even when controlling for those variables, institutionalized residents show a more desirable respondent behavior than their counterparts in private households. Interestingly, the hard-to-interview indicators exert the opposite influence on acquiescence compared to earlier findings for item nonresponse and response patterns. Respondents with proxy interviews in other parts of the interview achieve a lower level of acquiescence (coeff. = −.05, p = .00), while respondents with a better rating of their willingness have a slightly stronger tendency for acquiescence (coeff. = .04, p = .00). The less pronounced motivation in institutions (see Table 4) does not lead to a more acquiescent response behavior. Respondents asking more often for additional clarification have a slightly smaller level of acquiescence (coeff. = −.02, p = .00). Due to the small effect size, the latter indicator is not statistically significant in institutions.
Which factors could explain the persisting gap in acquiescence between the two types of housing? First, the higher item nonresponse among institutionalized respondents causes the exclusion of the most critical respondents (cf. Table 6). Second, the higher share of midpoints among the group of institutionalized respondents leads to a mean value closer to 3.0. While both explanations are certainly true, they do not explain why the gap between institutions and private households remains as it is throughout the PSM, while the gaps in item nonresponse and selection of midpoints get much smaller. Thus, the lower acquiescence in institutions could be also explained with the housing situation as such or—more likely—with additional confounding variables I did not control for or that were not measured by SHARE. Referring to earlier research, this could be a psychological trait to agree to statements to be perceived more positively by interviewers, a lower cognitive interest in answering the questions properly (satisficing), or interviewer effects (Olson and Bilgen 2011). In other words, institutionalized respondents may be a little less worried about the opinions that interviewers might form about them while conducting the interview. The lower acquiescence among hard-to-interview respondents could point in the same direction.
The analysis of the factor structure of the Big-Five items sheds a light at the impact of acquiescence on the survey data. Table 9 shows the results of a principal component factor analysis with a varimax rotation for 10 items of the Big-Five inventory. Each block refers to one of the three configurations of the PSM.
Principal Component Factor Analysis (Varimax Rotated) of Big-Five Items (Not Corrected for Acquiescence).
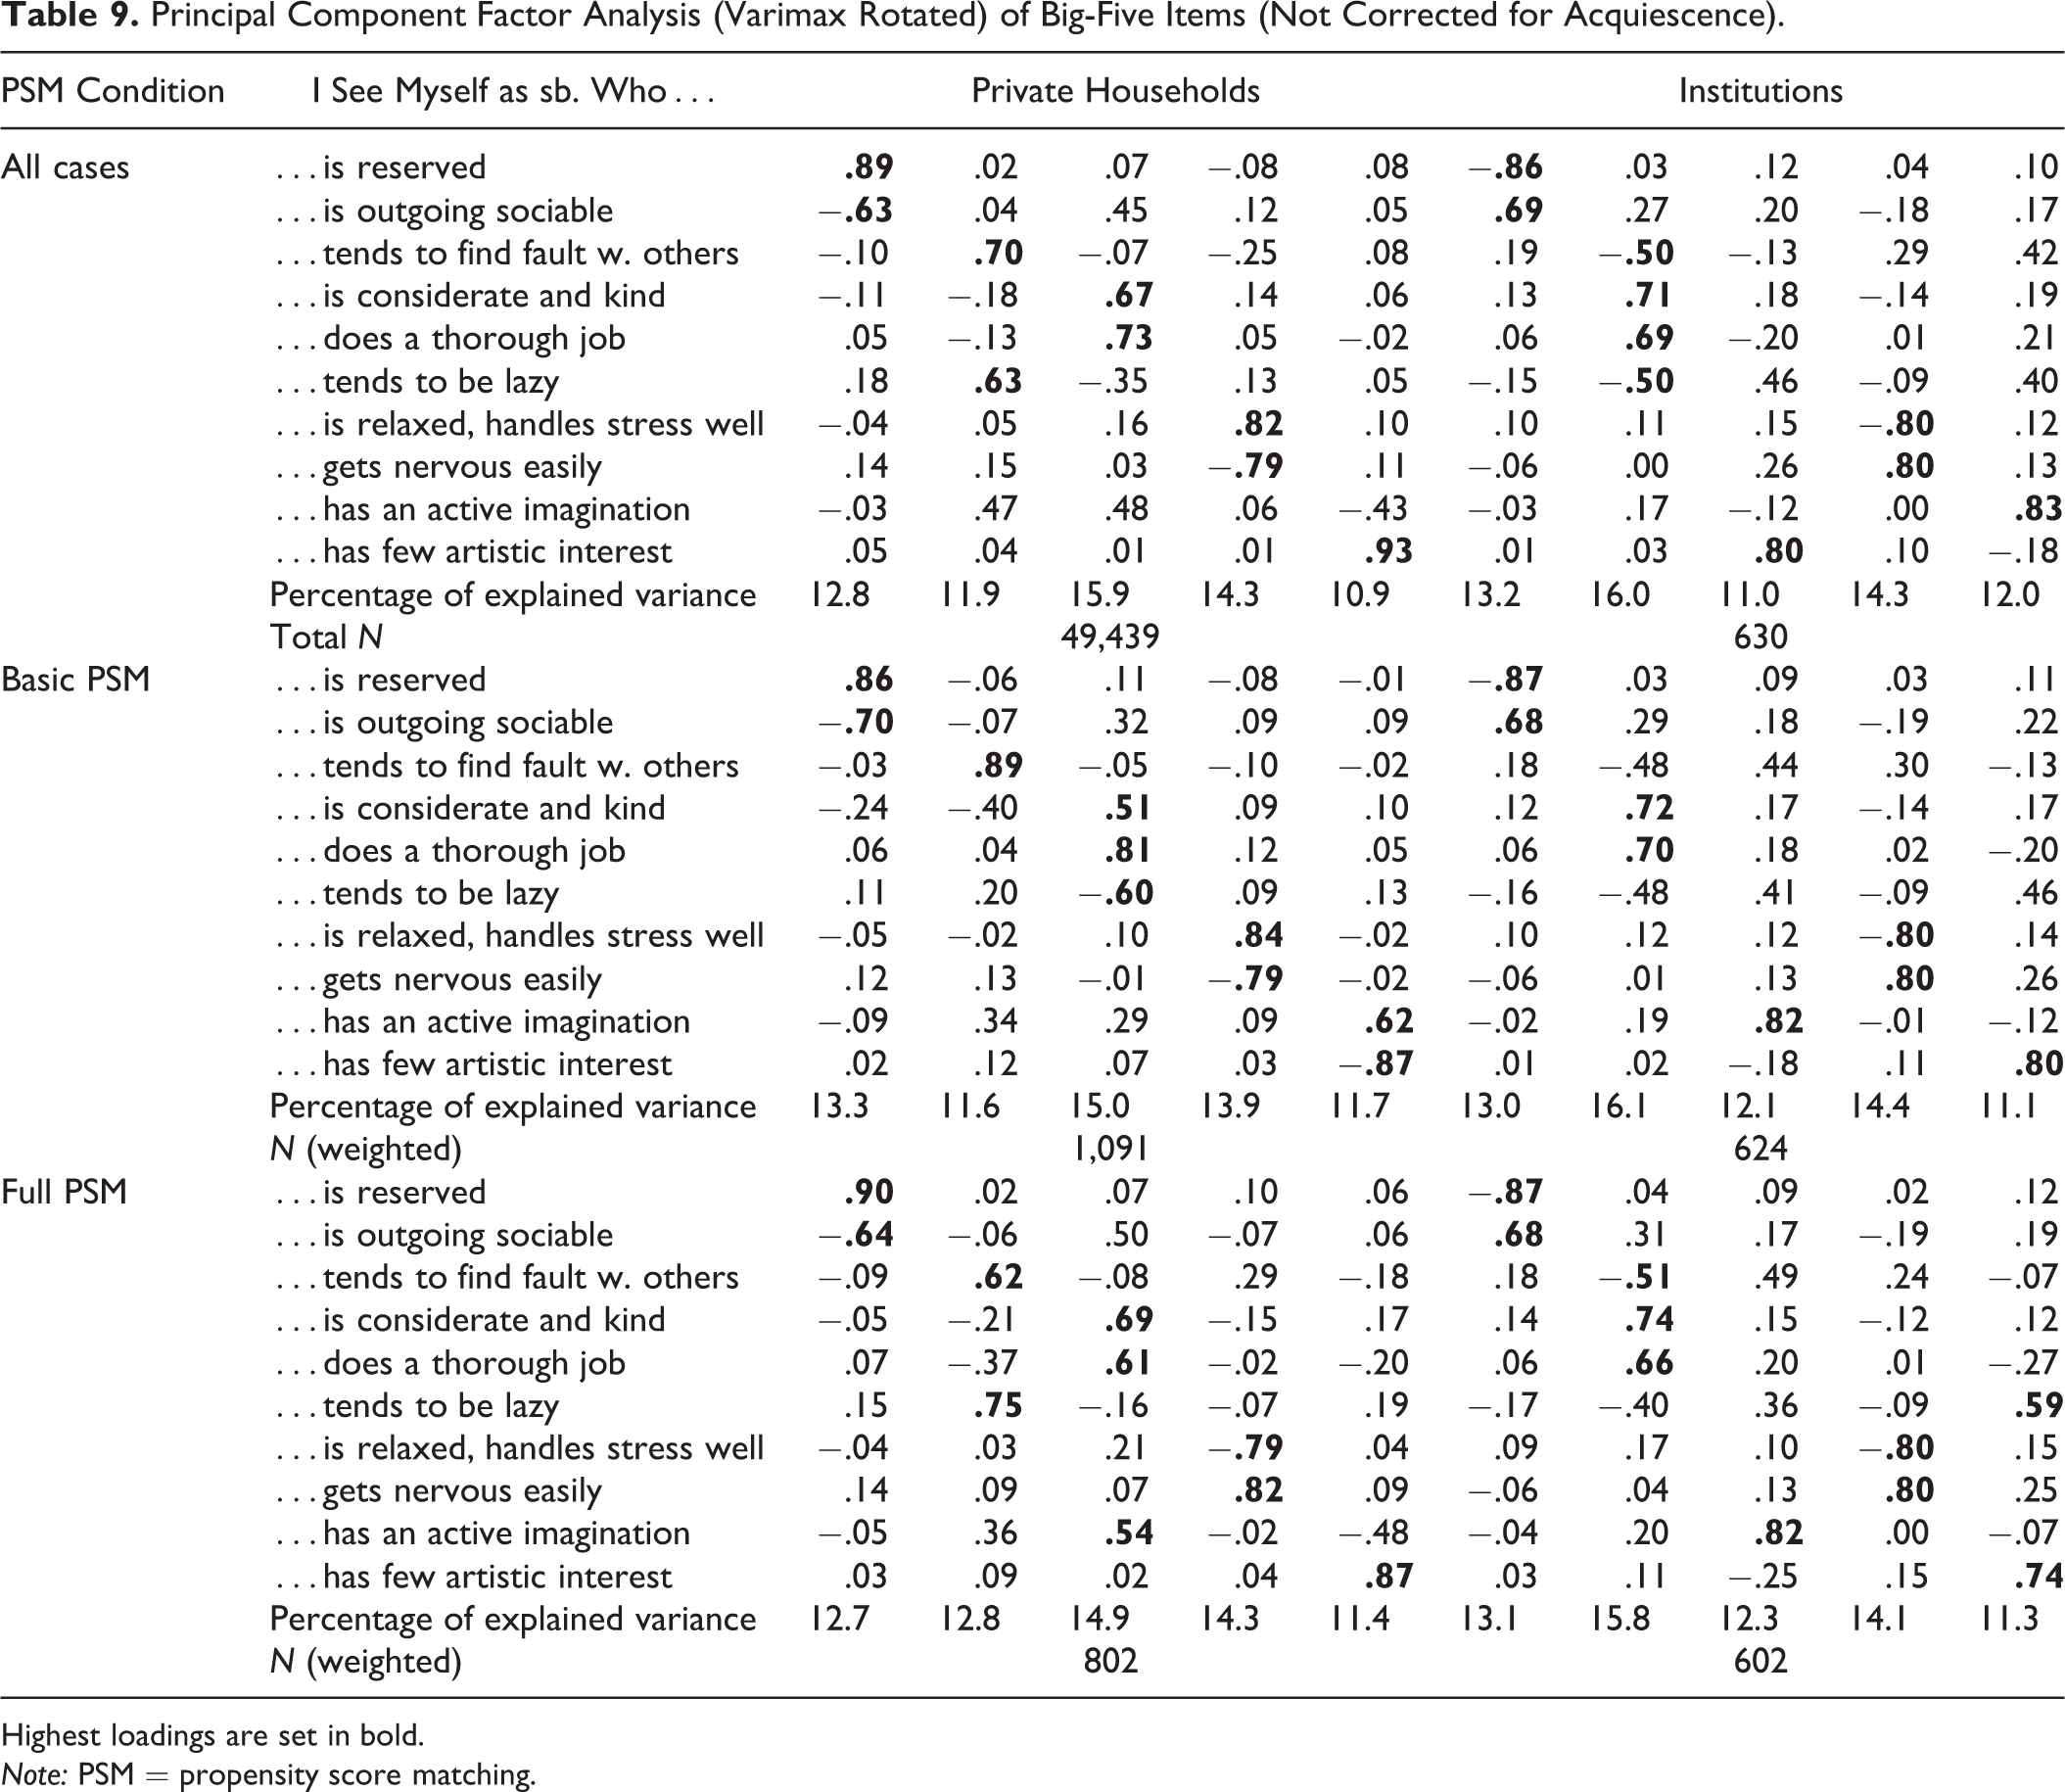
Highest loadings are set in bold.
Note: PSM = propensity score matching.
Relying on the Kaiser criterion requesting an eigenvalue higher than 1 to be considered as a distinct factor, the factor analysis would only suggest the extraction of four factors for respondents living in private households in all the three conditions (cf. Rammstedt and Kemper 2011). The fifth factor only reaches eigenvalues between 0.95 and 0.9. In contrast, the extraction of five factors is suggested for institutionalized respondents. For the purpose of comparability and in the light of the well-established theory of the concept, I nevertheless extract five factors for private households. Table 9 shows the factor loadings for the Big-Five items that are not corrected for acquiescence. In both populations, only the extroversion and neuroticism items load as expected and form their discrete latent dimensions. In private households, the openness items also load nearly as expected, whereas those two items load on different latent dimensions in institutions. The two dimensions, agreeableness and conscientiousness, are muddled with cross-loadings and do not form distinct dimensions in both populations. Ambiguous factor loadings were also found in earlier studies for those Big-Five items (Lechner and Rammstedt 2015; Rammstedt and Kemper 2011).
The changes in the factor structure following the PSM can be considered as minor. For institutionalized respondents, the factor structure and the strength of factor loadings does not change substantially. For private households, changes are a bit stronger for some of the items; however, this can probably be explained with the reweighting of cases in the course of PSM. The factor structure as such does not undergo drastic changes. The total share of explained variance remains very stable (65.8 percent with all cases compared to 66.1 percent in the full PSM). Like for the analysis of acquiescence presented in Table 7, the variables used for matching do not have a strong impact on the Big-Five factor structure and related measurement error.
Does the acquiescence lead to the blurred factor structure? Table 9 does not control for acquiescence as suggested by Rammstedt and Kemper (2011). This is done in a second step by ipsatizing the data. The overall mean of a respondent is subtracted from each of the Big-Five items to account for the response tendency. The result of the subtraction is divided by respondents’ SD. Indeed, the factor analysis for the ipsatized Big-Five items clearly results in the factor structure as predicted by the theory (results not shown). This suggests a strong impact of acquiescence on the Big-Five items.
Summarizing the results for the two populations, acquiescent response behavior is significantly less prevalent in institutions than in private households, even when comparing institutions to private households while applying PSM. The factor structure in the Big-Five inventory is negatively affected by acquiescence in both populations. It is rather difficult to conclude whether the factor structure is closer to the theory in institutions or private households. Apparently, the number of factors is more in line with the theory in institutions than in private households, where only four instead of five factors should have been extracted. However, the factor loadings of items do not show any distinct advantage of the theory in institutions as compared to private households.
Conclusion
This article investigated whether institutionalized residents are more difficult to interview than respondents living in private households. This claim is often made by survey researchers, usually followed by an exclusion of this group from the target population in many social surveys. Difficulties to interview institutionalized residents can be expected due to their higher age, a larger number of cognitive and functional impairment, and a worse health condition. However, those characteristics are not unique to institutionalized residents but can also be observed in private households. This article aimed to answer the research questions whether institutionalized respondents perform worse in survey interviews and whether institutionalization as such leads to a worse quality of survey data or whether it can be rather explained with confounding variables.
As there is not the one indicator for bad or good response behavior, I compiled evidence on a number of different indicators to get a good overview of difficulties in survey interviews and the data quality. I made use of interviewer observations of respondents’ performance, compared the rate of proxy interviews in private households and institutions, analyzed item nonresponse in two item batteries, and also had a look at the response patterns and acquiescence in the Big-Five inventory. To isolate the impact of institutionalization, I used PSM to identify respondents in private households who bear a greater resemblance with institutionalized residents than the entire SHARE sample of respondents aged 50 years or older. In a first step, I matched respondents on age, gender, education, and widowhood. In a second step, I added dementia, the self-rated health of respondents, and the number of limitations in ADLs to the set of variables used for matching. The large number of cases in 18 European countries and Israel allowed for excellent matches with very few discarded observations.
This analysis comes with a number of limitations. A little less than 8 percent of institutionalized respondents could not be matched in the full PSM due to missing values in the variables used as predictors and some additional observations without control cases within the borders of the caliper. In the less elaborate, basic PSM only using sociodemographic variables less than 2 percent of institutionalized dropped out. The dropout of those cases is not random but systematic, as the results show. When comparing response behavior and quality indicators for all institutionalized respondents with the matched institutionalized respondents, an improvement in most indicators can be observed. Hence, the impact of systematic dropouts can be quantified, but we should be cautious whenever interpreting the degree of differences between the two types of housing and related statistical significance.
As a second limitation, SHARE most probably conducts interviews with a selective subset of elderly respondents. In the first wave of SHARE, the group of institutionalized respondents might be underrepresented due to undercoverage or noncoverage in sampling frames (Bergmann et al. 2019). The survey loses potentially hard-to-interview respondents due to nonresponse in the first wave and panel attrition in the following waves, especially in the oldest age cohort (Bergmann et al. 2019). It is difficult to quantify the resulting bias, since external benchmark data would be required. Even though the implementation of proxy interviews is likely to reduce the extent of nonresponse bias, I am certainly missing nonrespondents, potentially those with even larger difficulties in the interview. This applies to institutions and private households.
Coming to a conclusion, institutionalized respondents are indeed harder-to-interview than respondents in private households on average. In line with my first hypothesis, they require proxy interviews more often than respondents in private households, they are depicted as less motivated by their interviewers, need additional clarification more often than respondents living in private households, generate a larger number of missing values in two item batteries, and picked the middle response option more often than respondents living in private households. Those results are mostly in line with the perceptions of survey researchers experienced with research in institutions for the elderly (Schanze and Levinson 2019). The indicators of hard-to-interview response behavior also result in different response patterns and lower data quality, increasing the overall number of missing values and the share of midpoints in Big-Five items.
Nevertheless, three outcomes of this article should be mentioned to arrive at a more differentiated conclusion: First of all, as suggested by my second hypothesis, the analysis shows that institutionalized respondents are less particular when comparing them to respondents in private households who are more alike in a number of ways. Sociodemographic characteristics can only explain a small fraction of data quality issues. When comparing institutions and private households while controlling for sociodemographic and health-related variables, differences in indicators of data quality between the two populations get very small and less often statistically significant. A certain group of residents in private households is nearly as difficult to interview as institutionalized residents.
Secondly, acquiescence seems to be less of a problem in institutions than in private households, even though ability and motivation tend to be lower here than in private households. Apparently, institutionalized respondents feel less inclined to present themselves in a more positive light. The variables used in the PSM could not help to explain differences in the degree of acquiescence. Acquiescence led to a blurred factor structure in the Big-Five inventory with marginal differences between the two types of housing. Only in private households, the Kaiser criterion would demand the extraction of four instead of five dimensions, while results in institutions are in line with the theory. Those findings, as well as the unexpectedly reverse impact of hard-to-interview indicators, would very much call for further research on this quality indicator.
As a third observation, a generic hard-to-interview label for all institutionalized residents would be seriously misleading. Two of the three institutionalized residents did not require a proxy interview, and every second institutionalized respondent was rated as very willing to answer by the interviewers. The data quality in institutions is comparable to private households with similar basic characteristics. In addition to a lower acquiescence in nursing homes, between 65 and 70 percent of institutionalized residents did not have any missing values in Big-Five or CASP items. A small-scale study in nursing homes in Vienna, Austria, also came to the conclusion that two-thirds of all institutionalized residents could be interviewed (Lang 2014), especially when adapting survey instruments to account for aging-related requirements and cognitive impairment (Fox et al. 2007; Lenzner 2012; Sangl et al. 2007; Schanze and Levinson 2019). Once a sample has been drawn and access and cooperation has been secured, it is indeed possible to conduct survey interviews with residents in institutions for the elderly.
Supplemental Material
Supplemental Material, sj-docx-1-smr-10.1177_0049124121995534 - Response Behavior and Quality of Survey Data: Comparing Elderly Respondents in Institutions and Private Households
Supplemental Material, sj-docx-1-smr-10.1177_0049124121995534 for Response Behavior and Quality of Survey Data: Comparing Elderly Respondents in Institutions and Private Households by Jan-Lucas Schanze in Sociological Methods & Research
Footnotes
Declaration of Conflicting Interests
The author(s) declared no potential conflicts of interest with respect to the research, authorship, and/or publication of this article.
Funding
The author(s) received no financial support for the research, authorship, and/or publication of this article.
Supplemental Material
Supplemental material for this article is available online.
Notes
References
Supplementary Material
Please find the following supplemental material available below.
For Open Access articles published under a Creative Commons License, all supplemental material carries the same license as the article it is associated with.
For non-Open Access articles published, all supplemental material carries a non-exclusive license, and permission requests for re-use of supplemental material or any part of supplemental material shall be sent directly to the copyright owner as specified in the copyright notice associated with the article.