
Abstract
The quality of data in surveys is affected by response burden and questionnaire length. With an increasing number of questions, respondents can become bored, tired, and annoyed and may take shortcuts to reduce the effort needed to complete the survey. In this article, direct evidence is presented on how the position of items within a web questionnaire influences respondents’ focus of attention. In two experiments, part of an eye-tracking study and an online survey, respectively, a variety of indicators show that data quality is lower if the experimental question is positioned at the end rather than at the beginning of a questionnaire. Practical implications are discussed.
Introduction and Background
In survey research, it is of utmost significance that survey responses are accurate and of high data quality, that is, valid, reliable, and unbiased (Fowler 2013; Fowler and Cannell 1996; Schober and Conrad 1997). According to the question–answer process, respondents are required to go through the following complex cognitive processes while answering (Tourangeau, Rips, and Rasinski 2000): Respondents must comprehend the question, retrieve information, make a judgment, and give a response. High-quality data can only be expected when respondents engage in all four steps of question answering (termed optimizing). Satisficing, in contrast, is characterized by respondent behavior that does not intend to address one or even more of the four stages thoroughly, but to take shortcuts to reduce the effort needed; for instance, by not differentiating among response options, selecting non-substantive answers like “don’t know,” or rushing through surveys (Krosnick 1991; Krosnick and Alwin 1987; Zhang and Conrad 2014).
The likelihood of satisficing depends on task difficulty (e.g., question difficulty), respondents’ cognitive ability, and respondents’ motivation (Biemer and Lyberg 2003; Cannell, Miller, and Oksenberg 1981; Groves et al. 2009; Krosnick 1991; Schwarz and Hippler, 1991). Survey satisficing is thus fostered by survey (design) characteristics that are likely to increase the burden of responding, hence reducing data quality. Or to put it differently: If the respondent burden can be conducive to motivating optimization when answering questions, then eliminating or lowering that burden might mitigate satisficing, and thus increase data quality. One such survey design property is survey length and, related to the overall length of a survey, the position of a question in the questionnaire.
In previous research, respondent burden has often been measured in terms of the time it takes to complete the questionnaire. It has been shown that respondent burden increases with questionnaire length, while respondent motivation decreases (Groves et al. 1999; Singer et al. 1999). The perceived burden indicated by the announced survey length, for example, influenced whether respondents were willing to take part in a survey (Galesic and Bosnjak 2009; Hansen 2007). Respondents were also more likely to answer “no” to questions that allowed them to skip following questions and thus to save time (Shields and To 2005). Apart from effects on unit and item nonresponse, the effect of survey length on data quality in later parts of the survey is also a worrying factor to be considered. Items placed later in a questionnaire may additionally be affected by respondents’ increased fatigue: Their experienced burden might increase with every preceding question (Galesic 2006). Thus, questions that are positioned at the end of a questionnaire may be processed differently than questions that are asked at the beginning of a survey (Helgeson and Ursic 1994). Previous research regarding question placement effects—whether earlier or later in a questionnaire—on data quality is mixed, and mostly based on indirect indicators of measurement error (Peytchev and Peytcheva 2017). Clancy and Wachsler (1971) did not find increased tendencies of “yes-saying” (which was used as proxy for boredom) or willingness to report socially undesirable behaviors when questions were asked at the end of a 25-minutes questionnaire, rather than at the beginning, and no other effects which could conceivably be ascribed to boredom (such as “don’t know” answers). Sudman and Bradburn (1974) reported that the position of a question had little (for behavioral questions) or negligible effects (for attitudinal questions). Johnson, Sieveking, and Clanton (1974) found that college students gave fewer responses to open-ended questions when they were asked towards the end of the survey. In contrast, the results of a study of Burchell and Marsh (1992) pointed in the opposite direction, with more responses at the end of a lengthy questionnaire. Several other studies have found that data quality was lower for questions positioned later in a questionnaire compared to the same items placed earlier. These studies reported higher rates of missing data and “don’t know” answers, greater tendencies to respond with agreement, shorter answers to open-ended questions, shorter response times, or less differentiation among items (also called “straightlining”) when they appeared later in a questionnaire (Galesic and Bosnjak 2009; Herzog and Bachman 1981; Krosnick et al. 2002), as well as lower criterion validity (Peytchev and Peytcheva 2017). However, in most of these studies, findings are based on indirect indicators for respondent burden and data quality.
In this study, eye-tracking methodology was used as a more direct indicator of respondent burden to analyze differences in the depth of information processing (Galesic et al. 2008; Galesic and Yan 2011). Eye-tracking allows researchers to observe respondents’ eye fixation patterns: which words are fixated, how long are they fixated, and the sequence of fixations (Romano Bergstrom and Schall 2014). These measures can be used to understand the underlying comprehension processes (Just and Carpenter 2018) and to examine whether there are differences in the depth of information processing and attention depending on the position of a question within a survey.
Research Questions
The following research questions are addressed: What effects do variations in question positioning within the questionnaire have on data quality? Does the positioning influence depth of processing? Will a question positioned at the end of a questionnaire receive the same amount of attention as it will at the beginning?
The following hypotheses are postulated:
Specifically, I expect that item response rates, response times, and differentiation of responses to items will be lower if the question is positioned at the end of the questionnaire, when compared to asking it at the beginning. Furthermore, I expect that the eye-tracking measures of cognitive effort and attention will be lower if the question is positioned at the end of the questionnaire compared to asking it at the beginning, when comparing how much time respondents spend looking at the question.
Experiment 1
Data and Experimental Design
The first experiment was embedded in a laboratory eye-tracking study (N = 131) which was conducted at GESIS—Leibniz Institute for the Social Sciences in Mannheim (Germany) in April and May of 2017. In total, 131 respondents (50 percent female, 65 percent between 18 and 34 years old, 22 percent between 35 and 54 years old, 13 percent 55 years or older, 29 percent with 10 years of schooling or less, and 71 percent with at least 12 years’ schooling) participated in the study. Respondents were recruited from the respondent pool maintained by the institute or by word of mouth with quotas for sex. No quotas for age and education were set, but it was intended to obtain a sample as diverse as possible. Respondents answered the web survey while their eye movements were tracked with a Senso Motoric Instruments (SMI) RED250 mobile Eye Tracker, which is a mobile device that was mounted on the bottom frame of a 17″ TFT monitor (resolution 1280x1024). At the beginning of the questionnaire, all respondents answered two warm-up questions, which were used to calculate their fixation and reading rate. These measures were later used as covariates in the statistical analyses of fixation count and fixation time to control for interindividual differences. The questionnaire included several unrelated experiments with questions on a variety of topics such as politics, social inequality, media use, health, and personality traits. All respondents received a compensation of €20.
To examine the effect of question positioning on the quality of responses, I used a scale on impulsive behavior (Kovaleva et al. 2014; Whiteside and Lynam 2001) consisting of eight rating scale items. Two items each measure one of the four different constructs of impulsive behavior: urgency, (lack of) premeditation, (lack of) perseverance, and sensation seeking. The question was presented in a grid question format. Respondents answered the question using a fully -labeled five-point unipolar agreement scale ranging from “doesn’t apply at all” to “applies fully.” The question wording (in English and German) can be found in Online Appendix A (which can be found at http://smr.sagepub.com/supplemental/).
A between-subject design was used with random assignment of respondents to two experimental conditions. Half of the respondents answered the experimental question at the beginning of the survey, directly after the two warm-up questions. The other half answered the question at the end of the survey before the sociodemographic variables. Up to that point, the average completion time was approximately 30 minutes. During web survey completion, respondents’ eye movements were tracked. Bivariate analyses on sex (χ2 = 1.72; df = 1; p = .19 ), age (χ2 = .097; df = 2; p = .95), and education (χ2 = 2.38; df = 2; p = .30) indicated that the randomization of respondents to the experimental conditions had been successful.
Method
To test the effect of question positioning on the quality of responses, differences in means and proportions for the following indicators were compared.
Item nonresponse
Item nonresponse is defined as missing information (gaps) in a data set, that is, the proportion of respondents giving no response to an item.
Response differentiation (Straightining)
Response differentiation reflects the extent to which respondents differentiate in their answers to the eight items (response variation). Nondifferentiation occurs when respondents do not differentiate in their responses but give (nearly) identical responses to all items. The indicator probability of differentiation Pd
is calculated according to Krosnick and Alwin (1988) as
Response time
Response times are measured in milliseconds using a client-side paradata script (UCSP, Kaczmirek 2005).
Cognitive effort and attention
To analyze potential differences in the cognitive effort and attention invested by respondents, the eye-tracking metrics fixation time and fixation count are used as indicators. Eye tracking is used to record the respondents’ eye movements while they answer an online questionnaire on a computer. Eye-tracking enables us to examine respondents’ attention and cognitive processing for specific parts of the question. The connection between eye movements and cognitive processing is based on the immediacy assumption and the eye–mind assumption (Just & Carpenter, 1980). These two assumptions state that eye movements provide direct information about what respondents are currently processing and how much cognitive effort is involved. To analyze their eye movements, so called “areas of interest” (AOIs) are defined, for which the eye-tracking metrics fixation time and fixation count can be calculated. Fixation time is the total duration of fixations on a respective AOI. Fixation count is the total number of fixations on a specific AOI. I defined six different AOIs: one covering the whole question, one covering the question text, one covering the input fields, one covering the item texts of all eight items, and two covering the first half and the second half of the item list, respectively (see Figure 1 in Online Appendix B [which can be found at http://smr.sagepub.com/supplemental/]). Following the assumptions outlined above, the time spent fixating on an AOI reflects the time on processing that area (Just and Carpenter, 1980). Consequently, longer fixation duration can be interpreted as deeper processing of that area of the question (Craik 1999; Joos, Rötting, and Velichkovsky 2003). Due to technical difficulties or poor recording quality, the eye-tracking data of eleven participants (8.4 percent) had to be excluded from the analysis.
Response means
For each of the eight items, I additionally tested whether the means between the early positioning and the late positioning condition differed significantly.
All statistical analyses were performed with SPSS 24. To compare response differentiation, response times, and response means, analyses of variance (ANOVAs) were conducted. For response means, a Bonferroni adjustment for multiple comparisons was applied. To analyze the eye-tracking metrics fixation time and fixation count, analyses of covariance (ANCOVAs) were conducted with reading rate and fixation rate as covariates to control for interindividual differences.
Results
With regard to item nonresponse, the analyses showed that all respondents answered all eight items and no item nonresponse occurred at all. Comparing the degree of response differentiation, respondents in the early positioning condition differentiated significantly more in their answers (M Early = .641) compared to respondents receiving the items at the end of the questionnaire (M Late = .599; F(1, 130) = 4.451; p = .037). Respondents also took markedly more time to answer the items when they were asked early in the questonnaire (M Early = 60.88) than when they were presented at the end of the questionnaire (M Late = 45.99; F(1, 130) = 16.815; p < .001). Finally, I investigated how much cognitive effort and attention respondents were willing to invest when answering the scale on impulsive behavior. In line with the second hypothesis, Table 1 shows that respondents took more time to answer the complete question when it was presented at the beginning of the questionnaire than when it was positioned late in the questionnaire (F(1, 119) = 9.429, p = .003). When the question was further distinguished into the areas of the question text and the items, Table 1 shows that respondents took more time to read the question text (F(1, 119) = 18.551 , p < .001) and to answer the question on the input field (F(1, 119) = 5.881, p = .017) when it was presented early rather than late. Fixation times on the area of the eight items were not significantly different across conditions (F(1, 120) = 3.059 , p = .083). Considering fixation count, respondents fixated more on the whole question (F(1, 119) = 7.909, p = .006), on the question text (F(1, 119) = 17.417, p < .001), and on the list of items (F(1, 119) = 4.149, p = .044), when it was presented early rather than late. To further investigate whether item placement has an effect on the processing time, I distinguished the list of items into two halves, and compared the fixation time spent on the first and the second half of the list of items. The findings showed that the differences in fixation time and count were not significant for the first four items [Time: F(1, 119) = 1.107, p = .295); Count: (F(1, 119) = 1.907, p = .170)], but for the second half of items [(Time: F(1, 119) = 4.967, p = .028); Count: (F(1, 119) = 6.205, p = .014)].
Means and Standard Errors (in parentheses) of Fixation Time and Count for the Scale of Impulsive Behavior across Conditions.
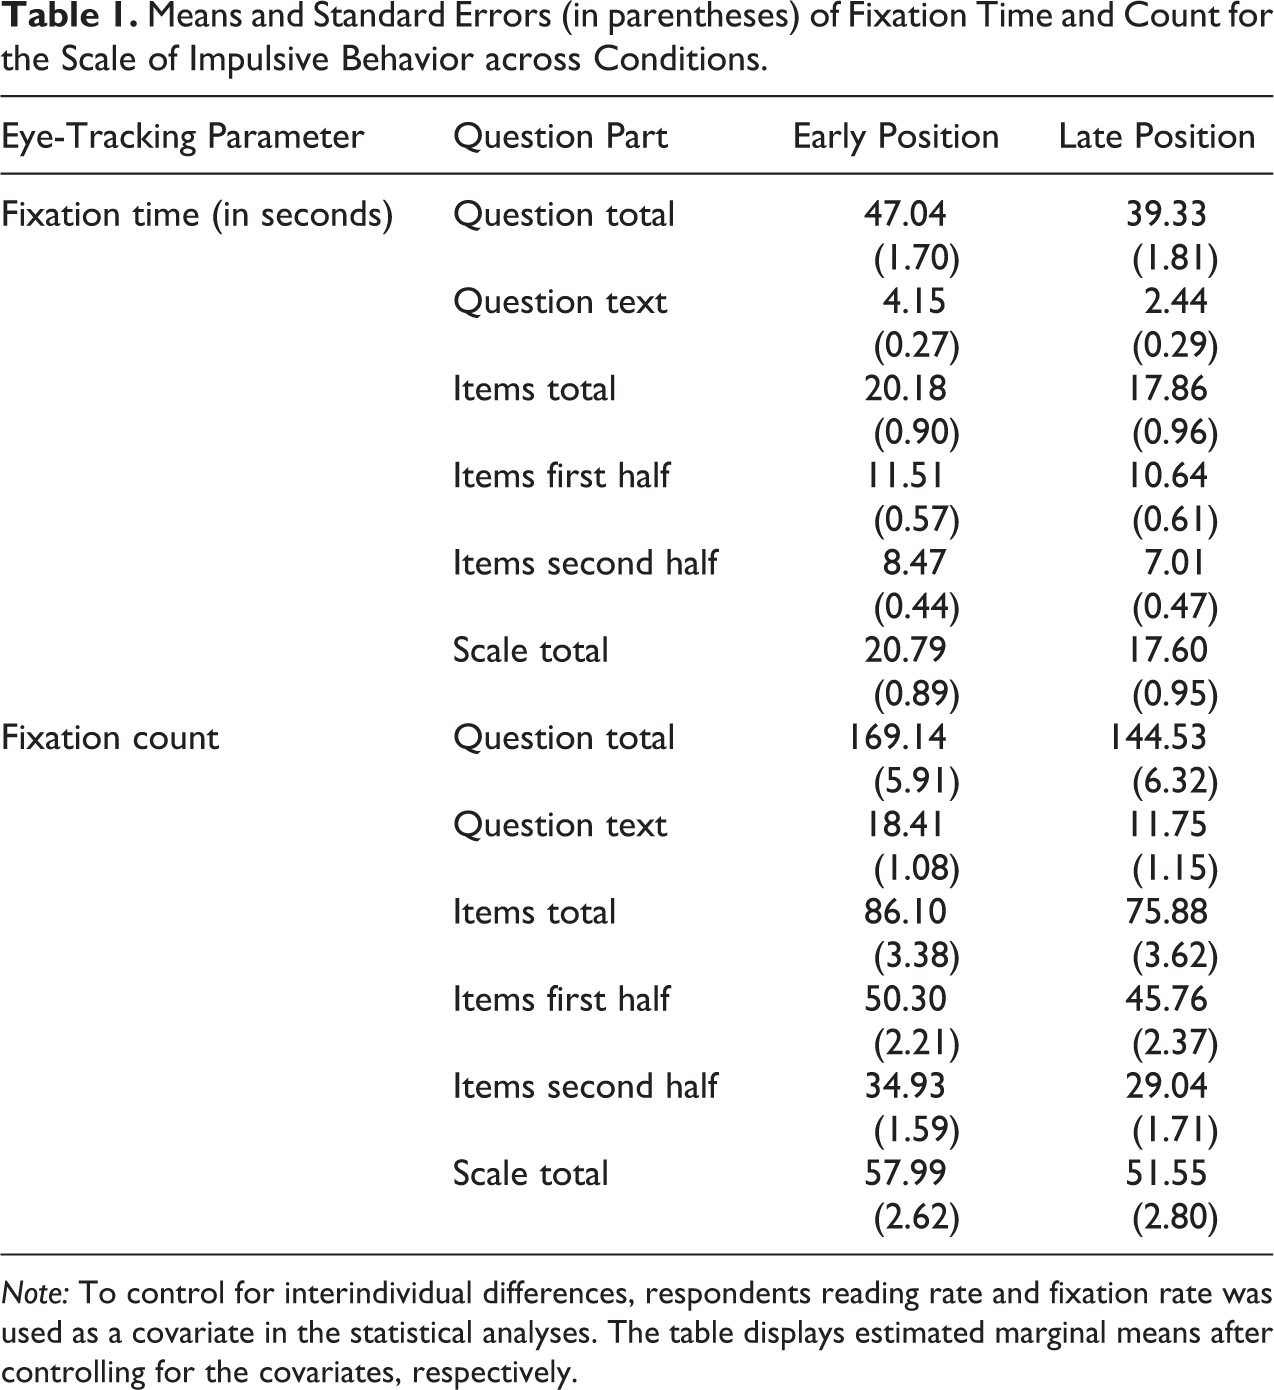
Note: To control for interindividual differences, respondents reading rate and fixation rate was used as a covariate in the statistical analyses. The table displays estimated marginal means after controlling for the covariates, respectively.
Table 2 presents the response means of the eight items. After applying the Bonferroni correction, no significant differences in means between the early versus late positioning condition were observed.
Means and Standard Deviations for the Eight Items of the Scale of Impulsive Behavior across Conditions.
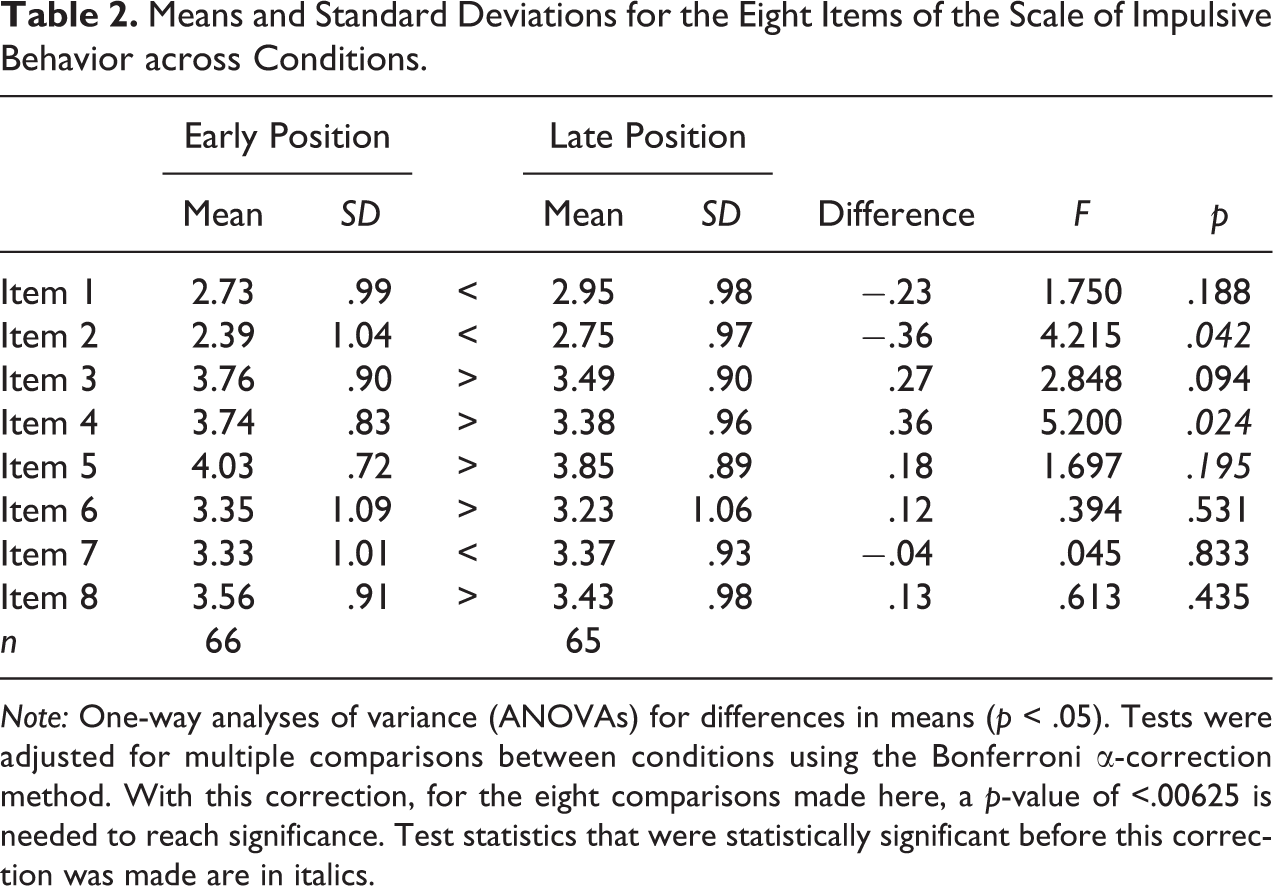
Note: One-way analyses of variance (ANOVAs) for differences in means (p < .05). Tests were adjusted for multiple comparisons between conditions using the Bonferroni α-correction method. With this correction, for the eight comparisons made here, a p-value of <.00625 is needed to reach significance. Test statistics that were statistically significant before this correction was made are in italics.
Experiment 2
To verify the robustness of the results with a larger sample and to gain some further in-depth insights whether the effect of the position on response behavior could be replicated in a shorter survey that is within the recommended survey length for web surveys (Revilla and Ochoa 2017), the experiment was repeated within a shorter survey.
Data and Experimental Design
The second study was conducted with respondents from the German opt-in online panel of the Respondi AG. The experiment was included in a web survey on society and politics, which was fielded between November 15 and November 20, 2018. The web survey used quotas for sex, age, and education. Respondents received a small incentive in form of points in exchange for participating in the survey. Overall, 1,071 panelists accepted the survey invitation, of whom 111 were screened out, 91 broke off, and 869 completed the survey. The break-off rate was 9 percent (cf. Callegaro and DiSogra 2008). The mean duration of the questionnaire completion was 8 minutes 27 seconds (median: 6 minutes 55 seconds).
The same scale as in experiment 1 was used as the experimental question, that is, the scale on impulsive behavior comprising eight items. Again, a between-subject design with random assignment to two experimental conditions was used. Half of the respondents answered the experimental question in the beginning of the survey, after three socio demographic questions and two warm-up questions (after 4 pages, 5 items). The other half answered the question at the end of the survey before an evaluation question (after 27 pages, 42 items). The question was presented as a grid question.
To evaluate possible differences in the sample composition between the two treatment groups, χ2-tests were conducted. The results showed no statistically significant differences for age (χ2 = 1.70; df = 5; p = .889) and education (χ2 = 2.17; df = 2; p = .338). However, the distribution of sex was not equal across conditions (χ2 = 7.54; df = 1; p = .006), with more women than men in the “early” compared to the “late” condition. The variable sex was included in the analyses as a covariate.
Method
The second web-based experiment used the same indicators of data quality as experiment 1, with two exceptions. First, the eye-tracking metrics fixation time and fixation count could not be used as indicators for measuring cognitive effort and attention. Second, response times were measured using server-side response times (in seconds). Since it is not possible in an online survey to ensure that respondents complete the survey without interruption, I have excluded response time outliers from the analyses. I excluded those respondents who had response times below or above the median plus/minus the upper and lower quartile range multiplied by three [Hoaglin, Mostellar and Turkey 2000; lower threshold:
All statistical analyses were performed with SPSS 24. Pearson's X2-tests of independence were conducted for the comparison of non-response across conditions. To compare response differentiation and response means, one-way ANCOVAs were conducted with sex included as covariate. As in experiment 1, Bonferroni correction was applied to adjust for multiple comparisons when comparing response means.
Results
In contrast to the eye-tracking study, respondents did not provide an answer to all items of the experimental question in the web survey. However, the level of item nonresponse was still relatively low. For items 2, 3, 4, and 5, item nonresponse rates varied between 0.5 percent and 0.9 percent in the early condition and between 0.2 percent and 0.7 percent in the late condition. All respondents in the early condition gave a response to item 7, while 0.7 percent of the respondents in the late positioning condition did not answer this item. Across conditions, we found no item nonresponse in item 1, item 6, and item 8. Overall, the item nonresponse rates did not differ significantly depending on an early or late position in the questionnaire (see Table A.1 in Online Appendix C [which can be found at http://smr.sagepub.com/supplemental/]).
When considering the level of response differentiation, the results showed that respondents in the early positioning condition differentiate their answers to a significantly higher degree (M Early =.597) compared to respondents receiving the items at the end of the questionnaire (M Late = .549; F(1, 868) = 17.355; p < .001). Respondents spent significantly more time answering the questions when they were presented in the beginning (M Early = 46.6) compared to at the end of the questionnaire (M Late = 39.4; F(1, 804) = 13.76; p < .001).
Table 3 shows the response means of the items on impulsive behavior. After applying the Bonferroni correction, there were significant differences in means between the early versus late positioning condition for item 1 (“Sometimes I do things impulsively that I shouldn’t do”; F(1, 868) = 18.868, p < .001), item 2 (“I sometimes do things to cheer myself up that I later regret”; F(1, 861) = 20.161, p < .001), item 5 (“I always bring to an end what I have started”; F(1, 865) = 12.042, p = .001), and item 7 (“I am willing to take risks”; F(1, 865) = 9.305, p = .002). The response distributions were similar to those in the first experiment.
Means and Standard Errors for the Eight Items of the Scale on Impulsive Behavior across Conditions.
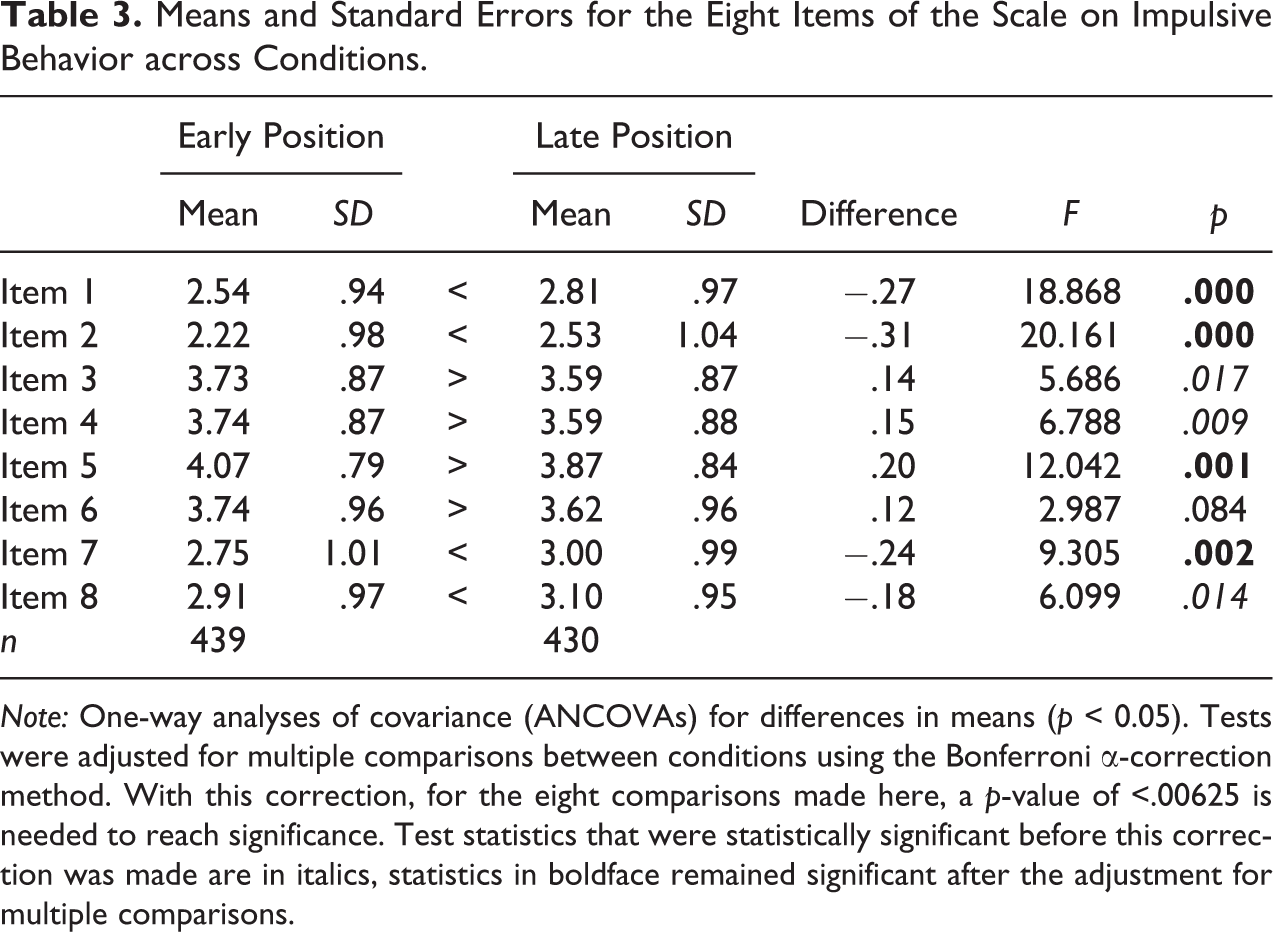
Note: One-way analyses of covariance (ANCOVAs) for differences in means (p < 0.05). Tests were adjusted for multiple comparisons between conditions using the Bonferroni α-correction method. With this correction, for the eight comparisons made here, a p-value of <.00625 is needed to reach significance. Test statistics that were statistically significant before this correction was made are in italics, statistics in boldface remained significant after the adjustment for multiple comparisons.
Discussion and Conclusions
In survey research, researchers face a trade-off between high survey costs and trying to get as much as possible out of a survey, which can come at the expense of the quality of the data collected. With increasing survey length, the risk of respondents becoming tired and burdened grows, as does the likelihood of them reducing their effort by applying strategies of satisficing response behavior. In the first experiment, I was able to investigate the depth of processing of survey questions depending on their position in the questionnaire by using eye tracking. The results showed differences in data quality when questions are asked at the end, rather than at the beginning of the questionnaire, indicating satisficing response behavior. These differences can be explained by the amount of time people spend processing: The experimental question received less fixation time, and hence less attention, when it was presented at the end of the questionnaire than when it was presented at the beginning.
The first experiment had some limitations. First, it was a laboratory study with a relatively small sample size—albeit not small for eye-tracking studies specifically. Second, the questionnaire was quite lengthy. Third, better-educated people were overrepresented in the sample. These limitations were addressed in the second experiment.
In the second experiment, the findings on data quality were replicated with a larger, more balanced sample and a relatively short web survey. Again, even in the shorter survey, data quality was found to be lower for questions positioned later in a questionnaire. This is shown in less item differentiation, shorter response times, and differences in the response means.
The findings lead to some practical implications. Questionnaire designers and researchers should try to motivate their respondents to optimize when answering a questionnaire by keeping the questionnaires short and relevant for the respondents, bearing in mind that there might otherwise be a loss in data quality, especially towards the end of the survey. However, a certain amount of questions on a topic might be absolutely necessary. In these cases, one possibility in web surveys could be to rotate blocks of questions between respondents, or to split the questionnaire into several short individual surveys (i.e., questionnaire modularization; Toepoel and Lugtig 2018). Being able to interrupt answering the questionnaire and resume it later is another strategy to allow respondents to be more attentive. Both studies presented here were self-administered online questionnaires. Worthwhile future research might investigate the effects of question positioning in postal surveys and in interviewer-administered surveys. By design, postal surveys allow the respondent to interrupt filling out the questionnaire and continue later. In interviewer-administered surveys, the interviewers play an important role in motivating respondents throughout questionnaire completion (Fowler 2013). Extending this research to other question types and formats would also be worthwhile.
It would also be interesting to know whether there is some kind of cut-off point at which motivation decreases and respondents stop answering conscientiously. However, the extent to which defining such a point in time would be universally applicable is unclear, as it probably depends on the individual interest in the survey topic as well as on the survey mode. Finally, it would be of interest to follow up on the finding made in the eye-tracking experiment that respondents who answered the grid question at a later position did not consider the items in the second half as thoughtfully as respondents who answered them earlier in the questionnaire while there was no statistically significant difference for the first half. As fixation time and fixation count are measures for attention, this might be an indication that attention not only decreases during the entire questionnaire but also within questions consisting of multiple items when placed later in the questionnaire. However, this interpretation should be treated with caution as the order of the items has not been varied in this study. Future studies manipulating not only the question position but also the order of the items are needed to further address this effect.
Supplemental Material
Supplemental Material, sj-pdf-1-smr-10.1177_0049124120986207 - The Effect of Question Positioning on Data Quality in Web Surveys
Supplemental Material, sj-pdf-1-smr-10.1177_0049124120986207 for The Effect of Question Positioning on Data Quality in Web Surveys by Cornelia Eva Neuert in Sociological Methods & Research
Footnotes
Author’s Note
The SPSS data file containing the eye-tracking data is available by contacting the author. All data analyses were performed using SPSS Advances Statistics 24. For gaze analysis, the SMI BeGaze Version 3.6.57 was utilized.
Declaration of Conflicting Interests
The author(s) declared no potential conflicts of interest with respect to the research, authorship, and/or publication of this article.
Funding
The author(s) received no financial support for the research, authorship, and/or publication of this article.
Supplemental Material
The supplemental material for this article is available online.
Note
References
Supplementary Material
Please find the following supplemental material available below.
For Open Access articles published under a Creative Commons License, all supplemental material carries the same license as the article it is associated with.
For non-Open Access articles published, all supplemental material carries a non-exclusive license, and permission requests for re-use of supplemental material or any part of supplemental material shall be sent directly to the copyright owner as specified in the copyright notice associated with the article.