
Abstract
As a crucial method in organizational and social behavior research, self-report surveys must manage method bias. Method biases are distorted scores in survey response, distorted variance in variables, and distorted relational estimates between variables caused by method designs. Studies on method bias have focused on post hoc statistical control, but integrated analyses of the sociopsychological mechanism of method bias are lacking. This review proposes a framework for method bias and offers a relatively complete and detailed review of the sociopsychological and statistical mechanisms of four main types of method bias and their procedural remedies. This review proposes “reduce, remove, and rectify” as a guideline for researchers in survey design to address method bias. Finally, this review presents two directions for future methodology research.
Introduction
Behavioral studies adopting self-report surveys are often confronted with the methodological challenge of method bias (Burton-Jones 2009; Chin, Thatcher, and Wright 2012; MacKenzie and Podsakoff 2012; Podsakoff, MacKenzie, and Podsakoff 2012). Method biases are distorted scores in survey response, distorted variance in variables, and distorted relational estimates between variables caused by method designs. A self-report survey employs a questionnaire as an instrument to collect responses from participants. The shared variance among constructs because of the shared data collection method in survey design is the major concern as it is believed to distort the relational statistics of variables and ultimately lead to misleading conclusions. This concern regarding method bias is pervasive among journal gatekeepers (i.e., reviewers and editors; Brannick et al. 2010; Chang, van Witteloostuijn, and Eden 2010; Colquitt and Ireland 2009; Conway and Lance 2010; Pace 2010) in various disciplines (e.g., Burton-Jones 2009; Chin et al. 2012; Conway and Lance 2010; Fuller et al. 2016; Jakobsen and Jensen 2015; MacKenzie and Podsakoff 2012; Malhotra, Kim, and Patil 2006; Malhotra, Schaller, and Patil 2017; Min, Park, and Kim 2016; Podsakoff et al. 2012). Although some considered this concern to be unsubstantiated (Chen et al. 1997; Spector 2006), an increasing number of researchers are seeking methods to control for method bias (Campbell and Fiske 1959; Doty and Glick 1998; Podsakoff et al. 2003, 2012; Sharma, Yetton, and Crawford 2009; Simmering et al. 2015; Williams, Hartman, and Cavazotte 2010).
However, the mechanism by which method bias is generated is not yet well-understood, and effective procedural remedies remain elusive. Although studies have revealed various sources of method bias and proposed procedural remedies and post hoc statistical control methods (MacKenzie and Podsakoff 2012; Min et al. 2016; Podsakoff et al. 2003, 2012; Simmering et al. 2015; Williams et al. 2010), a systematic analysis of the causes and contingencies for each type of method bias is still required. Similarly, various procedural remedies have been proposed, but a systematic analysis of such procedural remedies for each type of method bias is unavailable.
This review aims to offer a relatively complete survey of the mechanisms by which the main types of method bias are generated and their procedural remedies. This review does not focus on the post hoc statistical controls of method bias. Readers interested in this topic may refer to the literature for a treatment (Kock 2015; Lindell and Whitney 2001; Podsakoff et al. 2003; Richardson, Simmering, and Sturman 2009; Simmering et al. 2015; Williams et al. 2010). This review also assumes a typical survey research setting in which a set of latent constructs, such as perceptions, beliefs, attitudes, intentions, and behaviors, are used to construct a research model. Constructs are operationalized with items, and individual survey participants are the unit of analysis. This study also assumes the participant is the single source of responses for a self-report survey.
We start by reviewing relevant method bias terminology and explaining the relationships between terms. We then offer an overarching framework to describe the relationships between the sources, channels, and statistical consequences of method bias. On the basis of this framework, we identify four major types of method bias and review their sociopsychological mechanisms. We also analyze their procedural remedies and discuss the possible- conflicts between remedies. Finally, we conclude with recommendations and directions for future research.
Definitions of Terms
To facilitate discussion, we first define the terms used for this review.
Method
In behavior research, methods are (in a narrow sense) “alternative approaches to assigning numbers to observations” (Lance et al. 2009:352). The assignment process is subject not only to the rater (i.e., the participant who assigns a value) but also to instrument factors such as the order and arrangement of the measurement items in the survey (Silber, Danner, and Rammstedt 2019; Weijters, Geuens, and Schillewaert 2009). To accommodate such factors, a method encompasses the data source (e.g., the rater), instrument factors, and data collection procedures (Bagozzi and Yi 1991; MacKenzie and Podsakoff 2012; Podsakoff et al. 2012; Spector 2006). Adopting Burton-Jones’ (2009) definition, this review also defines the measurement method as everything performed to measure the trait score.
Method Bias
Burton-Jones (2009) defined method bias as the difference between the trait score (i.e., the true score of an item or a construct) and the measured score. However, other authors have also used the term method bias to refer to common method bias (CMB). In this article, we use score bias to refer to the bias defined by Burton-Jones (2009). Score bias occurs at both the item level and the construct level. We use method bias as an overarching term to refer to score bias, method variance, common method variance (CMV), and CMB.
Method Variance
Method variance refers to the variance of a variable (i.e., an item or a construct) attributable to the measurement method rather than to the construct of interest (Campbell and Fiske 1959; Podsakoff et al. 2003:879). Method variance is also known as the method effect. Although method variance has been used to refer to the shared method variance among constructs, in the current study, it pertains to only one variable.
CMV
The literature defines CMV as the systematic variance shared among variables because of the use of a common method (Avolio, Yammarino, and Bass 1991; Jakobsen and Jensen 2015; Johnson, Rosen, and Djurdjevic 2011; Malhotra et al. 2006, 2017; Pace 2010; Siemsen, Roth, and Oliveira 2010). We adopt this definition. CMV pertains to multiple variables.
CMB
Although CMV and CMB are often used interchangeably in the literature, several studies differentiate them. For example, Siemsen et al. (2010:457) defined CMB as the parameter estimate asymptotically converging to a value different from the true population value resulting from CMV. In their review, CMB is the consequence of CMV.
This review defines CMB as the bias in the relational estimate of two variables in a research model, such as a biased correlation or a biased path coefficient in a structural equation model. CMV represents the bias in the covariance of two variables, whereas CMB factors in the influence of the variance of individual variables in a relational estimate. CMV does not necessarily lead to CMB (Doty and Glick 1998; Fuller et al. 2016). CMV may inflate, deflate, or have no effect on the correlation between two constructs (Baumgartner and Steenkamp 2001; MacKenzie and Podsakoff 2012; Siemsen et al. 2010). Because CMB directly affects the interpretation and validity of research findings, exploring how CMV affects CMB as a primary cause is vital.
Proposed Framework
We propose a framework that organizes the causes and consequences of method bias (Figure 1). In this framework, the same rater (i.e., the survey participant who self-reports all items) (Jakobsen and Jensen 2015; Johnson et al. 2011), instrument (Malhotra et al. 2017; Simmering et al. 2015), and procedure (Malhotra et al. 2017) constitute the three sources of method bias. Burton-Jones (2009) referred to them as the three elements of method bias. These sources affect the measured score through two channels: knowledge bias and rating bias (Burton-Jones 2009). When a rater does not have sufficient knowledge of survey items, they might provide inaccurate responses, which is knowledge bias. Other factors, such as the rater’s social desirability tendency, the format of the instrument, and the collection procedure, can influence the rater to deliberately provide a biased response, which is rating bias. Knowledge bias ultimately manifests as rating bias. Rating bias in responses eventually produces score bias, method variance, CMV, and CMB. Correspondingly, these method biases lead to mean and variance bias in variables as well as covariance bias and correlation bias in pairs of variables. A rater’s interpretation of the instrument and reaction to the procedure is essentially a sociopsychological process. Subsequently, a statistical process transforms the raw responses into various statistics. The observed method bias is the output of both processes.
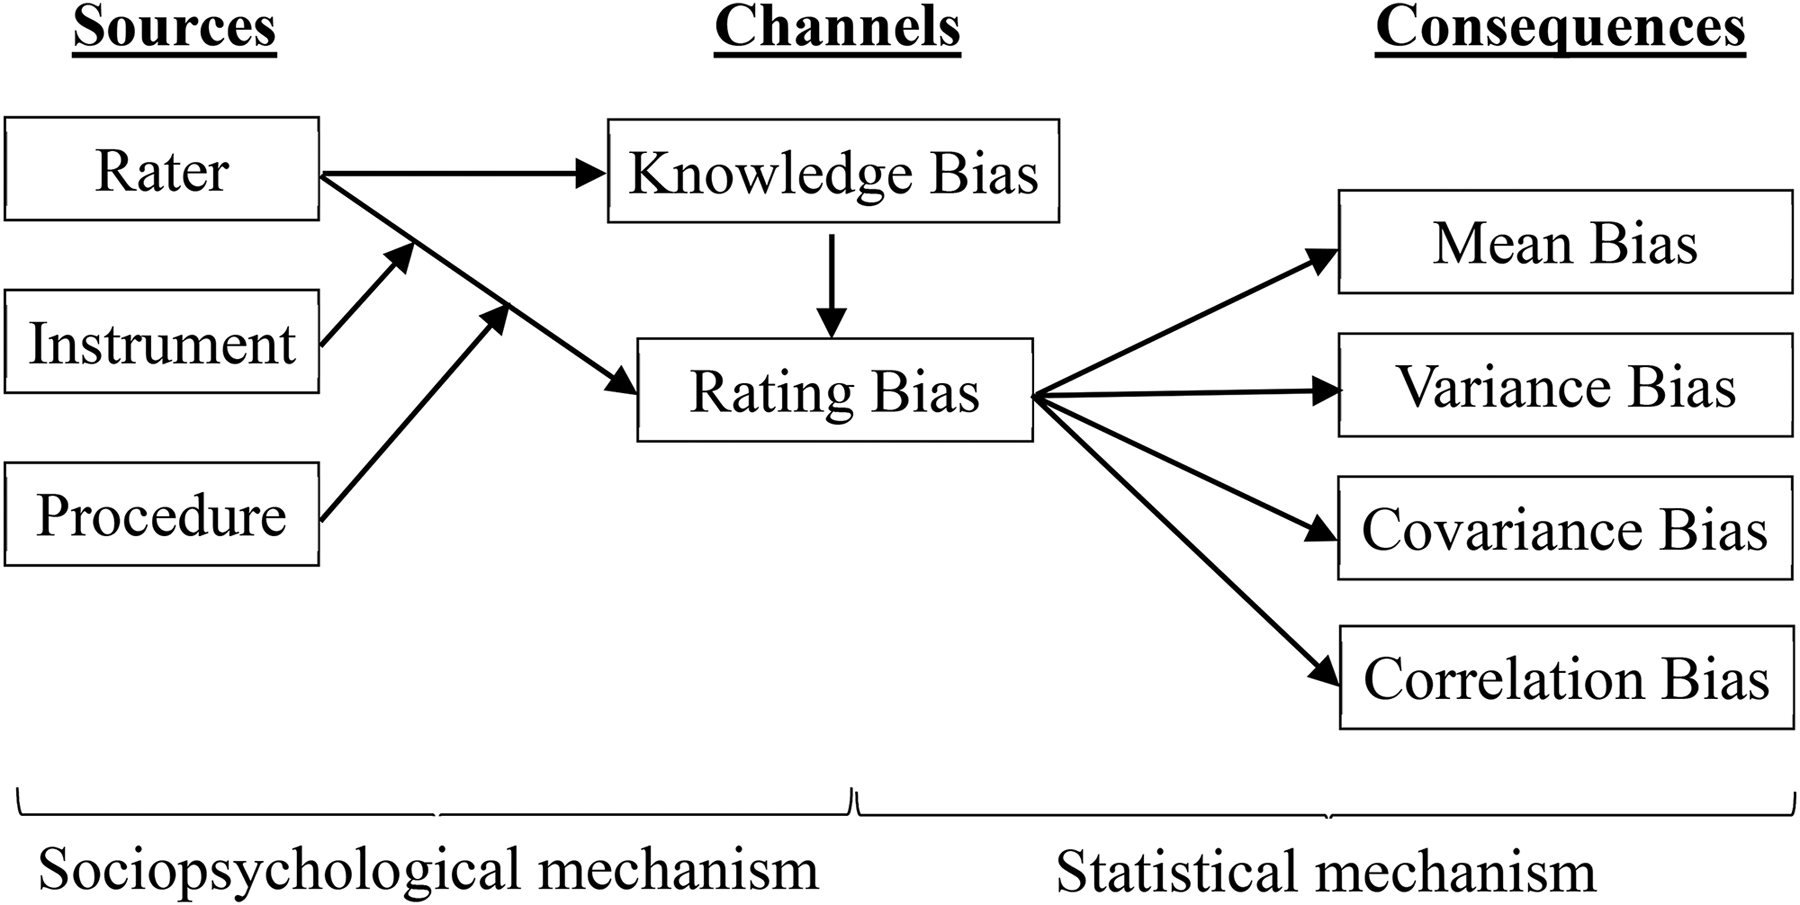
Mechanism model of method bias.
Sociopsychological mechanism of acquiescence.
Sociopsychological mechanism of implicit theory.
Sociopsychological mechanism of PA and NA.
Sociopsychological mechanism of social desirability.
We acknowledge that rating bias can be caused both by a single source and by the interactions between sources. For example, a rater’s social desirability may be activated while rating some items but not others. Even a single source may produce two types of bias. For example, a rater may have a social desirability inclination and positive affectivity. These two personality traits may have an interaction effect on the rating of items. Consequently, the CMV of two variables might be different from that of two other variables in the same survey.
Statistical Analysis of Method Bias
This section provides an analysis of the statistical mechanisms of method bias. The sociopsychological mechanism of method bias is described in Section III.
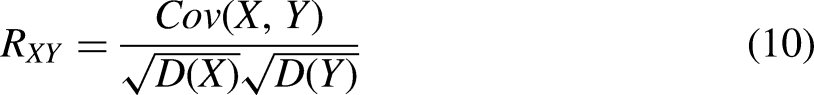
The relationships between score bias, method variance, CMV, and CMB can be defined in statistical terms. We use X and Y to denote two variables, and
Condition 1
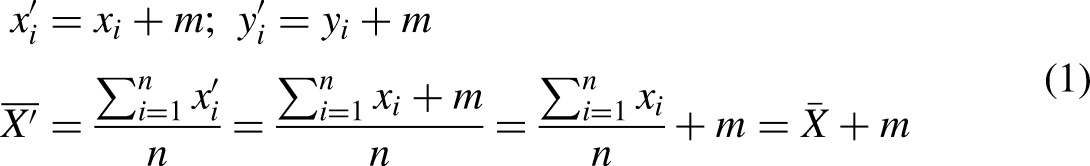
Condition 1: (a) A rater has an equal score bias for both X and Y, and all raters have an equal score bias. (b) A rater has a bias for only one variable (X or Y), and all raters have an equal score bias.
In condition 1a, the bias can be set to a constant m


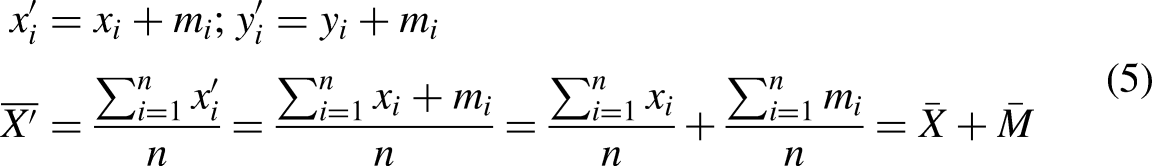
Condition 2
Condition 2: (a) A rater has an equal score bias for both X and Y but raters may have different score biases. (b) A rater has a score bias for only one variable (X or Y) and raters may have different score biases.
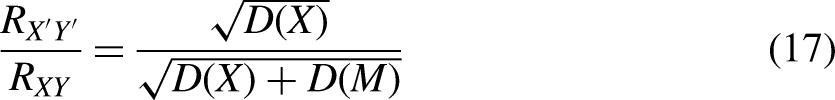
Condition 2a is more realistic than condition 1. Let M be the method factor, each participant has its method bias


In condition 2b, if X is biased, but Y is not, then


Condition 3
Condition 3: (a) A rater has unequal score biases for X and Y, and raters may have different score biases. (b) A rater has a score bias for only one variable (X or Y), and raters may have different score biases. (c) A rater has a score bias for only one variable (X or Y), and this bias is affected by their response to the other variable (Y or X). Raters may have different score biases.
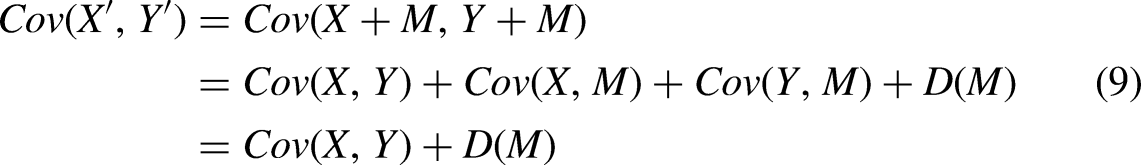
Condition 3a represents a more general situation. Let

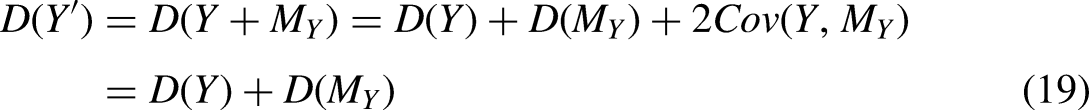
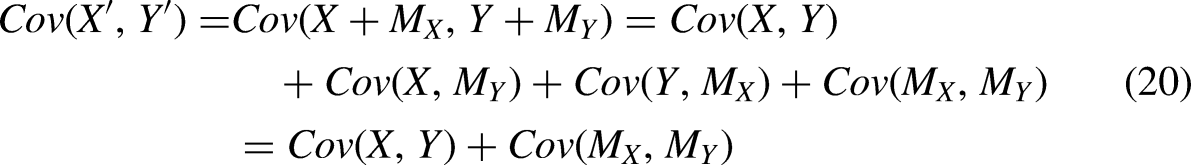

As a special case of condition 3a, suppose X and Y are both affected by social desirability but at different degrees, we may denote

The conclusions of condition 3b are similar to those of condition 2b. When a variance bias
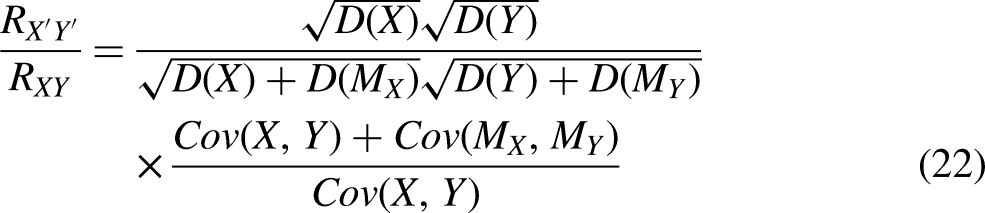
In condition 3c, we assume that Y is not biased
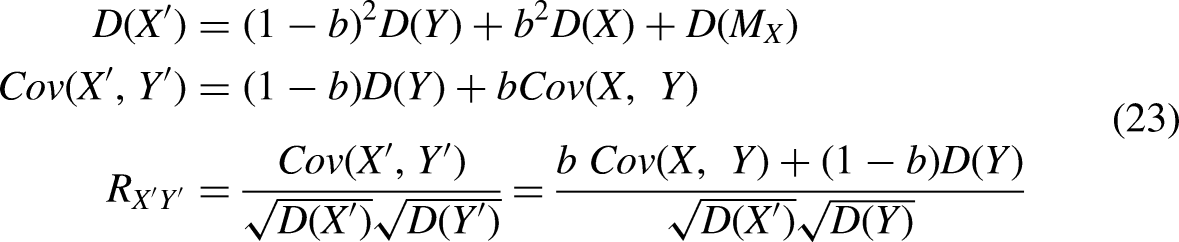
When b = 0, X’ is fully driven by implicit theory or the item-priming effect. When Y is not biased, Equation (23) reduces to
When 0 < b < 1, the numerical simulation indicates that the correlation changes from deflation to inflation. This change is monotonous and nonlinear.
Summary
The preceding analysis yields the following observations. First, method variance introduces additional variance to the measured scores. Hence, it has a deflating effect on the true correlation between the affected variables. Second, when only one variable is affected by method bias and the other is not, the true correlation is deflated. Third, CMV introduces additional (and often positive) covariance to the true covariance; hence, it has an inflating effect on the true correlation provided that the true correlation is positive. When the true correlation is negative, CMV deflates the negative true correlation by moving the correlation closer to zero. Because of the deflating effect caused by method variance and the inflating effect caused by CMV, the total effect is undetermined; that is, it can be inflation, deflation, or no effect. The preceding analysis also indicates that when two variables demonstrate a weak correlation, the absence of method bias is not necessarily suggested. Instead, a deflated correlation may be suggested.
Sociopsychological Mechanism and Procedural Remedies
Where do method biases come from? Sociopsychological mechanisms vary between different types of method bias. Studies have identified seven major types of method bias (MacKenzie and Podsakoff 2012; Podsakoff et al. 2003, 2012). We group them on the basis of their source of origin (i.e., the rater, instrument, or procedure) as follows.
Herein, these types of method bias are considered as antecedents of CMV. Previous studies have described them as individual types or sources of method bias, thus implicitly considering them to be causes of method bias. We consider the CMV of a study as a composite outcome with contributions from multiple types of method bias.
Types of Method Bias
Types of method bias from the rater
This review categorizes the biases from the rater into four types: response style, consistency tendency, mood propensity, and desirability.
Response style is the responding tendency toward item scales. A tendency to agree with scales indicates an acquiescent response style, and a tendency to disagree indicates a disacquiescent response style. In addition, a tendency to select the endpoint or midpoint of the response scale indicates an extreme or midpoint response style, and the tendency to select options randomly regardless of the item content indicates a careless response style. These response styles are independent of the item content (Wetzel, Carstensen, and Böhnke 2013). Therefore, they lead to CMV among all items.
Consistency tendency refers to a rater’s propensity to attempt to maintain a consistent series of responses to constructs that they perceive as related (e.g., beliefs and attitudes toward the same object). Raters act as naïve scientists (Ratliff and Nosek 2010) and have implicit theories of the relationships among items in a survey (Podsakoff et al. 2003; Podsakoff and Organ 1986; Schmitt 1994). Implicit theories are “meaning construction frameworks, naïve or lay systems of beliefs that people use in their everyday life to interpret and evaluate their social world” (Hong et al. 2004:1036). After they perceive two items to be related, they generate compatible responses to these items (Podsakoff and Organ 1986). For example, when raters provide a favorable evaluation of a product, they tend to indicate a strong purchase intention to demonstrate logical thinking. When raters make erroneous assumptions about the relationship between variables, illusory correlations occur (Hamilton and Gifford 1976). Consistency tendency depends on the content of items. Therefore, it leads to CMV among items pertaining to the implicit theories or illusory correlations perceived by the raters.
Mood propensity refers to affectivity in survey responses. Affectivity is a personality construct. Raters with positive affectivity (PA) tend to perceive themselves and the world around them as generally or temporarily positive. By contrast, raters with negative affectivity (NA) tend to perceive themselves and the world in a negative manner (Watson and Clark 1984). Mood propensity is independent of the content of items, and therefore, leads to CMV among all items.
Social desirability refers to the tendency to respond to items about the self or others in a socially desirable manner. When responding to items about the self, the rater tends to select a value that reflects social approval and acceptance (Crowne and Marlowe 1964). When responding to items about others, the rater tends to demonstrate leniency by assigning favorable ratings (Phelps, Schmitz, and Boatright 1986). Social desirability leads to CMV among socially evaluative variables.
Types of Method Bias From the Instrument
We categorize method bias from the instrument into the item wording effect and the item presentation effect.
In item wording, item ambiguity refers to a situation in which items are ambiguous (e.g., complex or abstract questions and double-barreled questions). Ambiguous items are difficult to comprehend (Spector 1992) and may have semantic and syntactic problems (Tourangeau, Rips, and Rasinski 2000), including indeterminate words such as “many” and “sometimes” as well as double negatives (Johnson 2004). Complex sentence structures, words with multiple meanings or vague definitions (Tourangeau et al. 2000), specialized glossaries (Spector 1992), and rarely used words all contribute to ambiguity (Peterson 2000). Item ambiguity affects only items that are inaccurately worded. The effect of item ambiguity depends on the consequent response strategy of the rater. For example, the rater may resort to acquiescence or carelessness as a coping strategy.
In item wording, item demand characteristics refer to “the fact that items may convey hidden cues as to how to respond to them” (Podsakoff et al. 2003:882). Item social desirability is a common type of item demand characteristic (Podsakoff et al. 2003). If an item is phrased to reflect socially desirable attitudes, behaviors, or perceptions, such hints, whether strong or weak, are likely to lead raters to a socially desirable response (Kam 2013). When an item requires participants to evaluate something, the evaluative item can be positively (negatively) valanced (e.g., “The shopping process is enjoyable”) and incur positive (negative) memories that ultimately lead to an enhanced positive (negative) response (Credé et al. 2009). Item demand characteristics are item-specific (Kam 2018) and lead to CMV among items with a similar demand characteristic.
The second category is item presentation, which refers to the visual presentation of an item in a survey instrument. Item presentation includes the serial position of an item on a page, the ordering of items, and the scale attributes. Among scale attributes, the scale effect is the effect caused by the use of the same scale format and anchor points by multiple items. The same scale and anchors, especially for agree-disagree items, enhance a rater’s tendency to provide similar ratings.
Within the scale effect, the presentation of numeric and text labels may affect the interpretation of response categories. Schwarz et al. (1991) compared the − 5 to + 5 and 0–10 scales for measuring life success, and they observed that the skewness is more marked when the scale labels range from − 5 to + 5. The extreme value of − 5 implies a thorough failure, whereas the extreme value of 0 in the 0–10 scale implies a lack of success. The selective presence of anchor text may also cause response bias. The traditional bipolar scale with verbal endpoints is the most popular format in numerous studies. This scale has only two anchor labels at the ends of the response continuum. If the rating is neither of the two extremes, the raters must estimate their rating. Psychologists claim that the rater may select response options by starting from an initial anchor and adjusting to the final answer. However, such adjustments are typically insufficient (Tversky and Kahneman 1974). Consequently, the reported value is closer to the ends than it should be. An insufficient adjustment from the reference point increases the variance of a variable if the true value is near the midpoint. If the true value is biased toward one end, the observed variance might be lower. Scale effects lead to CMV among items with the same scale format.
Another item presentation effect is the priming effect. In the priming effect, a prior item or construct in a questionnaire may cause the rater to perceive a later item or construct as more salient, thus activating the rater’s implicit memory, which changes their response to the later item or construct (Podsakoff et al. 2003). The prior item affects the response to a later item through the altered interpretation or retrieval of information from memory. In this sense, the priming effect can be considered a facilitating condition activating the implicit theories perceived by raters. The priming effect leads to CMV among items that raters assume to be associated on the basis of implicit theories or illusive correlation.
Types of Method Bias From the Procedure
Procedure refers to the time, location, medium (e.g., web-based, written, and face-to-face), and operation (e.g., the introduction of a survey to participants and the reward for participation) of the data collection process. When all items are collected simultaneously from the same location and rater through the same medium and process, the shared context exerts an influence on all items, leading to CMV. In this review, the notion of procedure effect does not include previously mentioned method biases such as the item presentation effect. The instrument design is assumed to be given and only biases introduced by the execution process of the survey are referred to.
Summary
Types of method bias interact with each other to produce CMV. In a self-report survey, raters are the fundamental source of method bias. They not only serve as direct antecedents to CMV but also interact with instrument factors and procedural factors. Instrument and procedural factors must work with the rater to produce CMV. Consequently, procedural remedies to mitigate method bias must be based on the raters’ psychologies. For example, the reduction of item ambiguity helps to reduce the number of acquiescent or careless responses, and the separation of time and location in data collection helps to reduce the mood effect and implicit theory effect.
We identify four major types of method bias from the rater (i.e., acquiescence, implicit theory, PA and NA, and social desirability), analyze their sociopsychological mechanisms and statistical effects, and propose procedural remedies (Table A1). These types of bias identified are frequently discussed in reviews (MacKenzie and Podsakoff 2012; Podsakoff et al. 2003; Podsakoff et al. 2012; Simmering et al. 2015; Williams et al. 2010) and empirical studies (van Herk, Poortinga, and Verhallen 2004; King and Bruner 2000; Levy, Stroessner, and Dweck 1998; Taggar and Brown 2006). Our focus on these rater factors does not disregard instrument factors or procedural factors. Instead, both instrument and procedural factors are addressed in our discussion in terms of their interactions with rater factors.
Acquiescence
Acquiescence is a tendency to say “yes” rather than “no” to items. Couch and Keniston (1960) further distinguished “yea-sayers” and “nay-sayers.” Bentler, Jackson, and Messick (1971) differentiated two acquiescence processes: agreement and acceptance acquiescence. Agreement acquiescence refers to “the tendency to agree” regardless of the direction of items, whereas acceptance acquiescence refers to the tendency to accept only the items worded positively and deny those worded negatively. Acquiescence is considered a personality trait (Kuru and Pasek 2016). Because most researchers consider agreement acquiescence to be the default bias (e.g., Winkler, Kanouse, and Ware 1982; Wright 1975), our analysis focuses only on this type of acquiescence.
Acquiescence is differentiated from careless responding, which is defined as “responding without regard to item content” (Meade and Craig 2012:437) and includes actions such as randomly selecting an option, providing middle or extreme answers on numerous consecutive items, or repeating a type of response pattern (Kam and Meyer 2015). Although acquiescence and careless responding may yield similar answers to items (e.g., extreme answers), they are different. First, careless responding is not driven by personality, whereas acquiescence is. Second, careless raters pay insufficient attention to item content, whereas acquiescent raters may pay sufficient attention to item content. When a rater has limited motivation and is not interested in retrieving information, careless responding occurs (Krosnick 1991). Careless respondents may skip the stages of item comprehension, retrieval, and judgment to provide a response (Kam and Meyer 2015; Podsakoff et al. 2003), whereas acquiescent respondents may not skip these stages (Knowles and Condon 1999).
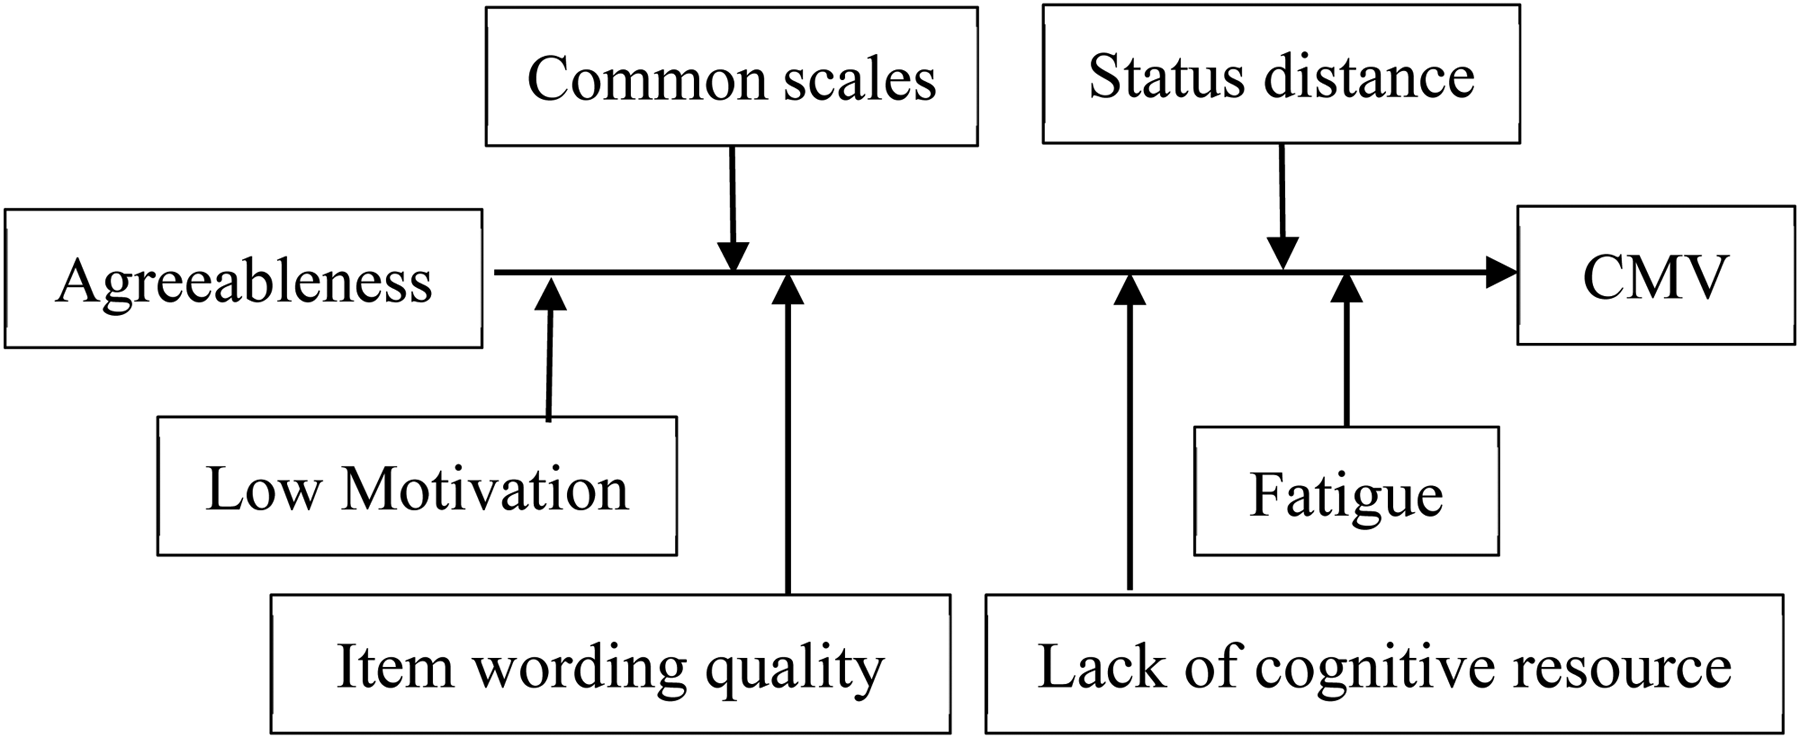
Sociopsychological Mechanism (Figure 2)
From a psychological perspective, acquiescence is compatible with “agreeableness” in the “Big Five” personality traits (Barrick and Mount 1993). Agreeable people are concerned with social harmony and typically agree with others to avoid interpersonal conflict (Costa and McCrae 1988; Couch and Keniston 1960). Consequently, people high in agreeableness tend to agree with survey items and edit their responses for acceptance.
Agreeableness can be activated by contextual and instrument factors. The lack of motivation to respond accurately exacerbates acquiescence (Knowles and Condon 1999; MacKenzie and Podsakoff 2012). When a rater is not sufficiently motivated, experiences fatigue, or cannot understand an item to retrieve related information, they are more likely to agree with a statement if it cannot easily be rejected. The use of the same scale format in an instrument also positively enhances agreeableness. A common scale format reduces the requirement for scrutinizing each item and facilitating habitual agreement. An agreement is considered a polite response strategy requiring minimal effort (Brown and Levinson 1987).
Acquiescence is influenced by the social relationship between the researcher and the rater, especially in an interviewer-administered survey (Carr 1971; Johnson et al. 2005). When an interviewer is considered to have a high social status, raters may agree with the items out of deference, courtesy, and respect (Carr 1971). Johnson et al. (2005) examined the effects of four Hofstede cultural dimensions on acquiescence and observed significant associations between these national-level dimensions and individual-level acquiescence.
Statistical Effect
Acquiescence bias tends to influence all constructs because it is construct-independent. Acquiescence bias varies among raters, but it is mostly stable among items (Danner, Aichholzer, and Rammstedt 2015) in a single questionnaire (Javaras and Ripley 2007), even over 1 year (Billiet and Davidov 2008; Weijters, Geuens, and Schillewaert 2010). Therefore, acquiescence bias satisfies condition 2a and has an equal effect on X and Y. On the basis of the statistical mechanism, acquiescence leads to mean, variance, covariance, and correlation bias. Acquiescence bias inflates positively correlated variables but deflates negatively correlated ones.
Potential Procedural Remedies
The first procedural remedy is the careful sampling of participants. A survey should be administered to raters who are interested in the topic and have sufficient knowledge to provide answers (Bentler et al. 1971). Such raters are motivated to exert cognitive effort because of high personal relevance (MacKenzie and Podsakoff 2012).
The second procedural remedy pertains to survey process design. Self-administered questionnaires are preferred to interviews to mitigate the effects of social status differences between researchers and participants (Carr 1971). An appropriate reward is another process factor for encouraging accurate responses. Monetary rewards, when appropriately used, can enhance raters’ motivation. To minimize survey fatigue, questionnaires should not be excessively long, especially in the later part of the survey.
The third procedure remedy is to improve item wording quality; specifically, ambiguous, complex, and double-barreled questions should be avoided (Podsakoff et al. 2003; Tourangeau et al. 2000).
The fourth remedy is to change the scale format. Changes in item scale format encourage careful reading and reduce acquiescence bias (MacKenzie and Podsakoff 2012). Podsakoff et al. (2003) recommended using diverse scale types (e.g., Likert scales, semantic differential scales, and “faces” scales) and anchor points (e.g., extremely, always, never). Tourangeau et al. (2000) suggested providing verbal labels for the midpoint of a scale and avoiding bipolar numerical scales. However, diverse scale formats are not without shortcomings. They may increase the cognitive load on raters, leading to fatigue. Adding anchor labels to every scale point is another method for reducing ambiguity and minimizing cognitive load (Krosnick and Berent 1993).
Reverse-worded items have received mixed reviews. Wong, Rindfleisch, and Burroughs (2003) found it to be effective for Western participants but problematic in East Asia. Schriesheim and Hill (1981) suggested that reverse-worded items reduce response accuracy. In addition, Woods (2006) indicated that reverse-worded items can reduce the internal consistency, reliability, and validity of a scale because of participants’ erroneous responses. A variation of reverse-worded items involves using balanced scales that employ an equal number of positively worded items (a.k.a. “regular items”) and negatively worded items (a.k.a. “reversed items”). Balanced scales are expected to mitigate the acquiescence effect and reduce the aforementioned negative effect of reverse-worded items (Cloud and Vaughan 1970; Danner et al. 2015; Kuru and Pasek 2016; Nunnally 1978; Ray 1983). Although a balanced scale appears to be an effective solution, Suárez-Alvarez et al. (2018:156) challenged it as follows:
(a) The measurement precision of the instrument is flawed; (b) the interpretation of instrument unidimensionality is jeopardized by secondary sources of variance; (c) the variance of the combined form is reduced; (d) examinees’ scores differ significantly from those obtained in tests where all of the items are of a similar form; (e) verbal skills influence examinees’ responses.
Therefore, the researchers have suggested that balanced scales should be employed with caution.
Implicit Theory
Implicit theory refers to a rater’s beliefs about the covariation among variables (Podsakoff et al. 2003) and guides their information processing, judgment, and decision-making (Levy et al. 1998).
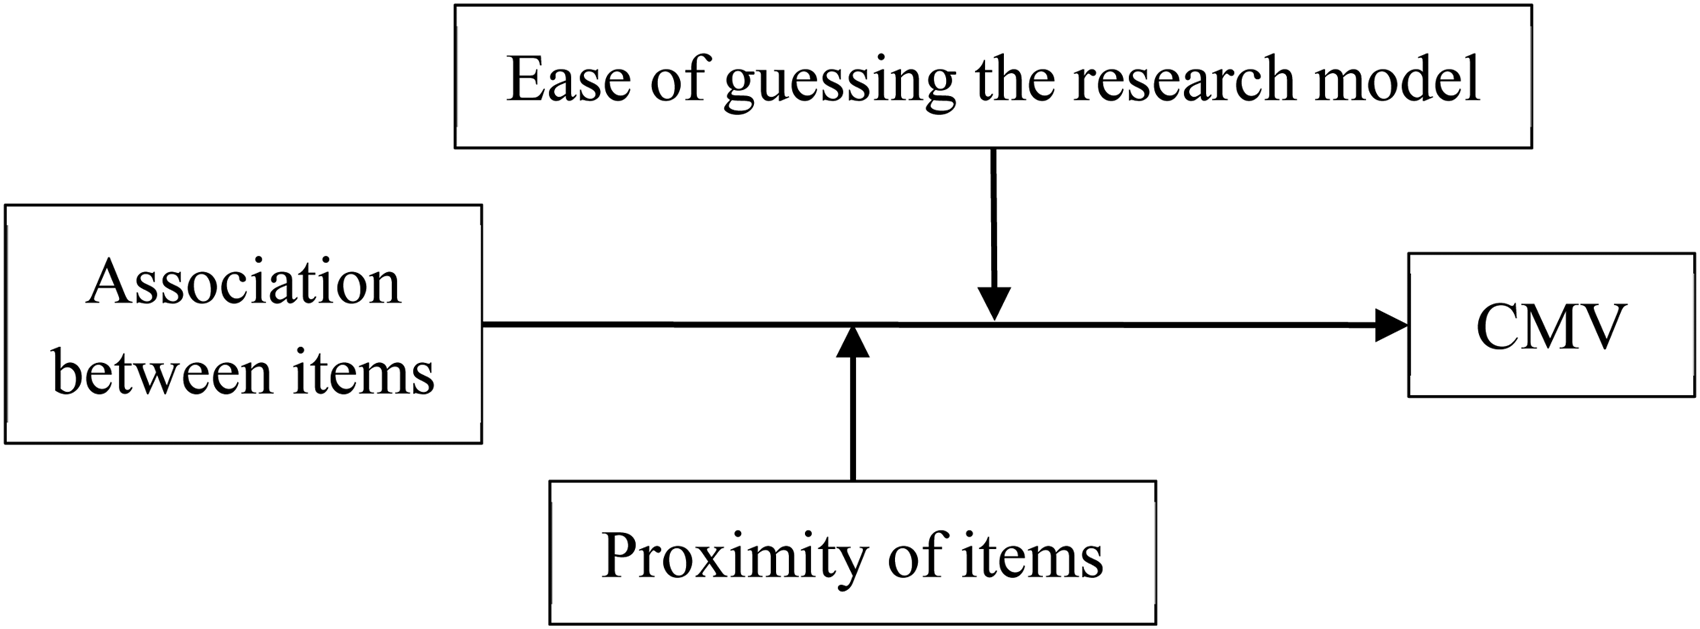
Sociopsychological Mechanism (Figure 3)
The implicit theory has been identified in various domains (Guzzo et al. 1986; Junker and van Dick 2014), such as leadership (Phillips and Lord 1986), attribution (Bachrach, Bendoly, and Podsakoff 2001), and ability research (Beckmann et al. 2012).
When raters hold an implicit theory of two variables, they consider the two variables to be associated. Their response to the earlier variable serves as a cue that guides their response to the later variable. For example, if a rater gives a product a high rating, when asked about the purchase intention, the rater tends to respond with high purchase intention regardless of their real intention. This happens because the rater has an intuitive presumption that a good product is always worth purchasing. A special case of implicit theory is when raters make fictional inferences between variables when insufficient information exists for one variable. For example, when a teacher is provided with a student’s intelligence score, the teacher tends to rate the student as more capable (Cooper 1981). When a rater evaluates the trait of an object according to other prominent but unrelated traits, the halo effect occurs (Thorndike 1920). Another special case of the implicit theory is attribution bias. Attribution theory (Kelley 1967; Weiner 1985) states that when an individual evaluates their own performance negatively, they are likely to attribute the cause to external factors while attributing their success to their internal quality.
For implicit theory to distort responses, the association between two items, whether legitimate or illusory, must first be perceived. Several factors contribute to the activation of such associations. First, item proximity is a crucial factor for inducing association (Hamilton and Rose 1980). Item proximity facilitates the priming effect through which later items are interpreted in the context of preceding items. An example of proximity is the item interlacing effect (Wainer and Kiely 1987), in which a neutral item placed between two positive items is likely to be rated more positively (Harrison and McLaughlin 1993). A second factor of implicit theory is the theoretical relationship between items. If two items are theoretically related (e.g., attitude and intentional items), raters, as naïve scientists, are likely to accurately identify the relationship. The co-occurrence of items prompts raters to evaluate these items consistently.
Statistical Effect
Implicit theory only affects constructs related to the theory. We assume only one prevailing implicit theory exists because random implicit theories can be considered random measurement errors and ignored. When X is a construct affected by implicit theory, but Y is not, condition 2b applies. In this case, no covariance bias exists, and implicit theory bias deflates the correlation between X and Y. When both X and Y are related to the implicit theory, a rater typically edits the response of a later variable but not that of an earlier variable. Assuming that Y is not edited, and X is, condition 3c applies. In this case, the correlation between the two variables is always inflated.
Potential Procedural Remedies
Researchers must first decide which variables are likely to be associated through implicit theory. On the basis of the psychological mechanism of implicit theory, the related constructs of a theoretical model with a causal hypothesis are more likely to elicit implicit theory. Therefore, items of causally hypothesized constructs are more likely to be subject to implicit theory. If literature is available, the correlation observed between constructs in studies also serves as an indicator of item association. If the correlation is high, their items are likely to be affected by implicit theory. Finally, on the basis of the halo effect, participants tend to associate items that they do not know with items they have sufficient knowledge, to evaluate.
The primary procedural remedy is to physically separate the constructs associated with implicit theory or which are highly associated in the literature. From a procedural design perspective, if feasible, independent and dependent variables can be collected at different times and locations and through different media (MacKenzie and Podsakoff 2012; Podsakoff et al. 2003, 2012). Research models may contain multiple layers of mediators that serve as both independent and dependent variables. However, collecting variables in multiple waves may lead to severe participant attrition. Another practice is to carefully arrange the constructs on a questionnaire so that constructs with causal relationships are spatially separated. This method is easy to implement, but the expected improvement is weaker compared with that of multiwave data collection. Another practice is to collect associated variables from different sources. For example, employee performance data can be collected from a supervisor, and individual expertise can be self-reported. However, the use of multiple sources is only applicable to certain research models.
Clear instructions also minimize the effects of implicit theory. In procedure design, a researcher must disguise the research model to prevent raters from identifying the theoretical model. The real purpose of a study must not be revealed to raters before they complete a survey.
Congesting an instrument with irrelevant items and constructs may further obscure the actual research model. Such material can be used to separate potentially highly correlated items and constructs. However, the downside of this practice is that it lengthens a survey and increases the chance of rater fatigue.
PA-NA
Watson and Clark (1984) defined NA as a dispositional mood dimension with negative emotionality and self-concept. Correspondingly, PA refers to positive emotionality and self-concept.
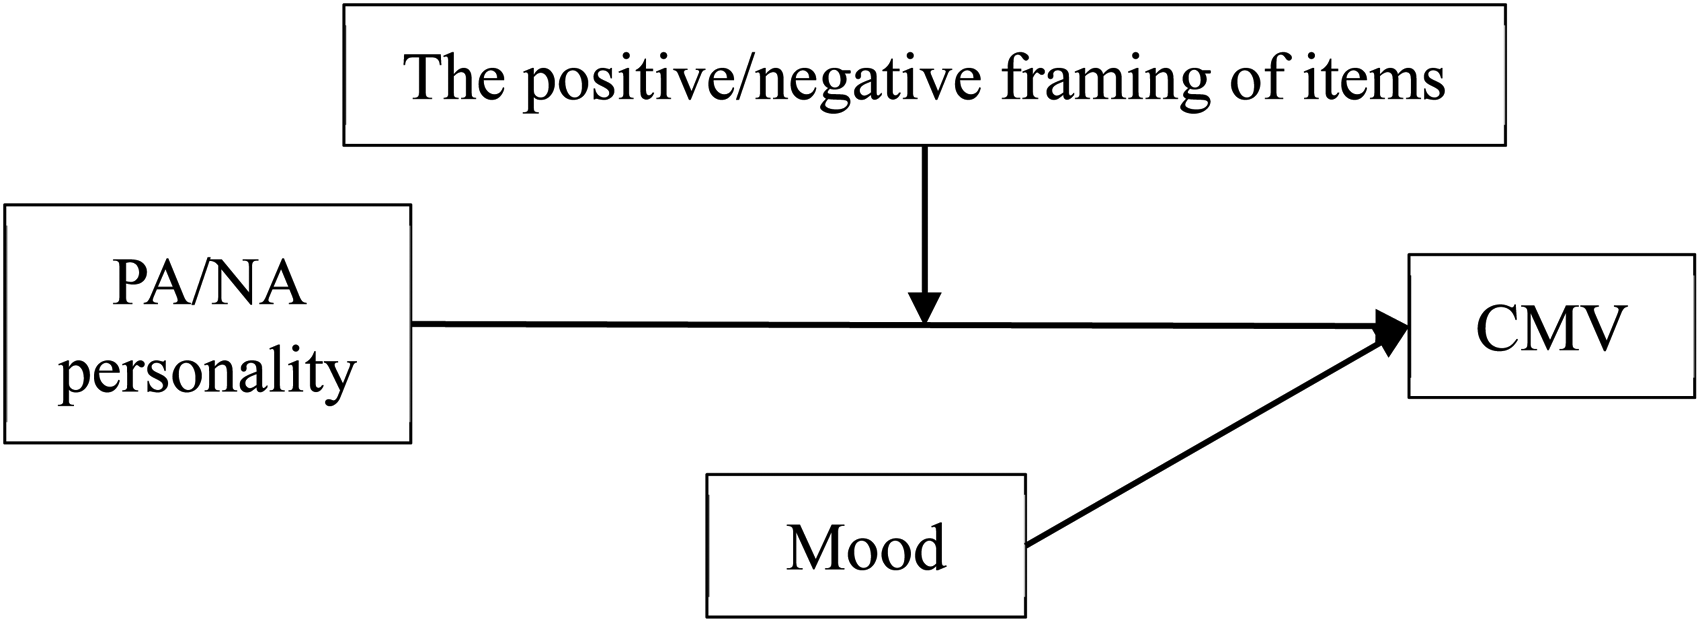
Sociopsychological Mechanism (Figure 4)
Watson and Clark (1984) concluded that people with high NA tend to focus on the negative side of the self, others, and the world in general. Therefore, in a self-report survey, people with high PA or NA are more likely to respond in a positive or negative fashion. If PA or NA influences two or more items, their covariance may contain a shared personality factor.
According to cognitive-affective theories, PA and NA lead to two cognitive response styles: enhancing and dampening. Nelis et al. (2016) observed that individuals with high PA are more likely to demonstrate their positive affectivity with enhanced responses, whereas individuals with high NA are more likely to demonstrate their negative affectivity with dampened responses. When an item is positively worded, a rater with high PA or NA tends to adopt an enhancing or dampening response style, respectively. Consequently, ratings of such items are likely to trend toward the positive or negative side. When two or more constructs are subject to the influence of PA or NA, their covariance contains the influence of shared personality factors.
PA and NA may change temporarily as a transient mood state because of a rater’s experiences. When raters respond to an item while in a particular mood, artifactual covariance in the items may occur. Temporal separation of measurement is a method for reducing such transient affectivity (Podsakoff et al. 2003, 2012). When a rater’s mood is relatively stable during a survey, it can affect the response for all items.
According to the framing effect and attentional bias, information presentation influences individuals’ responses (Nabi 2003). Whether an item is positively or negatively worded can influence how raters respond to the item. Furthermore, research has indicated that more attention is paid to emotionally positive or negative information than is paid to neutral information. The outcome is an elevated positive or negative response (Grafton, Ang, and MacLeod 2012; Grafton and MacLeod 2017). Considering both PA and NA as personality disposition and as the demand characteristics of items, an interaction effect is expected. Positive and negative items are likely to enhance the disposition tendency of PA and NA, respectively, resulting in an enhanced positive or negative response. In this case, PA and NA affect only positively and negatively worded items.
Statistical Effect
As a stable personality trait during a survey, PA and NA tend to influence all constructs. When all items are neutrally worded, the effects of PA and NA tend to be equal for all items; thus, condition 2a applies. PA and NA inflate the correlation between X and Y when they are positively correlated, but deflate it when they are negatively correlated.
When items are positively worded, PA and NA bias tends to be equal for items in the same direction, condition 2a applies. Between positively and negatively worded items, PA and NA have unequal effects on items of different directions (Podsakoff et al. 2003, 2012); thus, condition 3a applies. Because an individual’s reactions to positive and negative items are negatively correlated, the covariance between these items is reduced.
Potential Procedural Remedies
The first procedural design is to incorporate measures of the predictor and criterion variables from different sources to mitigate the mood, PA, and NA effects (Podsakoff et al. 2003, 2012). If these variables are measured at different times, the mood effect is randomized; however, the PA and NA effects remain. In the instructions to raters, raters should be reminded not to take the survey “personally,” but to consider it objectively.
The second procedural design involves using neutral items instead of positive or negative items. Neutral items reduce the framing effect. Emotionally charged wording should be avoided to mitigate attentional bias.
The third procedural design involves controlling for PA and NA as a confounder, which causes spurious correlation among constructs. In organizational behavior research, Brief et al. (1988) recognized the dual role of NA as a methodological nuisance and as a substantive cause in work stress studies. Kaplan et al. (2009) conducted a meta-analysis that indicated PA and NA could serve as substantive variables to influence job performance, organizational citizenship, withdrawal, counterproductive work, and occupational injury. Williams, Gavin, and Williams (1996) provided evidence for the dual role of NA as a measurement bias and a substantive effect. When PA and NA are antecedents to constructs in a research model, they should be included in surveys as a control variable.
Social Desirability
Edwards (1953) proposed the concept of “social desirability,” which is both an item demand characteristic and a rater’s personality. This perspective implies the dual role or dual dimensionality of social desirability (Crowne and Marlowe 1960; Randall and Fernandes 1991). Randall and Fernandes (1991) examined the impact of social desirability response bias and revealed that it is associated with both personality and item characteristics.
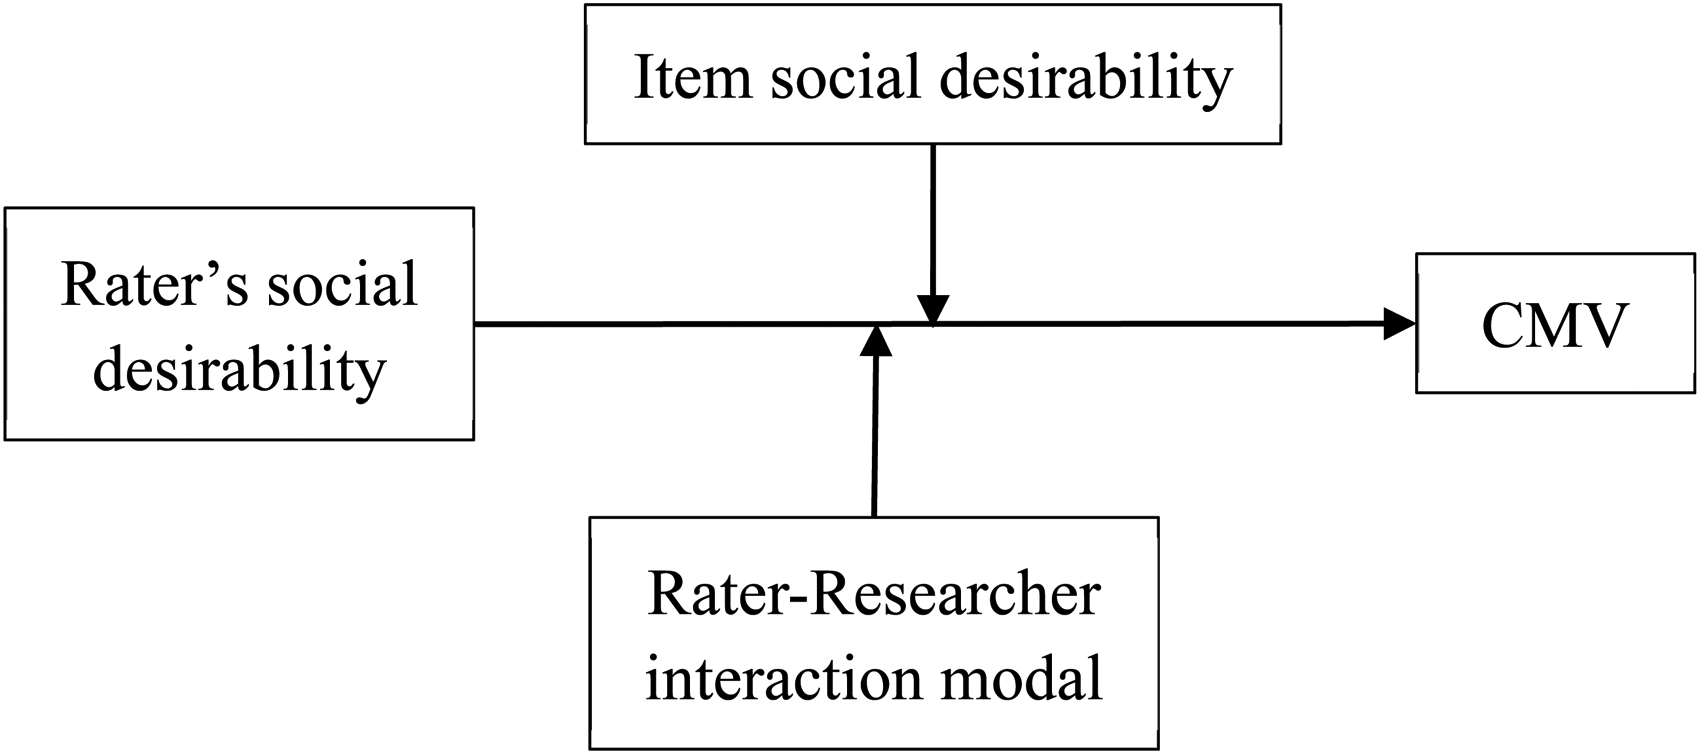
Sociopsychological Mechanism (Figure 5)
As a stable personality characteristic, social desirability refers to the constant need for social approval and to manage impressions. It can be further separated into two components: self-deception and impression management (Paulhus 1989, 1991; Paulhus and Reid 1991; Zerbe and Paulhus 1987). Self-deception is the unconscious tendency to perceive oneself favorably. By contrast, impression management refers to the “conscious presentation of a false front, such as deliberately falsifying test responses to create a favorable impression” (Zerbe and Paulhus 1987:253). Self-deception is an automatic process, whereas impression management is a controlled process involving the deliberate deception of others (Holtgraves 2004).
The second dimension of social desirability is item characteristics, which refers to the trait desirability of an item, including socially desired attitudes and behaviors. Items vary in social desirability. When an item suggests social desirability, it activates the social desirability personality of the rater.
The two dimensions interact with one other to produce the final response to an item (Groves 1989). Raters tend to proclaim socially desirable traits and behaviors and deny socially undesirable ones (Nederhof 1985). When an item does not contain information related to social values such as asking about one’s evaluation of a restaurant, the item is less likely to activate impression management or self-deception in the rater. By contrast, if the topic is sensitive and value-laden, such as asking about religious views, interpersonal evaluation, health, or other sensitive topics, the rater’s impression management motivation and self-deception are much stronger.
In the cognitive process of response, social desirability can bias information retrieval. Raters selectively retrieve more socially desirable information. Even if the retrieved information is truthful, in the reporting stage, raters edit their responses on the basis of social desirability concerns (Holtgraves 2004). Ratings of such items are likely to trend toward favorability. Therefore, a set of items with high social desirability shares the same bias, leading to higher covariance.
Researcher-rater interaction is another critical moderator. In a face-to-face interview, the rater’s motivation for social approval is higher, and they attempt to avoid shame and embarrassment (Schaeffer 2000). Similarly, the interviewer’s characteristics and the interview environment affect the degree of social desirability bias (Krumpal 2013).
Statistical Effect
Social desirability tends to only affect the constructs and items with social desirability demand characteristics. A construct-method interaction exists for the affected constructs and items, and the effects may not be identical. The desire for social approval varies between raters (Dunlop, Telford, and Morrison 2012). Therefore, condition 3a applies when two constructs are affected by social desirability. When only one construct is affected by social desirability, condition 3b applies.
Potential Procedural Remedies
The first procedural remedy is to employ a self-report survey to eliminate the social pressure induced by the presence of an interviewer (Mao and Feldman 2019; Tourangeau et al. 2000). Computer-based measures are less distorted than are paper-and-pencil measures (Richman et al. 1999). However, Randall and Fernandes’s (1991) research indicates that a social desirability bias persists even if a survey is administered in a nonthreatening situation, including self-report surveys. Web surveys are helpful in eliminating interaction between raters and researchers (Kreuter, Presser, and Tourangeau 2008; Nederhof 1985).
With or without the presence of the researcher, instructions must be provided to protect respondent anonymity and to reduce evaluation apprehension (Podsakoff et al. 2003). In addition to a statement of assurance, several special survey methods may be employed for a simple survey. The randomized response technique is an anonymity-preserving survey technique (Bradburn and Sudman 1979; de Jong, Pieters, and Fox 2010). This method gives the rater a chance (e.g., by tossing a coin) to lie on an item, but the researcher does not know who lies. However, the randomized response technique only works if the researcher is interested in general statistics, such as a percentage. The technique is infeasible for causal analysis. A similar technique, the unmatched count technique, protects anonymity but renders causal analysis infeasible (Lippitt et al. 2014).
The second procedural remedy involves reducing the social desirability of items. Nederhof (1985) suggested using neutral items. Kam (2013) suggested eliminating items strongly correlated with social desirability as measured by the Balanced Inventory of Desirable Responding. However, this method may lead to the elimination of an entire construct, thereby defeating the purpose of a research model.
The third procedural remedy involves indirect questioning. In this case, a rater is required to indicate their sympathy or agreement with the attitudes or behaviors of other people. Fisher (1993) observed that for variables subject to social desirability, indirect questioning can significantly reduce bias. This method does not affect socially neutral variables. A limitation of this method is that a rater cannot speak for another person concerning unobservable constructs such as the other person’s feelings.
The fourth procedural remedy involves obtaining measures that share social desirability from different sources (Podsakoff et al. 2003). If a variable obtained from the rater is subject to social desirability bias, and another variable obtained from an alternate source is not, then no CMV exists between them. However, this method is unwieldy when three or more constructs are subject to social desirability or when only the rater has the knowledge of the constructs.
Conflicts Between Procedural Remedies
Unfortunately, the adoption of multiple procedural remedies produces conflicts. For example, Clifford and Jerit (2015) investigated the effectiveness of four warning messages (audit, anonymity, commitment, and feedback) as a method for increasing respondent motivation. They observed that a warning message reduces acquiescence but increases social desirability bias. Using reverse-worded items reduces acquiescent responding (Watson 1992; Wong et al. 2003), but using neutral items reduces social desirability and PA or NA (Grafton et al. 2012; Nederhof 1985). Balanced items reduce acquiescence (Podsakoff et al. 2012), but they can exacerbate PA and NA biases (Grafton et al. 2012). Grouping items of a single construct together is likely to artificially increase the internal reliability and convergence validity of the construct. However, mixing items from different constructs may lead to a priming effect and distort the interpretation of the items.
Conclusion
In surveys, procedural remedies for method bias are essential for ensuring the reliability of the research conclusion. Although second-hand data analysis, measurement models, and physiological measurement technologies (e.g., electroencephalograms) can improve data objectivity, surveys still play an irreplaceable role when the research involves subjective constructs such as individual perceptions, attitudes, and intentions. Therefore, researchers must do their best to control method bias in surveys. Procedural remedies may be more effective than post hoc statistical corrections and control (Conway and Lance 2010; Pace 2010; Podsakoff et al. 2003). Because of the lack of effective procedural remedies, numerous researchers use post hoc statistical methods to indicate that the method bias in their research results is limited. However, these post hoc statistical methods are unable to comprehensively measure or correct the types of method bias discussed herein. Few studies have explored how to design surveys to reduce method bias.
This article contributes to the literature in the following aspects. First, it provides a relatively complete review of the sociopsychological mechanisms, statistical mechanisms, and procedural remedies of the four main types of method bias. Second, it offers a detailed analysis of the statistical mechanisms of method bias between two variables and their effects on the observed relationship. Although the literature suggests that CMV can have an inflating, deflating, or no effect on the relationship between two variables (MacKenzie and Podsakoff 2012), the conditions to these results are not explained. Third, the current study reveals how each type of method bias, with its interactions among rater traits, item characteristics, and procedural design, has nuanced statistical consequences. Certain research models may be subject to certain types of method bias. Researchers must identify the relevant types of method bias and design their surveys accordingly.
Despite the differences in sociopsychological mechanisms, this review suggests that method biases produce the same two statistical effects: an additional measurement error effect that deflates the correlation between variables, and the CMV effect, which nearly always positively biases covariance, thereby inflating the initially positive correlation and deflating the initially negative correlation by making the correlation less negative. Most of the hypotheses in the literature are positive, and the measurement error effect is generally smaller than the CMV effect. Therefore, in actual research, method bias often manifests as inflated correlations.
Recommendations for Researchers
How should researchers reduce method bias? Although this review focuses on procedural remedies, we suggest that method bias should be addressed using both preventive and post hoc statistical strategies. Moreover, post hoc control strategies should be integrated in survey designs. Therefore, we propose three guiding principles: reduce, remove, and rectify.
Reduce is a preventive principle that aims to reduce the threat of potential method bias in survey designs and includes the following steps:
First, researchers should analyze the severity of the potential method bias in the research model, such as in the context of the four types of method bias discussed herein. Acquiescence, implicit theory, and PA or NA are inherent in most surveys, but the presence of social desirability depends on the research topic.
Second, researchers should consider applying techniques proposed in the literature wherever applicable. Table A2 summarizes these procedural remedies, including appropriate procedural
Third, when method factors are also the substantive antecedent, PA or NA and social desirability may directly affect the constructs of a research model. Therefore, the questionnaire should contain scales for PA or NA and social desirability to ensure that their effects on the dependent variable can be controlled statistically. We call this the
Fourth, information technology should be used to record the time required to answer questions, let the respondents guess the research model, measure the emotions of the respondents, or add the “difficult to answer” option in the questionnaire as an indicator of whether the respondent is likely to demonstrate obvious method bias. This indicator can be used later as a standard for data filtering. We call this the
Remove is a data preprocessing strategy. According to the time required for respondents to complete a survey, researchers should delete the surveys of respondents who completed the survey too fast or who answered “I don’t know” or “difficult to answer” because they are more likely to be severely affected by acquiescent bias. On the basis of how accurately respondents guessed the research model, researchers can delete the surveys of respondents who guessed the model with high accuracy because they are more likely to be severely affected by the implicit theory.
Rectify is a corrective statistical strategy. Several statistical methods can be adopted to rectify bias, including adding PA or NA and social desirability as a control variable in model fitting (Podsakoff et al. 2003). In the case of single method bias, Lindell and Whitney (2001) proposed a method for adjusting the item covariance matrix with a marker variable. Williams et al. (2010) further proposed a comprehensive confirmatory factor analysis (CFA) marker method for multiple sources of method bias. Through a comparison of a group of CFA models, factor loadings can be adjusted to test the effects of method bias and make corrections. In addition, the type and degree of method bias can be assessed. Although CFA marker methods are increasingly being adopted, the implementation of this technique is relatively complex (Simmering et al. 2015).
Future Directions for Methodology Research
This review demonstrates that at least two primary directions are feasible in method bias research.
First, the sociopsychological mechanisms of various types of method bias must be empirically confirmed. For the four types of method bias, existing studies lack integrated models to describe their sociopsychological mechanisms. Although this article proposes a relatively complete model, determining how to verify and expand this model is essential. The mechanisms of different types of method bias may overlap; for example, acquiescence and social desirability are both affected by the social relationships and interactions between researchers and respondents (Ferrando and Anguiano-Carrasco 2010). These mechanisms may also evolve dynamically. For example, when people age, their social desirability and acquiescence tendencies increase (Vigil-Colet, Morales-Vives, and Lorenzo-Seva 2013).
Second, the effectiveness of procedural remedies must be explored. Because various types of method bias may demand contradictory procedural remedies, determining how to design a sophisticated preventive strategy and optimizing its overall effectiveness would be a topic worthy of future research.
As an example of preventive design, we recommend the “randomize and rectify” strategy. “Randomize” refers to the randomization of the format and order of constructs (Höhne and Krebs 2018). This strategy can reduce the method bias originating from implicit theory because the relationship between constructs is less visible because of the randomization of ordering. This strategy can also reduce some of the acquiescent bias through scale format variations. Other than these aspects, the most crucial aspect of randomization is the homogenization of method biases rather than the erasure of them. After method biases are homogenized, researchers can correct them by using a post hoc statistical method such as employing a marker variable to correct the covariance matrix (Lindell and Whitney 2001). Unfortunately, randomization cannot reduce social desirability because it is item-specific.
In conclusion, this review elucidates the sociopsychological and statistical mechanisms of method bias. With this wide perspective of procedural remedies, researchers can improve the design and implementation of survey methods.
Footnotes
Acknowledgments
This study was supported by the National Natural Science Foundation of China under Grant #71531006 and the Program for Professor of Special Appointment (Eastern Scholar) at Shanghai Institutions of Higher Learning.
Declaration of Conflicting Interests
The author(s) declared the following potential conflicts of interest with respect to the research, authorship, and/or publication of this article: This study was supported by the National Natural Science Foundation of China under Grant #71531006 and the Program for Professor of Special Appointment (Eastern Scholar) at Shanghai Institutions of Higher Learning.
Funding
The author(s) disclosed receipt of the following financial support for the research, authorship, and/or publication of this article: This work was supported by the Program for Professor of Special Appointment (Eastern Scholar) (grant number at Shanghai Institutions of Higher Learning, 71531006).
Supplemental material
Supplemental material for this article is available online.