
Abstract
Randomized response techniques (RRTs) are applied to reduce response biases in self-report surveys on sensitive research questions (e.g., on socially undesirable characteristics). However, there is evidence that they cannot completely eliminate self-protecting response strategies. To address this problem, there are RRTs specifically designed to measure the extent of such strategies. Here we assessed the recently devised unrelated question model—cheating extension (UQMC) in a preregistered online survey on intimate partner violence (IPV) victimization and perpetration during the first contact restrictions as containment measures for the outbreak of the coronavirus disease 2019 pandemic in Germany in early 2020. The UQMC accounting for self-protecting responses described the data better than its predecessor model which assumes instruction adherence. The resulting three-month prevalence estimates were about 10% and we found a high proportion of self-protecting responses in the group of female participants queried about IPV victimization. However, unexpected results concerning the differences in prevalence estimates across the groups queried about victimization and perpetration highlight the difficulty of investigating sensitive research questions even using methods that guarantee anonymity and the importance of interpreting the respective estimates with caution.
Keywords
Many social and psychological phenomena of high societal relevance are difficult to investigate empirically because of their sensitive nature. For instance, the German news broadcaster Tagesschau recently reported an alarming increase in the incidence of intimate partner violence (IPV) in criminal statistics during the ongoing coronavirus disease 2019 (COVID-19) pandemic (Emundts 2020). However, criminal statistics are assumed to underestimate the actual numbers, because they only capture legally reported cases and the dark figure, that is, the number of non-registered cases might substantially exceed these numbers. Problematically, the dark figure of cases of IPV is difficult to investigate because it is a highly stigmatized topic (e.g., Ellsberg et al. 2001; Gracia 2004). Both victimization and perpetration of IPV are perceived as socially undesirable and reporting is associated with negative consequences (e.g., Schröttle 2015; Franke et al. 2004). Social desirability and fear of stigmatization or other negative consequences can influence response behavior in surveys and interviews (Tourangeau and Yan 2007). Specifically, survey respondents can be inclined not to respond at all, especially if they carry the investigated undesirable or stigmatized attribute, or to give an untruthful self-protecting response. Although both these behaviors are employed to disguise ones own individual status, they bias group-level estimates of dark figures as well. The consequence is that the extent of societal problems such as IPV can be underestimated by surveys (Tourangeau and Yan 2007). This impairment concerns a variety of research fields in the social sciences that address sensitive characteristics.
Randomized Response Techniques
To overcome self-protecting response strategies in surveys on sensitive attributes, randomized response techniques (RRTs; Warner 1965) were developed to assure the protection of the respondents’ anonymity. Specifically, a randomization device (such as a die) is employed to ambiguate single responses and thus make them inconclusive toward the carrier status of a single respondent. For instance, in the unrelated question model (UQM; Greenberg et al. 1969) version of the RRT, a randomization device decides whether a respondent shall answer the sensitive question S of interest, such as “Have you ever been physically assaulted by a partner?” or an unrelated neutral question N, such as “Is your mother’s birthday in the first half of the year?” In the case of employing a die as a randomization device, the instruction could be to answer the sensitive question S, if the die comes up 1 through 4, and the neutral question N, if it comes up 5 or 6. Importantly, only the response to either question but not the outcome of the randomization is reported. Therefore, a “Yes”-response could either mean that the respondent has been physically assaulted by a partner or that their mother’s birthday is in the first half of the year. Consequently, it remains concealed whether a specific respondent was physically assaulted by a partner and, theoretically, respondents have no reason to employ self-protecting response strategies that could bias prevalence estimates. In the current study, we applied such a technique to estimate the prevalence of IPV during the first COVID-19 related contact restrictions in Germany in spring 2020.
Importantly, it is possible to compute these prevalence estimates using the known probabilities underlying the questioning design. Figure 1 depicts the probabilities underlying “Yes” and “No” responses in the UQM. A “Yes” response can come (a) from a respondent who was instructed to respond to the sensitive question S with probability

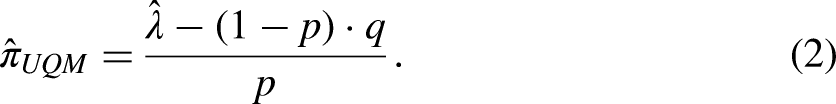
Probability tree of the unrelated question model (UQM).
Note. The sensitive question S and the neutral question N are randomly received by respondents with probability
Non-Adherence to Instructions in RRTs
However, there are reasons to doubt that even with the RRT there is full honesty in responding. A number of studies did not find RRT estimates to be more valid than those from studies using direct questions (e.g., Höglinger and Diekmann 2017; Höglinger and Jann 2018; Holbrook and Krosnick 2010). A possible explanation for this finding is that the instructions of the RRT are difficult to understand (Hoffmann et al. 2017) and there is still a lack of trust in the anonymity protection (Höglinger et al. 2016). One way to address this problem is to increase comprehensibility (e.g., Meisters et al. 2020). Another way is to quantify the extent of non-compliance with instructions. In this vein, some RRT extensions, such as the cheater detection model (CDM; Clark and Desharnais 1998) or the stochastic lie detector (Moshagen et al. 2012) include parameters for specific types of instruction non-adherence. Especially the CDM has been applied in a number of studies (e.g., Elbe and Pitsch 2018; Moshagen et al. 2010; Ostapczuk et al. 2011; Pitsch et al. 2007; Schröter et al. 2016). It is based on another RRT variant, the forced response technique (Boruch 1971), which is similar to the UQM. The only difference is that the alternative to the sensitive question is not a neutral question but the instruction to respond “Yes.” In the CDM, respondents are considered to be either honest and follow the instructions or to be cheaters and give a “No”-response irrespective of the outcome of the randomization and their carrier status. The latter can serve to evade being seen as a carrier of the sensitive attribute and has thus been termed a self-protective response strategy (Böckenholt and van der Heijden 2007). Based on this categorization, two parameters can be estimated: The proportion of cheaters
It is important to note, however, that the CDM still makes strong assumptions about the nature of instruction non-adherence. For instance, the varying levels of the randomization probability
The Unrelated Question Model—Cheating Extension
The recently proposed unrelated question model—cheating extension (UQMC; Reiber et al. 2020) transfers the CDM’s concept of cheating to the UQM’s design. The reason for devising this extension was that the psychological acceptability of the UQM has been found to be superior to that of the forced response method (Höglinger et al. 2016). As such, the UQM can be seen as less fallible to self-protecting responses, since there is no response option that clearly rules out being a carrier of the sensitive attribute (one could respond “No” to the neutral question and still be a carrier of the sensitive attribute). However, also in the UQM “No” can be seen as a self-protecting response since the conditional likelihood of being a carrier is always lower given a “No” than given a “Yes” response. Additionally, and probably more intuitively from a respondent’s perspective, a “No” response to the neutral question can naively be interpreted as a response with which being a carrier of the sensitive attribute is negated. Thus, it is worthwhile to investigate whether cheating occurs in the UQM as well.
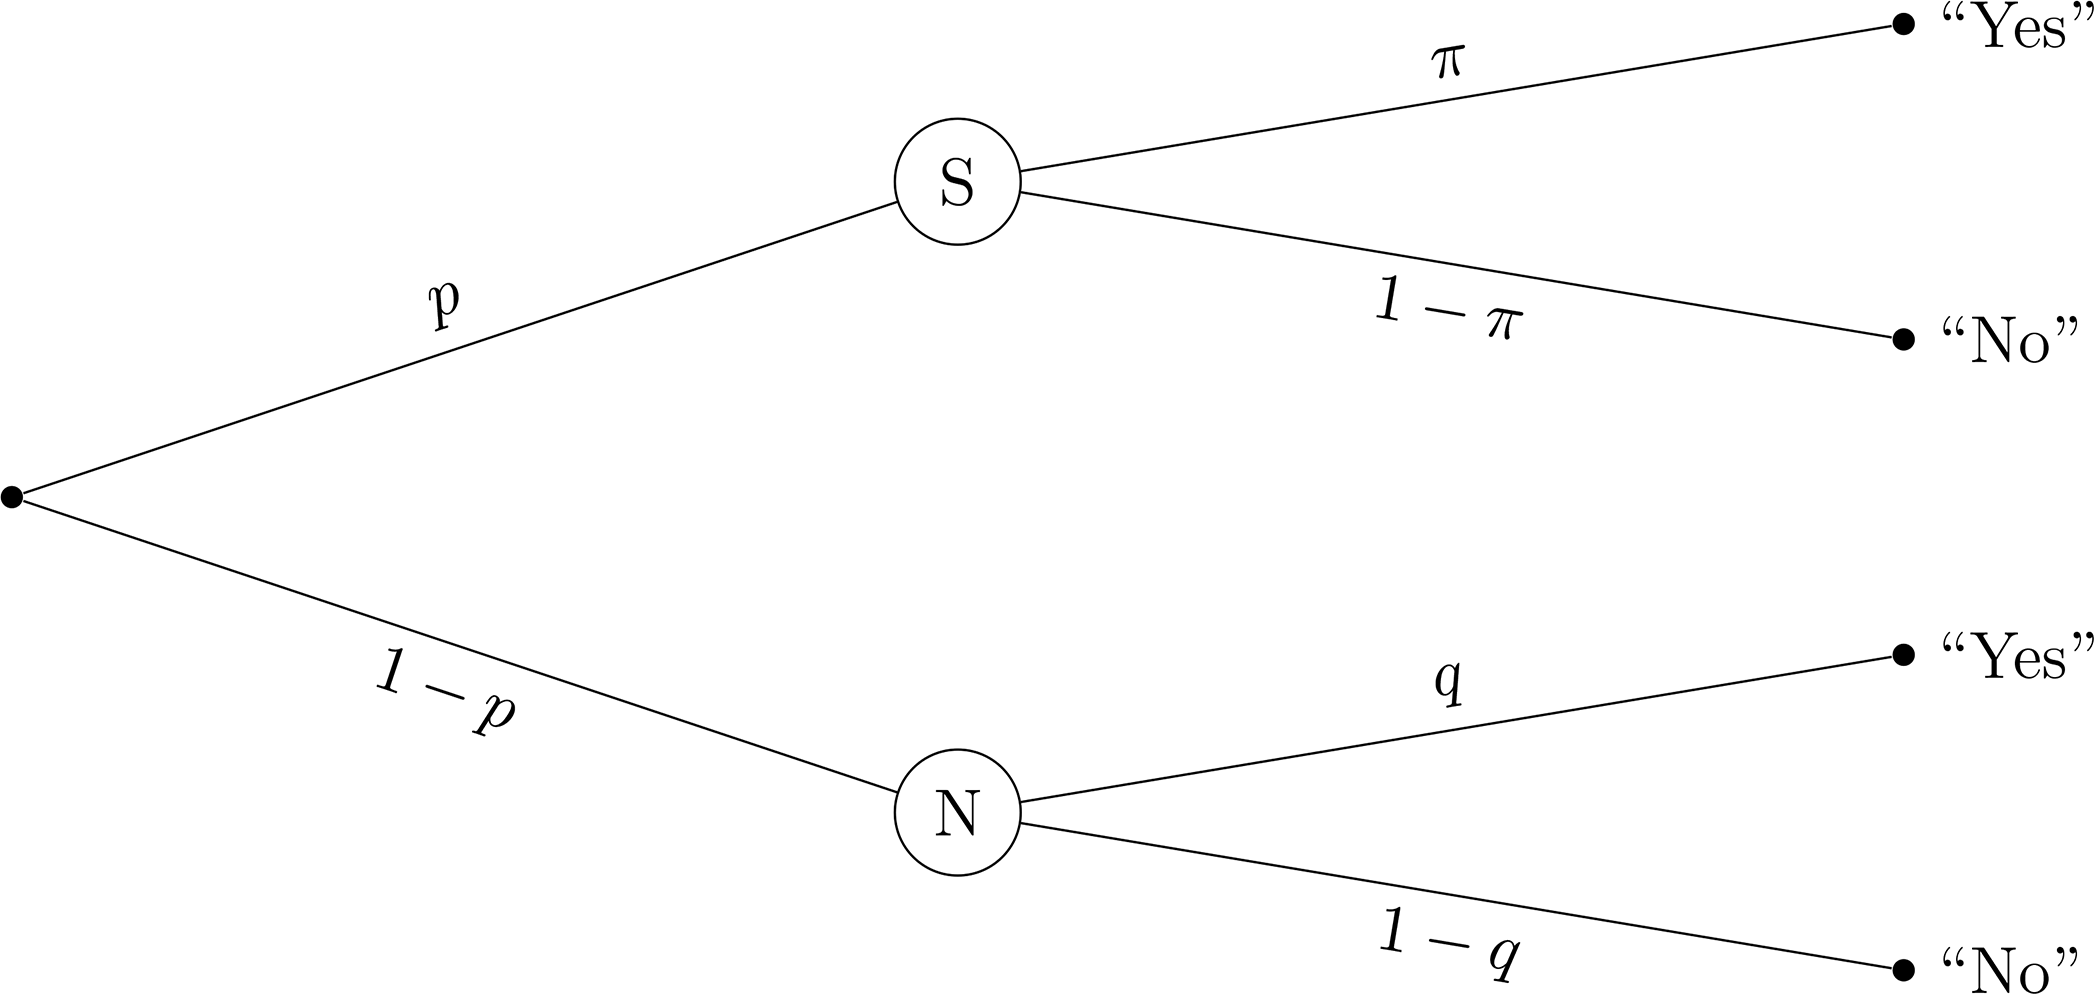
Another major advantage of embedding the cheating concept within the UQM is that it is possible to test the model’s assumptions. In contrast to the CDM, the UQM incorporates a second design parameter that can be varied, namely the prevalence of the neutral attribute
From Figure 2, the probability of a “Yes” response in sample


Probability tree of the unrelated question model—cheating extension (UQMC).
Note. The prevalence of cheaters C is
The development and properties of the UQMC are described in more detail in Reiber et al. (2020). However, the validity of the model has so far not been investigated empirically. The aim of the present study was, therefore, to test the UQMC’s validity in an empirical investigation and to assess whether it provides an advantage over its predecessor model, the original UQM.
Present Study
There are different approaches to assessing a model’s validity. One widely accepted approach is to compare prevalence estimates with a known criterion, optimally on an individual level (e.g., Hoffmann et al. 2015). Unfortunately, the prevalences of highly sensitive topics are often not known, especially not on an individual level. Therefore, studies using this approach often use experimentally induced behaviors for sensitive characteristics, such as cheating for an extra pay-off in the survey (e.g., Hoffmann et al. 2015). However, these characteristics differ from those addressed in typical RRT applications because RRTs are most useful for investigating highly sensitive topics (see Lensvelt-Mulders et al. 2005). Therefore, in the present study, we chose another approach to assess the UQMC’s validity. Specifically, to test whether the cheating extension provides a more realistic model than the original UQM, the occurrence of cheating in a survey sample was tested and the general model fit was assessed and compared to that of the original UQM. Since we wanted the study to resemble a typical RRT application, we assessed a highly sensitive characteristic, that is, IPV.
Intimate partner violence
The term IPV incorporates physical, sexual, and psychological violence and controlling behavior toward a former or current intimate partner (World Health Organization 2012). The present study focused on physical IPV because this facet is easiest to explain to respondents in an online survey using concrete examples of behavior (here “shoving, slapping, hitting, kicking, or punching”). Other forms of violence, such as “humiliation” as an example of psychological violence, can be much more difficult to identify as violence for survey respondents. The lifetime prevalence of physical and sexual IPV against women in the European Union was estimated to be 22% in a survey by the European Agency for Fundamental Rights (2014) and the 12-month prevalence to be 4%. The Federal Criminal Police Office reported 141,792 cases of attempted or committed IPV in Germany in 2019 (Bundeskriminalamt 2020), that is, 17.3% of all reported violent crimes (including non-partner violence). Of these, 61.2% were actual bodily harm (“einfache Körperverletzung”). Of all IPV victims in the criminal statistic, 26,889 were male and 114,903 female. Numbers such as these contribute to the assumption that IPV is mainly perpetrated by men against women. However, there is an ongoing debate about gender (a)symmetry with respect to varying characteristics of both the specific type of violence investigated and the survey method (e.g., Archer 2000; Johnson 2006; Kimmel 2002). For instance, the lifetime prevalence of physical IPV victimization in the US was estimated to be 30.6% among women and 31.0% among men in the National Intimate Partner and Sexual Violence Survey (Smith et al. 2018), whereas the prevalence of severe physical violence victimization was estimated to be 21.4% among women and 14.9% among men. Generally speaking, estimates vary strongly between studies due to differences in the applied measures and samples (see, e.g., Devries et al. 2013; Garcia-Moreno et al. 2006; Kimmel 2002; Waltermaurer 2005).
As outlined at the beginning of this paper, IPV is a highly sensitive topic, that is, exactly the kind of topic for which RRTs were developed and thus suitable for the present validation study. Furthermore, several articles in scientific journals and the media reported rising numbers of IPV in the context of the impact of the spread of COVID-19, which was declared a pandemic by the World Health Organization in March 2020 (e.g., Bradbury-Jones and Isham 2020; Emundts 2020; Jarnecke and Flanagan 2020). The pandemic and the measures implemented to contain it are believed to foster factors associated with IPV, such as increased material worries or restricted possibilities to avoid the perpetrator and seek help (Usher et al. 2020). The rising numbers of criminal reports corroborate this argumentation, highlighting the relevance of investigating the dark figure of IPV. Thus, we applied the UQMC to estimate the prevalence of physical IPV during the first COVID-19 contact restrictions in spring and early summer 2020 in Germany to assess the model’s empirical adequacy in a context that is relevant and representative of RRT applications.
Sensitivity Manipulation
To further test the UQMC, we employed an experimental manipulation of the sensitivity of the question: respondents were either queried about their role as a victim of IPV or as a perpetrator of IPV. As mentioned before, both roles are associated with stigma and are perceived as socially undesirable. However, being a perpetrator is even legally incriminating and has been shown to have an even stronger association with social desirability (Sugarman and Hotaling 1997). We therefore expected the question on the perpetration of IPV to be more sensitive than the question on the victimization of IPV. Consequently, we expected cheating to be more pronounced in the subsample queried about perpetration. We restricted our sample to participants who were, at the time of the investigation, in a romantic relationship with exactly one person. This way, the true proportion of perpetrators and victims should be equal in our sample. Assuming that differences in honesty of responding would be captured by the cheating parameter, any differences between estimates of the prevalence of honest carriers should be reflected in complementary differences in cheating estimates. Specifically, we expected that, if there was significant cheating, (a) it would be estimated to be higher in the subsample queried about perpetration and that (b) the prevalence of honest carriers would be estimated to be lower in the subsample queried about perpetration. If there was no significant cheating, the prevalence of honest carriers was expected not to differ between the subsamples.
Objective
To summarize, the aim of the present study was to assess the empirical validity of the recently devised UQMC (Reiber et al. 2020) in a survey on the prevalence of IPV. To this end, the fit of the UQMC was compared to that of its predecessor, the original UQM, and the occurrence of cheating was tested. Additionally, the queried IPV role was experimentally manipulated to investigate the differential influence of the question sensitivity on cheating.
Methods
Participants
Participants were recruited from the participant panel of the market research institute respondiAG with a target sample size of 4800. Quotas to approximate population proportions were installed for gender, age, and highest educational achievement. The target quotas are depicted in Table 1.
Sample Demographics.
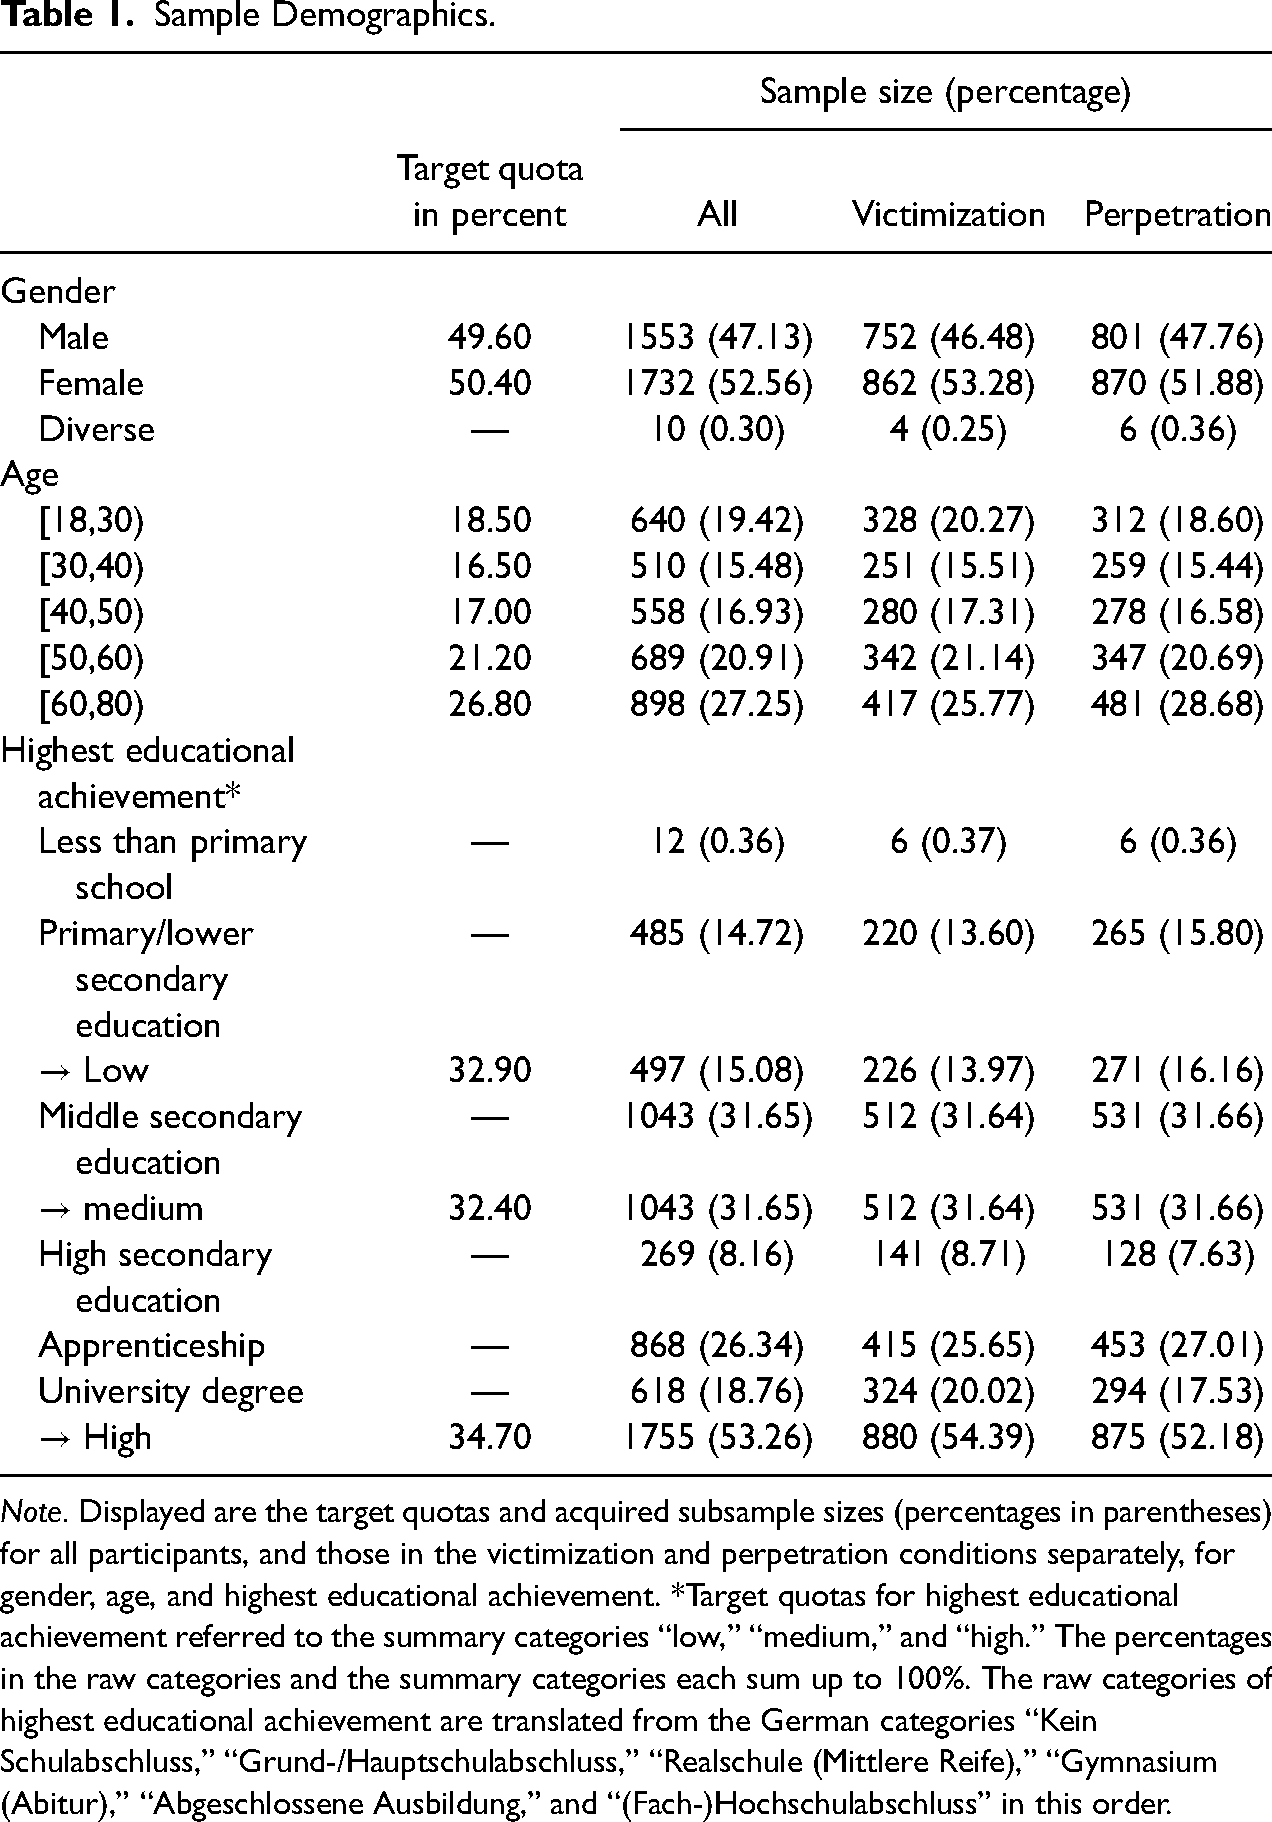
Note. Displayed are the target quotas and acquired subsample sizes (percentages in parentheses) for all participants, and those in the victimization and perpetration conditions separately, for gender, age, and highest educational achievement. *Target quotas for highest educational achievement referred to the summary categories “low,” “medium,” and “high.” The percentages in the raw categories and the summary categories each sum up to 100%. The raw categories of highest educational achievement are translated from the German categories “Kein Schulabschluss,” “Grund-/Hauptschulabschluss,” “Realschule (Mittlere Reife),” “Gymnasium (Abitur),” “Abgeschlossene Ausbildung,” and “(Fach-)Hochschulabschluss” in this order.
To participate, respondents had to declare that they were at least 18 years old and currently in a relationship with one person. Participants who indicated that they were younger than 18 years or that they were in no romantic relationship or in a romantic relationship of equal importance with more than one person, were screened out before answering the questionnaire. Participants who fell into an age, gender, or education level category for which the quota was already full were also screened out. To ensure data quality, an attention check question was included in the questionnaire and participants who failed to answer this question correctly were screened out before finishing the questionnaire. Section A of the online supplemental materials contains information on participant dropout per page.
The total data set consisted of 4804 participants who reached the last page of the questionnaire. Of these, 1326 participants who failed to answer the second of two training questions correctly, described in more detail later, and 183 participants with a mean response time of less than half of the median of each page (relative speed index, RSI; Leiner 2019) were excluded from the analysis.
After exclusion, the final sample consisted of 3295 participants with a mean age of 47.35 years (
Of the final sample, 1618 (49.10%) answered the question on the victimization of IPV. They did not differ from those who answered the question on perpetration with respect to age,
Design
The prevalence of IPV was assessed using one of two sensitive questions. Participants were either asked if they had experienced IPV (victimization role) or if they had committed IPV (perpetration role). They were randomly assigned to either of these role conditions, which only differed in the phrasing of the sensitive question itself. The sensitive question in the victimization condition read: “Have you, in your current relationship, since 23 March, been intentionally physically assaulted by your partner?” 5 In the perpetration condition it read: “Have you, in your current relationship, since 23 March, intentionally physically assaulted your partner?” 6 The date 23 March was chosen because it marks the date on which contact restrictions as a means of containing the spread of COVID-19 were officially announced in Germany. Participants were reminded of this context before answering the IPV question.
The sensitive question was presented within a UQMC design. Specifically, participants were instructed to think of a person whose birthday they knew and keep that birthday in mind. If the birthday was within a certain range of days in a month, they were asked to respond to a neutral question A and if it was in the remaining days of a month they were asked to respond to the sensitive question B. This range of days in a month determined the randomization probability
The combination of the factors role condition,
Condition Allocation.
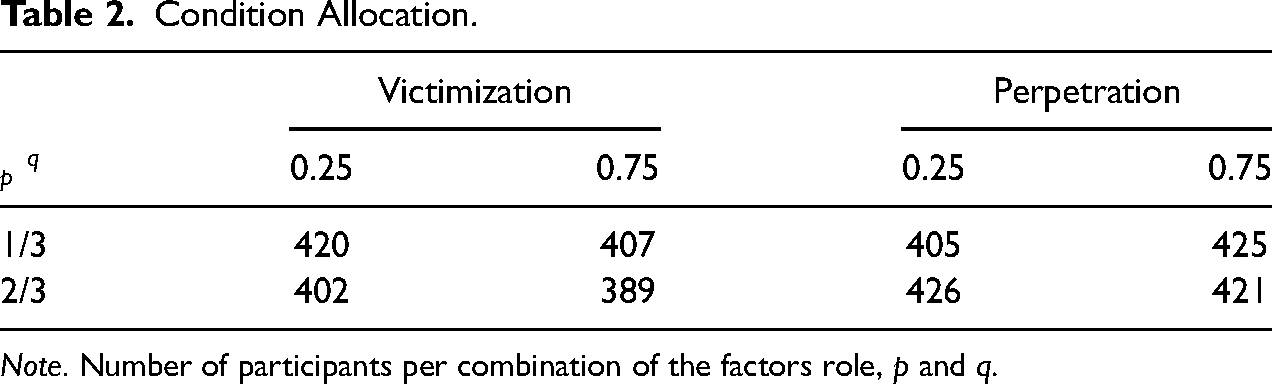
Note. Number of participants per combination of the factors role,
Procedure
The questionnaire was created using the software SoSci Survey (Leiner 2020). The survey administration period lasted from 29 June 2020 to 15 July 2020.
On being directed to the survey via a link distributed by respondiAG, participants received general information about the study and were asked to confirm their informed consent. Only participants who did so were directed to the following pages of the questionnaire. First, they answered demographic questions on age, gender, highest educational achievement, and relationship status for screening and quota checks. Then they received detailed instructions on the UQMC together with an example involving the abuse of illicit drugs as a sensitive question. All participants completed two UQMC training questions. In each one, they received a vignette of a fictional person who is asked whether they took illicit drugs within a UQMC design. This design was, for each participant, exactly the same as in the question on IPV, with the difference that the sensitive question was on taking illicit drugs instead of IPV and that participants did not have to answer for themselves but for the fictional person. This way, it was possible to provide feedback on the response, because the correct answer was known from the vignette. In both cases the correct response was “Yes” but only once because the fictional person had taken illicit drugs. In the other case, the correct response was “Yes” as an answer to the neutral question although the person had not taken illicit drugs. This was meant to demonstrate anonymity protection. Participants who did not respond correctly to the second training question were later excluded from the analysis. After completing the training questions participants were informed about the definition of physical IPV and the relevant time period beginning 23 March, that is, during the first contact restrictions due to the COVID-19 pandemic in Germany. Participants then completed the IPV question within the UQMC design in one of the above described eight conditions. On the following two pages, participants were asked to provide information on their living conditions during the considered time period. A list of the questions is in Section B of the online supplemental materials. Among the additional questions was an attention check (“Which of the following cities is not in Germany?”—Berlin, Hamburg, Cologne, London, Frankfurt, Munich). Participants were expected to be able to answer this question if they were paying attention and, thus, participants who failed to answer correctly were excluded from the survey. On the last survey page, participants were provided helpline information for victims and perpetrators of IPV before being redirected to the site of respondiAG.
Data Analysis 7
Data exclusion
Participants who responded incorrectly to the second of two UQMC training questions were excluded from the analysis. Because the training questions were very similar to the IPV question, failing to answer the second training question correctly was taken as an indicator for unreliable statements in the IPV question. We excluded 1326 participants, that is 27.60%, because they did not meet this criterion. This is a surprisingly high number, especially because only 866, that is 18.03%, failed to respond correctly to the first training question. Even though it is unclear why so many participants failed to answer the second training question correctly, this casts doubts on the validity of this criterion. However, the main results of this study are not strongly affected by inclusion or exclusion of the respective participants. Section C of the online supplemental materials contains the results of the analyses including participants who answered the second training question incorrectly. Differences between the two analyses are largely explainable by differences in power.
Additionally, 183 fast respondents with an RSI (Leiner 2019) above 2.00 were excluded from the main analysis. The RSI measures the participants’ screen processing times relative to the screens’ median processing times averaged across all screens. Therefore, an RSI above two indicates that the participant, on average, proceeded to the next screen twice as fast as the median of respondents. This can be used as an indicator for careless responding (Leiner 2019).
The participants’ gender was included as a control variable in most analyses because of the inconclusive findings in the literature concerning its association with IPV. Whenever it was included, participants who indicated diverse gender were excluded from the analyses because the group was too small to be included as a separate factor level.
Parameter Estimation and Assessment of Model fit
All models were fitted by optimizing the
Analysis of Role Conditions
To test the influence of the role manipulation within the UQMC, a full logistic model including baseline cheating and honest carrier prevalence parameters as well as parameters for the factor Role (victimization vs. perpetration), the factor Gender (male vs. female), and interaction terms was fitted by optimizing the 

All analysis scripts and a preregistration of the study are on the Open Science Framework (OSF; https://osf.io/9bna3/).
Results
Estimation and Model fit
Table 3 depicts UQM and UQMC parameter estimates and their standard errors for the four subsamples following from the allocated role condition and participant gender. Due to the beginning of the contact restrictions on 23 March and the survey administration period from 29 June to 15 July, the estimates refer to 3 to 3.5 month IPV prevalences. The estimates for physical IPV without accounting for cheating, that is
Model Estimates.
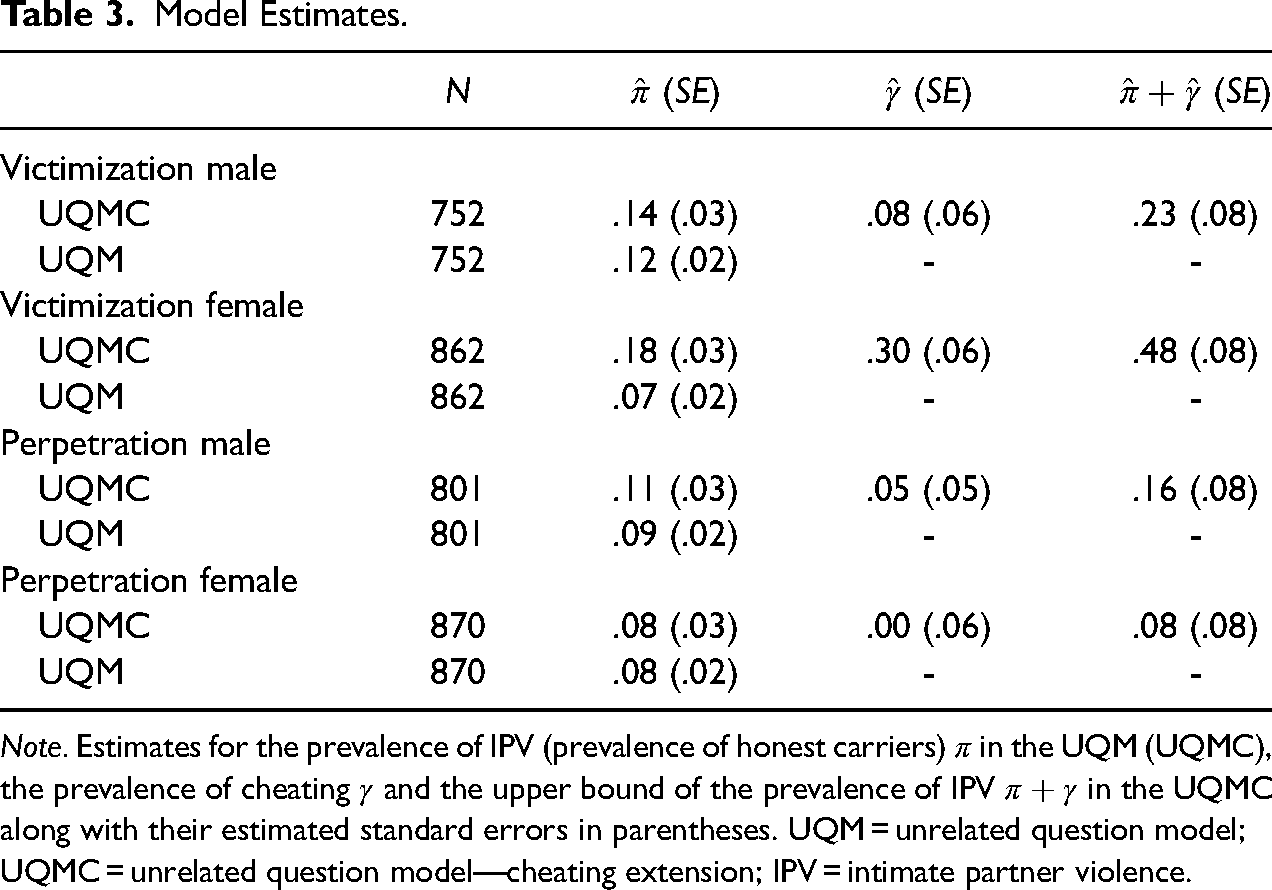
Note. Estimates for the prevalence of IPV (prevalence of honest carriers)
The latter outcome is consistent with the results of the model comparison in Table 4. The model fit of the UQMC is better than that of the UQM with respect to all model comparison criteria only for this subsample. Within this subsample, the UQM’s
Comparison of the UQM and the UQMC.
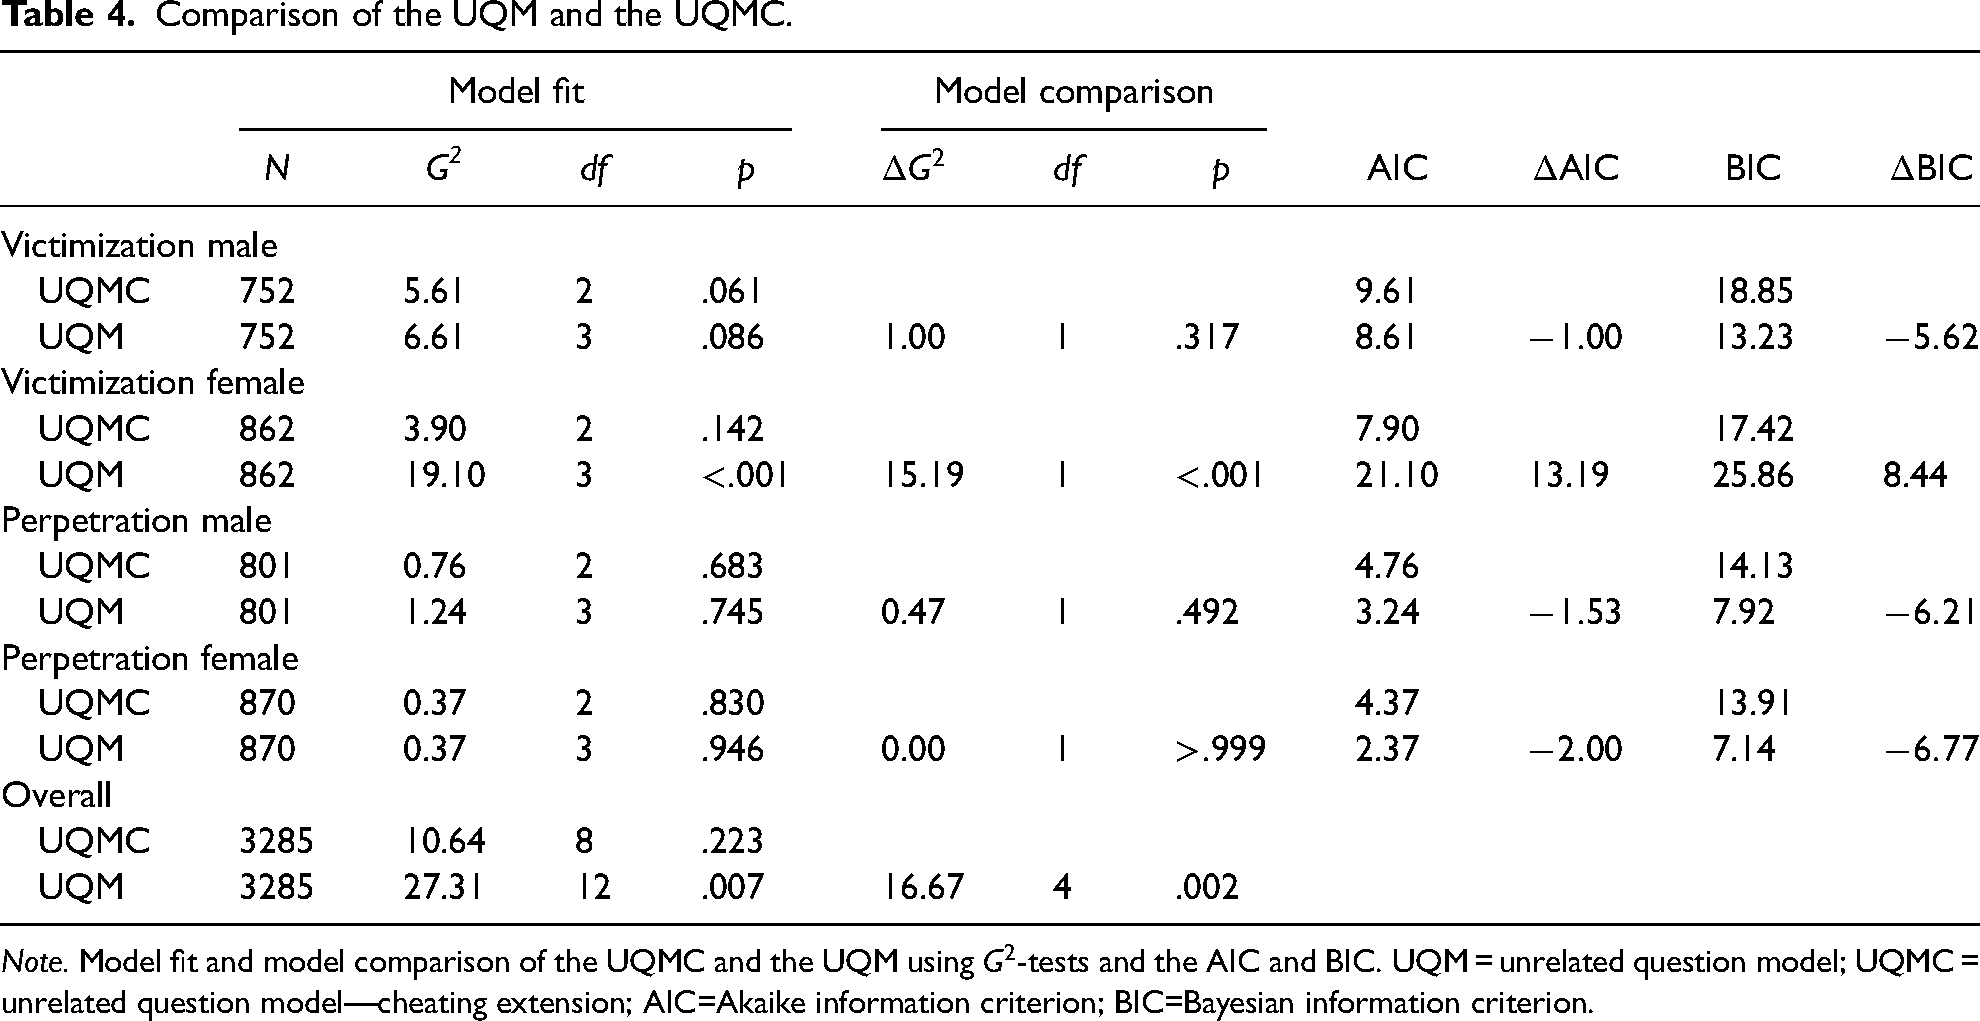
Note. Model fit and model comparison of the UQMC and the UQM using
The last two rows in Table 4 depict the overall model fit of the UQM and the UQMC using the
When cheating is taken into account, the plausible range of estimates for the prevalence of IPV is indicated by the interval [
The estimates do not indicate a clear gender effect. An effect of the role condition is more apparent in the UQMC’s estimates, especially in the subsample of female participants. Consequently, the effects of the role condition on the UQMC’s estimates and their interactions with gender were tested in a logistic model. The main effects of gender were not specifically tested because there were no founded expectations due to the inconclusive findings on the gender differences in IPV.
Analysis of the Role Condition
The results of testing the effects of the role condition on the IPV prevalence and cheating are in Table 5. Each row of this table includes
Tests for Differences Between the Role Conditions.
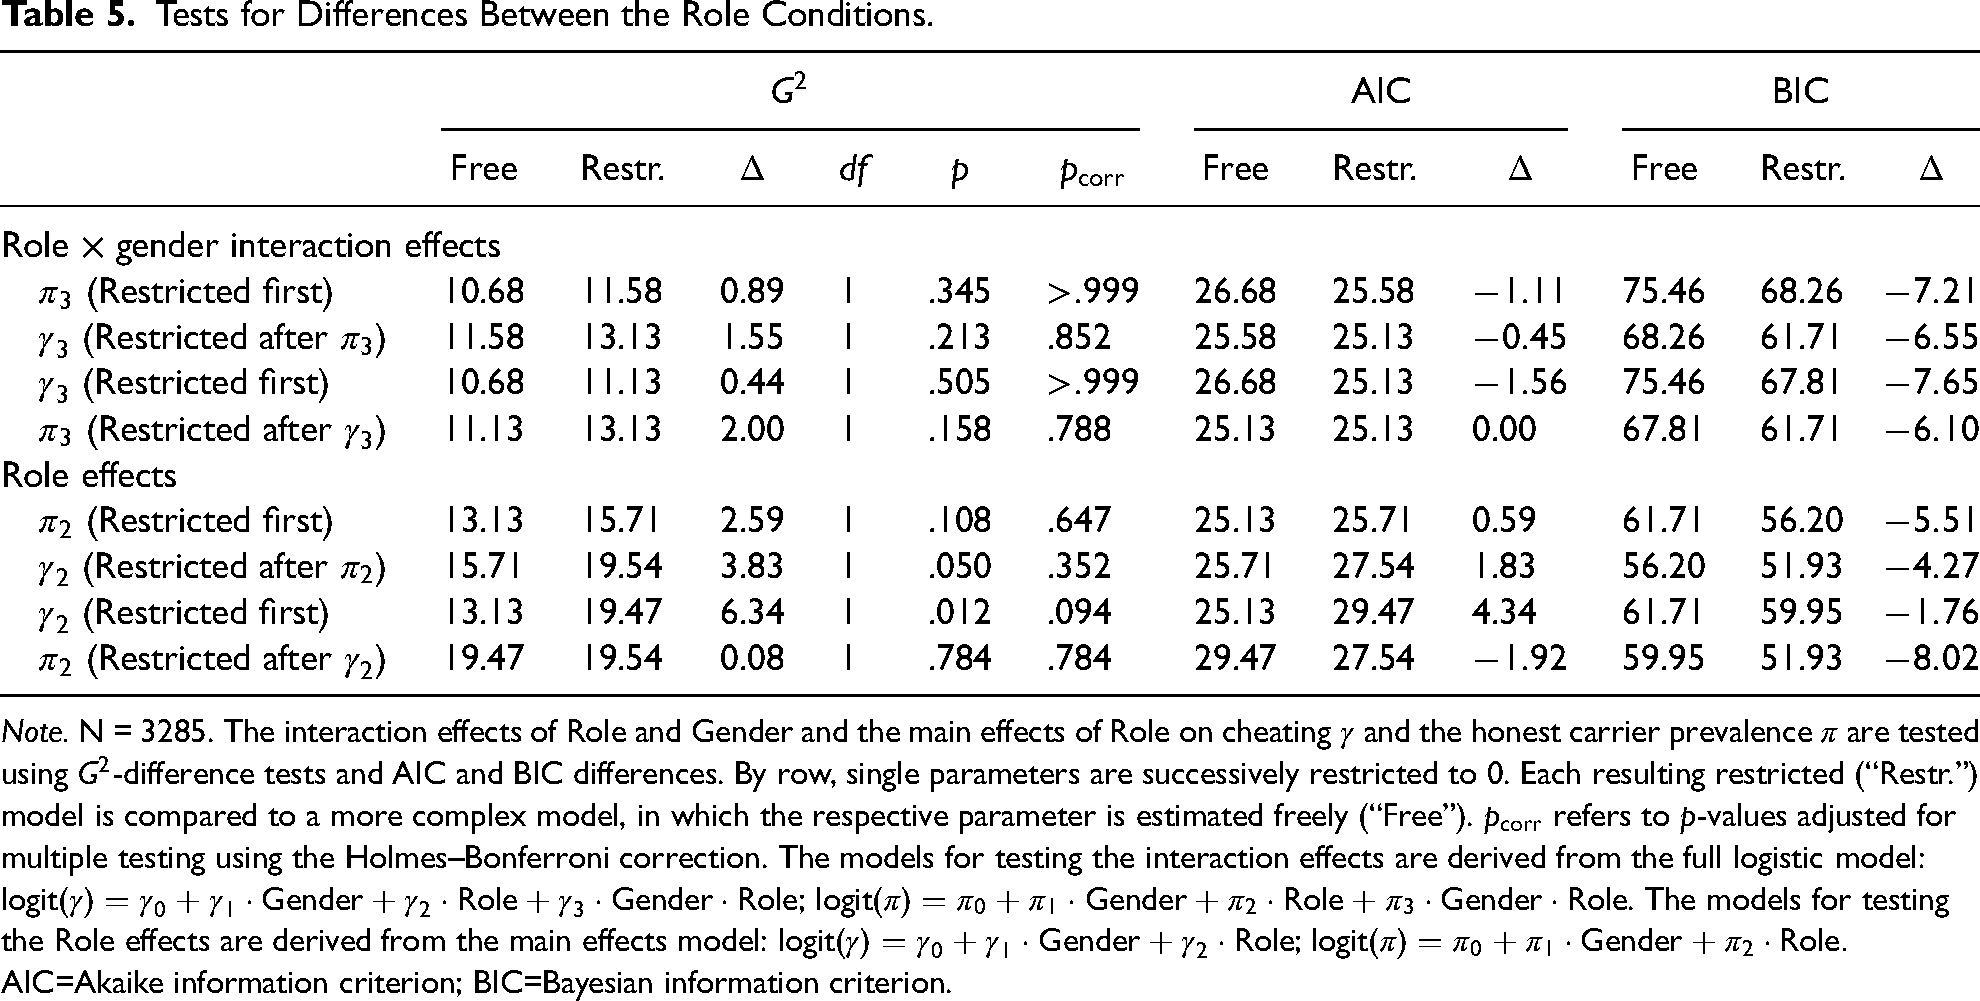
Note. N = 3285. The interaction effects of Role and Gender and the main effects of Role on cheating
To summarize, we found (a) no interaction of role condition and participants’ gender and (b) no significant main effect of role condition on the honest carrier prevalence or cheating. Specifically, contrary to our expectations, the prevalence of cheaters
From the effect size estimates, separate predictions for the UQMC parameters for both role conditions can be derived. For IPV victimization, the predicted honest carrier prevalence is
Discussion
The current study was conducted to assess the validity of the UQMC (Reiber et al. 2020) in an applied setting. To that end, we investigated IPV in a UQMC design in an online survey. We assessed the fit of the UQMC and compared it to the fit of the UQM not accounting for cheating. Additionally, respondents were either queried about IPV victimization or perpetration because we expected this manipulation of question sensitivity to influence cheating. In light of the inconclusive prior findings on gender differences, we either conducted the analyses separately for male and female respondents or included gender as a control variable.
The overall model fit of the UQMC is acceptable and it is superior to the fit of the UQM, which cannot account for cheating. The biggest advantage is observable in the subsample of female participants queried about the victimization of IPV. In this group, the prevalence estimate of cheating is 30%. Thus, especially in this group of respondents, accounting for cheating allows responses to be more accurately described.
However, the effects of the IPV role condition manipulation are not as expected. Contrary to our expectations, cheating is estimated to be higher in the subsamples queried about victimization. Also, in the logistic model, the observed effect of the IPV role condition on cheating is not as expected and numerically even opposite to our expectations. Theoretically, this could mean that perpetrators are less reluctant to report their behavior than victims 9 , but this is not in line with the previous literature, which showed that reporting of perpetration is stigmatized (e.g., Schröttle 2015; Franke et al. 2004) and associated even stronger with social desirability than victimization (Sugarman and Hotaling 1997). Moreover, if perpetrators were open to reporting their behavior and victims were reluctant to do so, the honest carrier prevalence of perpetration should be higher than that of victimization. Specifically, because the sample only consists of persons in an exclusive relationship, the true prevalence of IPV victimization and perpetration should be the same and, therefore, differences in the honest carrier prevalence should result from complementary differences in cheating. However, the prevalence estimate of honest carriers is not lower but numerically even higher in the subsample queried about victimization. In other words, the manipulation of the IPV role did not affect the parameters in different directions, indicating that the model’s parameters are not complementary. This is not in line with the reasoning behind these parameters.
To summarize, although the general model fit is good (and therefore the model’s assumptions seem to hold), we were not able to differentially manipulate the model parameters. In the following, three possible explanations for this inconsistency are outlined.
First, the inconsistency might be due to selective sampling. The expectations concerning the parameter relationship between role conditions are based on the assumption that the true prevalence of IPV perpetration and victimization in the assessed sample is the same. Yet, this does not necessarily have to be true. For example, IPV perpetrators could have decided to abort the survey more often than victims of IPV once they realized the content of the question. This would mean that the honest carrier and cheating prevalence are not complementary and explain how both can be higher in the victimization condition. However, the general dropout rates are not high enough to completely explain the inverted data pattern (see Section A of the online supplemental materials). Especially the dropout rates on the screen on which the queried role became apparent are very low (victimization:
Second, there could be violations of the model assumptions which are mathematically consistent with the UQMC and thus not detectable merely by computational tests of model fit. For example, the UQMC inherited the assumption from the CDM that cheating is equally likely among respondents instructed to respond to the sensitive question and respondents instructed to respond to the neutral question. However, this need not be the case. Therefore, in the original presentation of the UQMC (Reiber et al. 2020), the possibility of partial cheating was outlined. In this framework, in addition to the two categories of respondents defined in the UQMC, that is, honest respondents and cheaters, there is a third category termed partial cheaters. This group of respondents would respond honestly if directed to answer the neutral question but give a self-protecting “No” response if directed to the sensitive question. Interestingly, following this logic, the estimation of the model parameters does not change. Specifically, the prevalence of cheating
Third, following a more substantive line of reasoning, differences in the individual interpretations of IPV by the participants could account for the data pattern. The UQMC is only capable of detecting deliberate cheating. Therefore, the hypotheses depend on the assumption that not only the true prevalence of IPV victimization and perpetration is equal, but also the perceived prevalence. However, it has been proposed that perpetrators and victims judge the same instance of IPV differently (see Follingstad and Rogers 2013). Specifically, the same situation can be reported as violent by the suspected victim but not by the suspected perpetrator. In such a case, a perpetrator not admitting to a violent act, which was perceived as violent by the victim, would not be a cheater in the sense of the UQMC. We decided to assess only physical IPV and provided specific examples in the instructions to minimize the likelihood of self-deception. However, it might still have played a role. This would explain why the lower estimated perpetration prevalence in the current study is not explainable by higher cheating.
Apart from these accounts there are limitations of the present study which might have influenced the results. On the one hand, it was crucial for the premises of our experimental manipulation that the participants were in a relationship with exactly one person. However, the relationship status in itself is a sensitive topic since in most social groups being in a committed relationship with one person still constitutes the norm. By only contrasting “being in a committed relationship with one person” to “not being in a relationship” or “being in more than one relationship of equal importance” in the respective screening question, we tried to minimize social desirability bias. However, it is still possible that some respondents chose to respond that they were in a committed relationship with one person although they were not. Nevertheless, this would only influence the results pattern if the likelihood of this response tendency differed strongly between perpetrators and victims of IPV.
On the other hand, there was a high proportion of respondents (27.60%) who did not respond correctly to the second training question. This calls into doubt that the instructions were sufficiently understood. Given that the probability to guess the correct response is 50%, this would in the worst case mean that another 30% did not fully understand the instructions. However, this seems unlikely because the rate of incorrect responses to the first training question was much lower (18.03%). Instead, since respondents did not know that an incorrect response to the second training question would lead to an exclusion of their data, they might not have paid attention to this question after correctly answering the first one. Therefore, the high proportion of incorrect responses could be not as much indicative of a major problem with understanding the instructions but rather that this preregistered exclusion criterion was sub-optimal. Still, this exclusion criterion did not substantively influence the results pattern either, as indicated by the additional analyses in Section C of the online supplemental materials.
Whether any of these accounts are actually responsible for the observed inconsistencies in the data pattern is, of course, not testable using the given data. However, the applied design enabled us to detect these inconsistencies and come up with plausible explanations. Surveys using direct questions or a simple RRT design are probably also affected by unexpected response patterns. In these cases, however, the inconsistencies do not become visible. Using the design applied in this study, we could, first, measure a specific type of instruction non-adherence, namely cheating, and the results indicate that especially among female participants queried about IPV victimization cheating is highly prevalent. Second, the unexpected effects of experimentally manipulating the queried IPV role indicated that additional factors influence the estimates. Although we can only speculate about these factors, detecting inconsistencies itself has important implications. It shows that the estimates need to be treated with caution—something that is arguably true for any survey on IPV.
All of the outlined explanations suggest that the IPV prevalence estimates in this study rather represent a lower limit to the true prevalence of IPV during the period of about three months starting with the initiation of the first contact restrictions due to the COVID-19 pandemic in Germany. However, even the lower limit estimates of about 10% are already very high for such a short time period. Therefore, although the exact numbers need to be interpreted carefully and, of course, a direct comparison to other time periods is not possible, the presented results are in line with the literature reporting high numbers of IPV in the context of the COVID-19 pandemic and the related containment measures (e.g., Steinert and Ebert 2020).
Conclusion
The purpose of the current study was to validate the UQMC, an extension of the UQM, to account for self-protecting responses. To that end, we conducted an online survey on IPV during the first contact restrictions due to the COVID-19 pandemic in Germany. The UQMC provides a reasonable account of the data, which is superior to that of the UQM. The data indicate a high prevalence of IPV, which is in line with the increase in IPV related to the COVID-19 pandemic reported by many other sources. Some unexpected data patterns emerged, highlighting once more the difficulty of investigating sensitive research topics and the need for treating the respective estimates with caution. Nevertheless, testable RRT designs accounting for instruction non-adherence can provide more insight into the response process and, thereby, a better understanding of sensitive research topics.
Supplemental Material
Supplemental Material, sj-pdf-2-smr-10.1177_00491241211043138 - Self-protecting responses in randomized response designs: A survey on intimate partner violence during the coronavirus disease 2019 pandemic
Supplemental Material, sj-pdf-2-smr-10.1177_00491241211043138 for Self-protecting responses in randomized response designs: A survey on intimate partner violence during the coronavirus disease 2019 pandemic by Fabiola Reiber, Donna Bryce, and Rolf Ulrich in Sociological Methods & Research
Footnotes
Declaration of Conflicting Interest
The authors declared no potential conflicts of interest with respect to the research, authorship, and/or publication of this article.
Funding
The authors disclosed receipt of the following financial support for the research, authorship, and/or publication of this article: This research was funded by the Deutsche Forschungsgemeinschaft (DFG), grant 2277, Research Training Group “Statistical Modeling in Psychology” (SMiP).
Supplemental Material
Supplemental material for this article is available online.
Notes
Author Biographies
References
Supplementary Material
Please find the following supplemental material available below.
For Open Access articles published under a Creative Commons License, all supplemental material carries the same license as the article it is associated with.
For non-Open Access articles published, all supplemental material carries a non-exclusive license, and permission requests for re-use of supplemental material or any part of supplemental material shall be sent directly to the copyright owner as specified in the copyright notice associated with the article.