
Abstract
Response rates for surveys have declined steadily over the last few decades. During this period, trust in science has also waned and conspiratorial theorizing around scientific issues has seemingly become more prevalent. In our prior work, we found that a significant portion of respondents will claim that a given survey is “biased.” In this follow-up research, we qualify these perceptions of bias and point to potential causes and ameliorative mechanisms.
Introduction
Survey research has become increasingly challenging. In many nations, response rates have continued a steady decline for decades, and the costs and time involved with collecting survey data have risen with it (Connelly et al., 2003; Curtin et al., 2005; Keeter et al., 2017). Still, social surveys are a cornerstone of social science research and are routinely used by the government and private sector to inform decisions making. Yet informed commentators have occasionally questioned the viability of survey research moving forward and called for changes in the way that we collect survey data (Couper, 2013; Miller, 2017). Further, events in the U.S.—such as the surprise election of Donald Trump to the presidency in 2016—have contributed to a growing public scepticism of surveys (Cohn, 2017).
Concomitant to this marked decline in response rates has been a significant loss of trust in major social institutions, especially in the United States. The public reports much lower trust in science than in the past, and this growing distrust is concentrated, though not exclusive to, people who identify as conservative or Republican (Evans and Hargittai, 2020; Gauchat, 2012; Mann and Schleifer, 2020; McCright et al., 2013).
Conspiracy theories about science abound, with perhaps most notably concerning climate change (Douglas and Sutton, 2015; Oreskes and Conway, 2011), the current COVID-19 pandemic (Allington et al., 2021; Bierwiaczonek et al., 2020; Jolley and Paterson, 2020) and even the origins of AIDS (Heller, 2015; Ross et al., 2006). Although the specifics of these conspiracy theories vary widely, they often involve claims that the scientific community is conspiring to harm to public, perhaps by manufacturing data, creating diseases in laboratories, pursuing a hidden agenda on behalf of shadowy actors, engaging in nefarious acts, or operating based upon “bias.” Notably, distrust in scientific agencies declined markedly during the COVID-19 pandemic, but only amongst people who identified as politically conservative (Hamilton and Safford, 2021)—the partisan gap in trust in scientific agencies grew from 10% points to 64% points over the course of the pandemic.
We suggest that survey methodologists should work to understand how this cultural backdrop influences their research. The experiences of our research team suggest that these perceptions matter for survey data collection. Our research team has collected primary data for dozens of research projects, primarily in the United States. Invariably, a few respondents will volunteer that our survey was “biased” for one reason or another—often referring suggesting that research was funded by partisan actors, or by industry. Anecdotally, we have had private communications with other scholars on this issue, and many noted that respondents would state that their surveys were “biased.” Perceptions of bias on behalf of survey researchers appear to be relatively common, and survey researchers may be less trusted now than in the past (Kim et al., 2011; Kuru et al., 2017) and other research has examined if respondents believe surveys are valuable and worthwhile (e.g. Stocké and Langfeldt, 2004). de Leeuw et al. (2019) developed a multi-dimensional framework including survey burden, enjoyment, and perceived value.
To the best of our knowledge, our research team conducted the only study of perceptions of bias among survey respondents in a study of energy and economic development issues in the U.S. mountain west region (Mayer, 2019). In this prior analysis, we found that nearly half of our respondents indicated that the survey was “biased.” In an open-ended question, we asked these respondents to explain what they meant by stating that the survey was “biased.” Some stated that the survey was biased in favor of the fossil fuel industry, while other stated that it was biased in favor of environmental interests. A few claimed that the survey was “liberal” or “leftist.”
Our prior work points to several research needs to understand these perceptions of bias and possible ameliorative mechanisms. We do not know the extent to which respondents perceive different types of biases (e.g. bias in favor of one cause or another, or for one political ideology or another), although our prior study implies that these perceptions may be common. Secondly, we know little about what can be done to ameliorate perceptions of bias, although our prior work implies that perhaps carefully pointing to the non-partisan nature of the survey might reduce these perceptions. In the next section, we describe the survey data we collected to extend our prior work on perceptions of bias and test a possible ameliorative mechanism.
Data
We rely on survey data collected in the western region of the state of Colorado in the United States. The survey was part of a larger long-term research project whose aim is to understand the economic and social consequences of the transitioning energy system in this region and explore development options for the region. Our study region is home to some 450,000 people (out of a state population of 5.8 million) and has historically relied upon the coal industry as a major employer and source of tax revenue. Yet the region is also home to booming renewable energy sector and a thriving tourism economy, among other economic sectors.
We contracted with the research firm Qualtrics to collect survey data. Social scientists are turning to online panels as they can provide data that effectively approximates the results produced by more conventional, and more cumbersome, modes of survey data collection (Kees et al., 2017; Porter et al., 2019; Walter et al., 2019). Online panels are especially appropriate for preliminary investigations of new topics and hard to reach populations, such as the current analysis. We collected data in October and November 2019.
Qualtrics aggregates online panels surveys that are distributed via various dashboards wherein potential respondents can select into surveys they may qualify for. Tracking begins as soon as respondents engage with the survey. The survey was completed in an average of 7.5 minutes. Four-hundred eighty-seven respondents began the survey, but 29 did not pass the initial geographic screening and 14 were ineligible due to their age (i.e. under 18). We performed a simple attention check midway through the survey, which all respondents passed. We elected to remove six respondents who completed the survey in an implausibly short amount of time. We also performed diagnostics on the data, looking for respondents who may have selected the same response for each question (i.e. the first or last answer in a series of categorical response options) but found no evidence of this problem. We ask that the reader bear in mind that response rates for more traditional survey modes like mail or random digit dial have no clear parallel in online panels. The survey was pre-tested with a convenience sample of Colorado residents. Several survey questions were adapted from our prior work or from the existing literature, implying that they were especially well-vetted. In the next section, we describe our novel indicators for perceptions of bias.
Perceptions of bias
Respondents were first asked “Do you think that this survey was biased?” with the response categories of “definitely yes,” “probably yes,” “probably no,” “probably yes.” Respondents who stated either of the “yes” categories were directed to a series of follow-up questions to clarify the nature of this bias. Given that this main survey concerned questions of energy and economic development in the mountain West, we asked respondents if the study was biased in favor of the coal industry or in favor of renewables. We also asked if they felt the survey had a liberal bias, or a conservative bias (Figure 1).
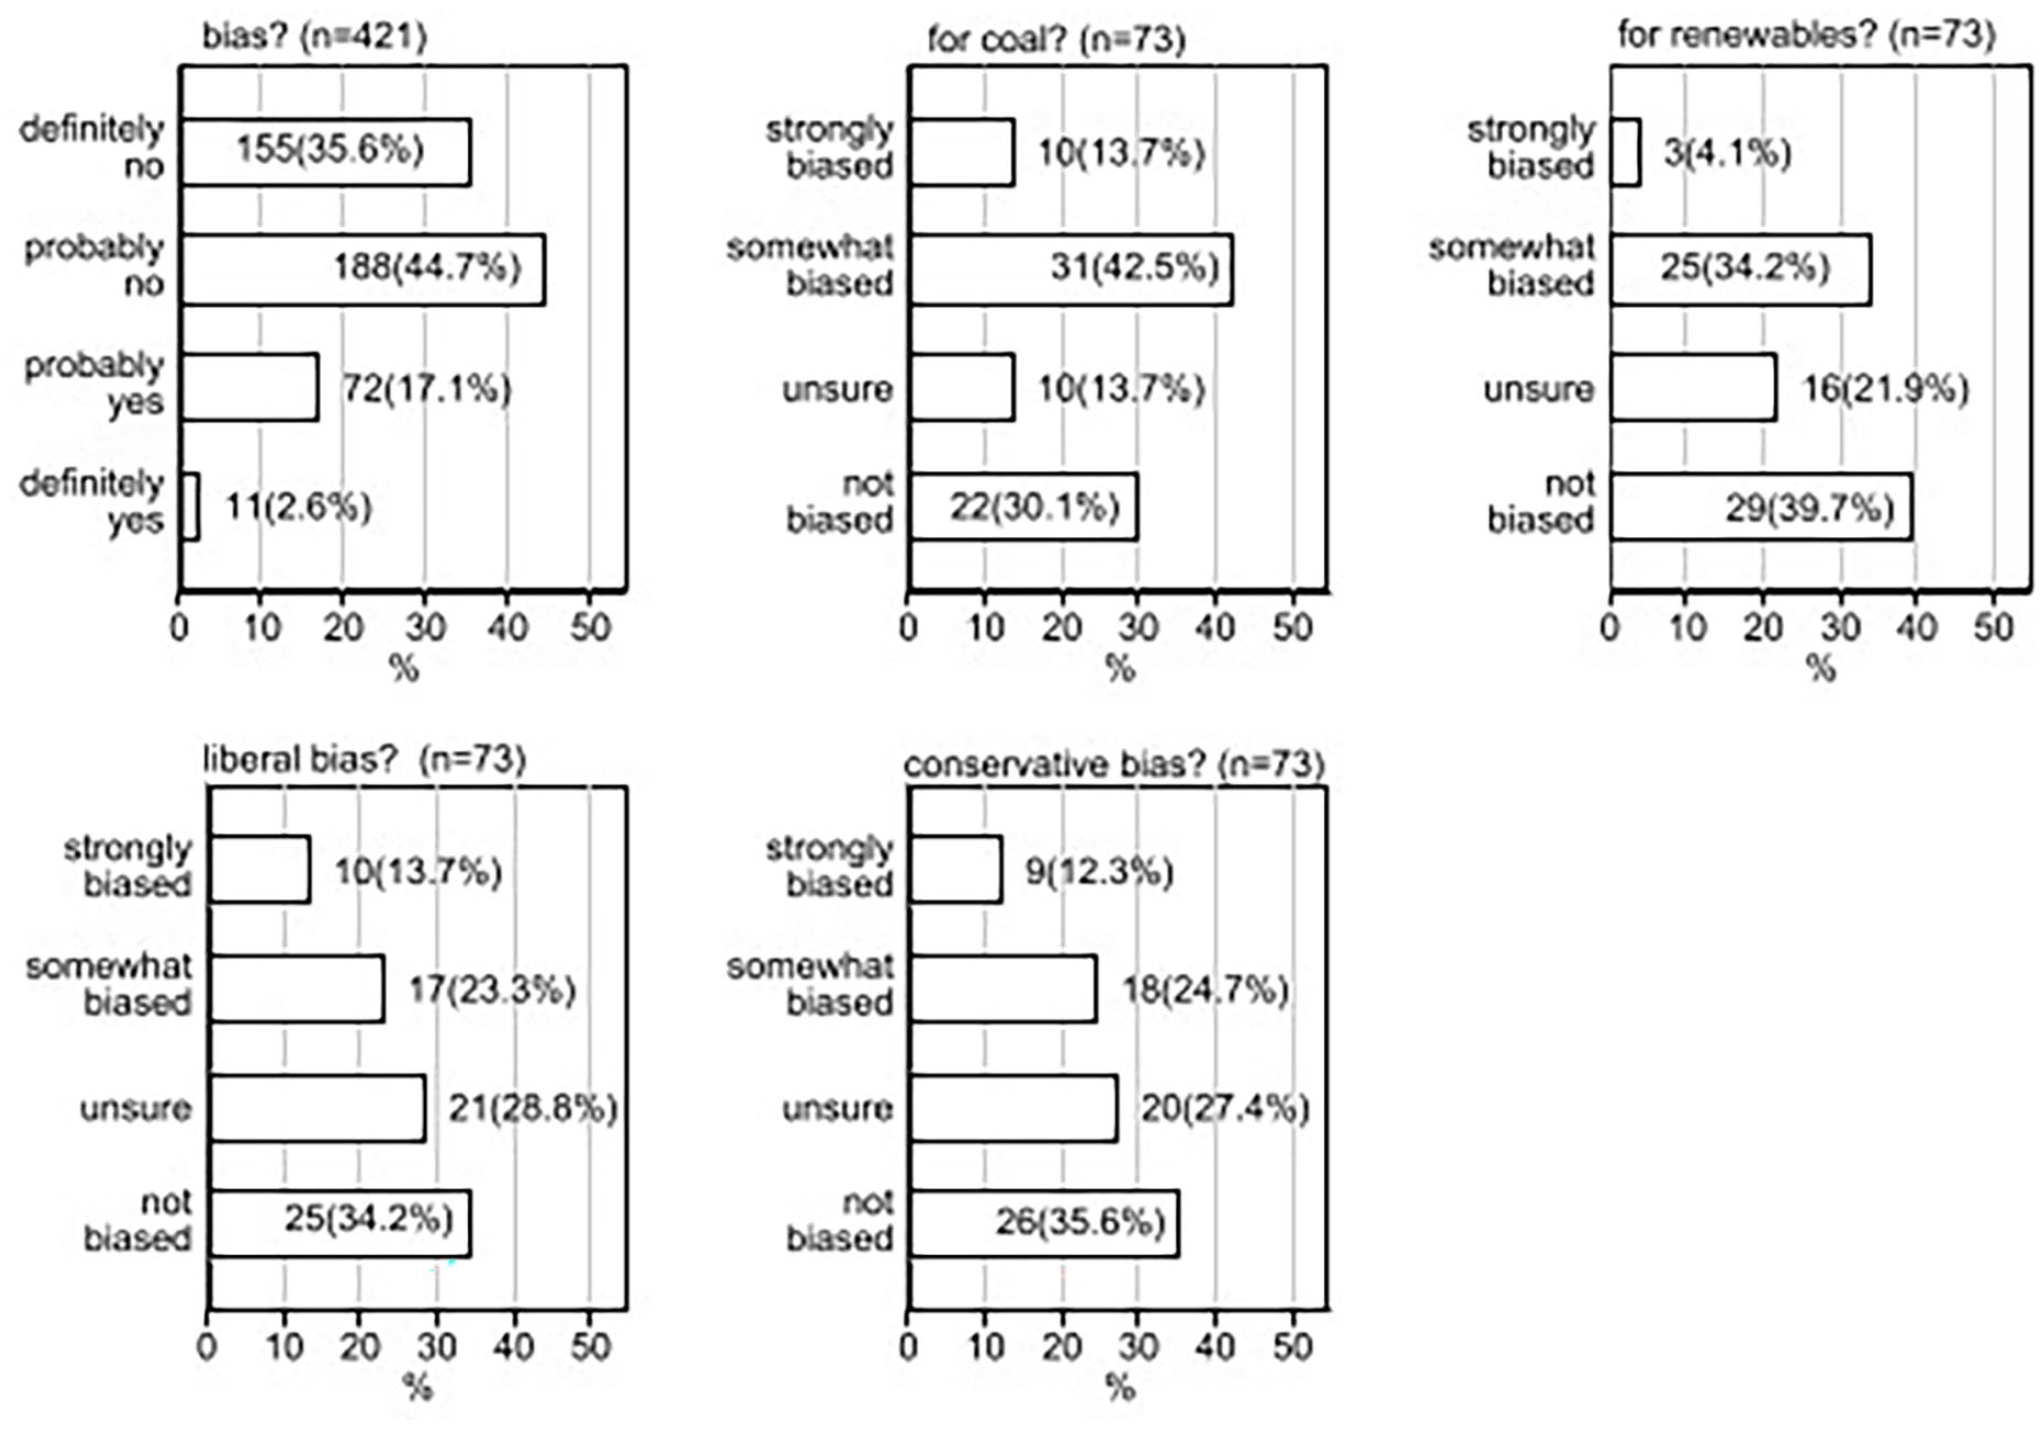
Perceptions of bias.
Notably, most of the respondents indicated that the survey was “probably” or “definitely not” biased (81.5%). Among the group stating that the survey was biased in some way, 41 respondents (or 51% of 73 respondents) indicated that the survey was biased in favor of coal, 38% felt that the survey was “somewhat” or “strongly” biased for renewables, some 37% perceived a liberal bias, and the same percentage stated that the survey was “strongly” or “somewhat” biased toward conservative ideas. Notably, significant portions who stated in the initial question that the survey held some bias answered “unsure” or “not biased” for many of the follow-up questions.
Ameliorative mechanism: Introduction wording
Based upon our prior work (Mayer, 2019) we suspected that a carefully worded introduction might reduce perceptions of bias. Accordingly, we randomly varied the wording of the introduction of the survey. The control group was not told the funding source of the survey and were not provided a statement about the political neutrality of the survey. The second was told about the funding sources for the study, and the third were told the funding sources and read the statement that the study was “not funded by industry or environmental groups.” We constructed a categorical variable to indicate which group the respondents were randomly assigned to.
Political variables
Earlier, we noted that trust in science has declined in the U.S., largely concentrated among those who identify as conservative or Republican. We used a predictor of political ideology—we recoded this variable from a seven-category scale of political ideology that ranged from extremely conservative to extremely liberal. Our recoded variable is organized into three categories: conservative, moderates, and liberals. We undertook this step because the nested nature of our survey design creates relatively small cell counts in some groups that could potentially contribute to biased estimates.
Analytic strategy
Our measures of bias are all categorical, ruling out the use of more conventional regression strategies like OLS. An additional challenge is presented by the nested nature of our survey, wherein respondents who indicated that the survey was “biased” were then provided with a series of follow-up questions. This creates a situation where our data is sparse across some categories of the outcome variables. To circumvent this problem, we dichotomized all other follow-up indicators of bias, combining the “yes” and “no” categories, respectively and use binary logistic regression to understand the effect of our predictors on our indicators of bias. For the binary outcomes, we deploy the “Firth” variant of binary logistic regression, that is more robust in small sample sizes (Firth, 1993; Wang, 2014).
However, we did not recode our initial indicator of bias because this question was asked of all respondents and the sample size is ample. Before estimating these regression models, we performed a correlational analysis between socio-demographics and time to completion using polychoric correlations (Olsson, 1979). Respondents were also provided a text box to further clarify their perceptions of bias. We analyzed this textual data using an inductive coding scheme. First, we turn to a correlational analysis presented in the next section.
Correlational analysis
We present polychoric correlations in Table 1. The first row displays polychoric correlation coefficients between the indicators of bias and completion time—we interpret time to complete the survey as a rough proxy of respondent engagement. Notably, there is a negative correlation between the general perceptions of bias, the perception that the survey favored renewables, the perception that the survey favored coal, and the perception that the survey possessed a liberal bias. That is, as respondents spent more time taking the survey, they were less likely to state that the survey was biased. The lone exception is perceptions of conservative bias, where the correlation coefficient is miniscule. None of the correlation coefficients emerged as statistically significant at an alpha level of 0.05, although some may be large enough to have practical importance.
Polychoric correlations between perceptions of bias, completion time, and socio-demographics.
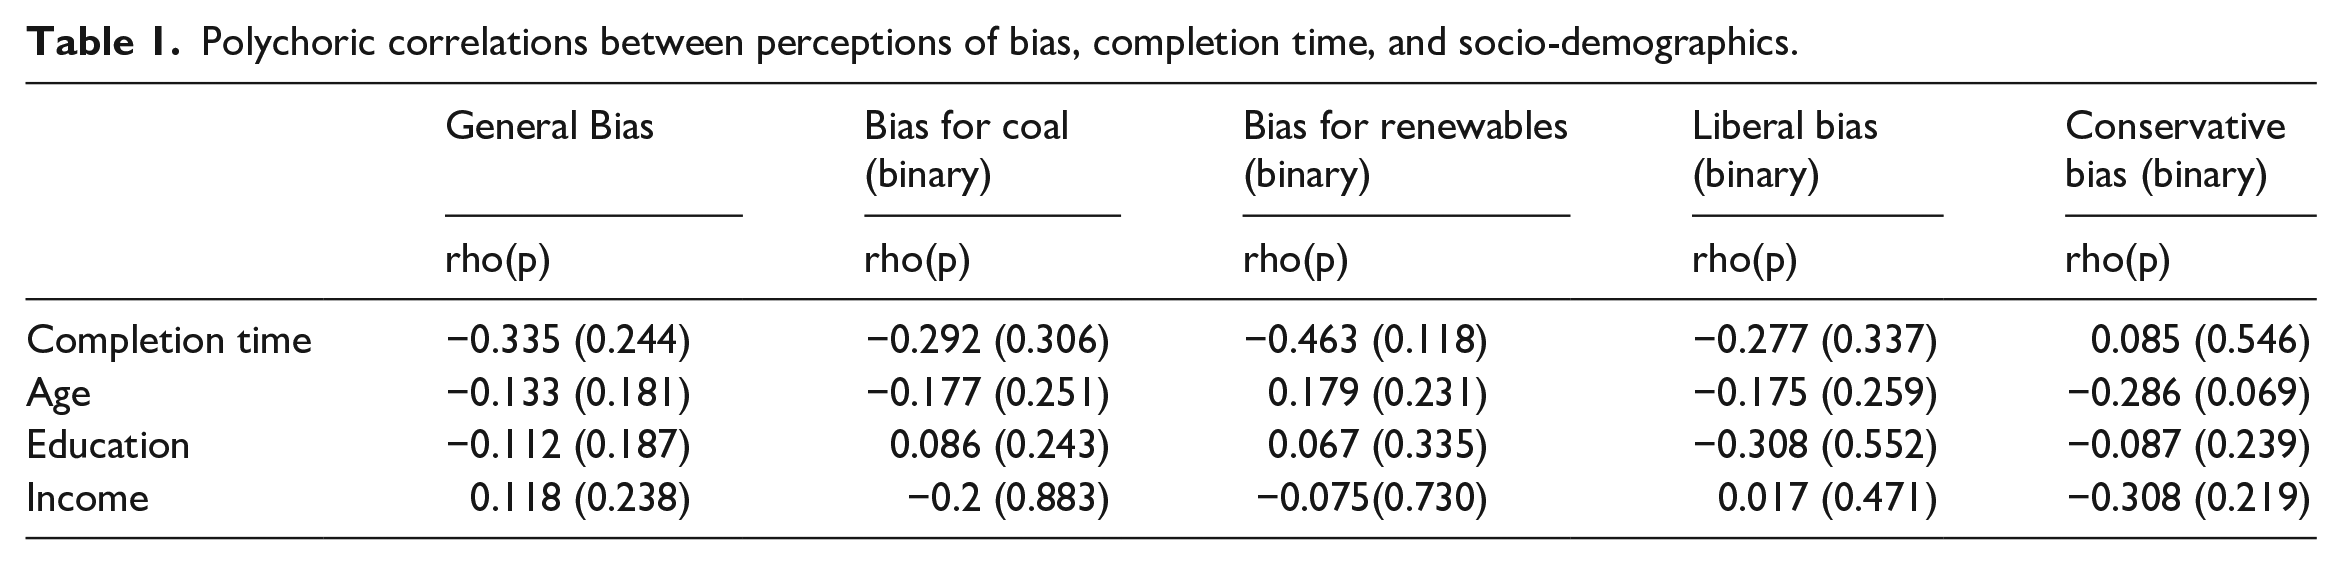
The correlations between age and perceptions of bias suggest that older respondents have a slightly lower propensity to perceive bias, except for bias in favor of renewable energy. These correlations range between −0.29 and 0.18, a magnitude that is generally considered modest. Education, on the other hand, had very weak correlations with all perceptions of bias save for liberal bias, wherein education was negatively correlated at −0.308. Income has similar weak correlations save for perceptions of conservative bias, wherein higher income individuals were less apt to state that the survey had a conservative political bias.
Multinomial and binary logistic regression models
Table 2 provides a series of regression models wherein we model the effect of our varied question wording. Recall that, based upon our prior research on perceptions of bias, we suggested that disclaimers about funding or the partisan bent of the survey, or some combination of both, might reduce the perception that the survey was biased. However, our models suggest that this is likely not the case—that is, the disclaimers did not emerge as statistically significant in any of the models, for any type of bias.
Logistic regression models for the effect of introduction wording on perceptions of bias.
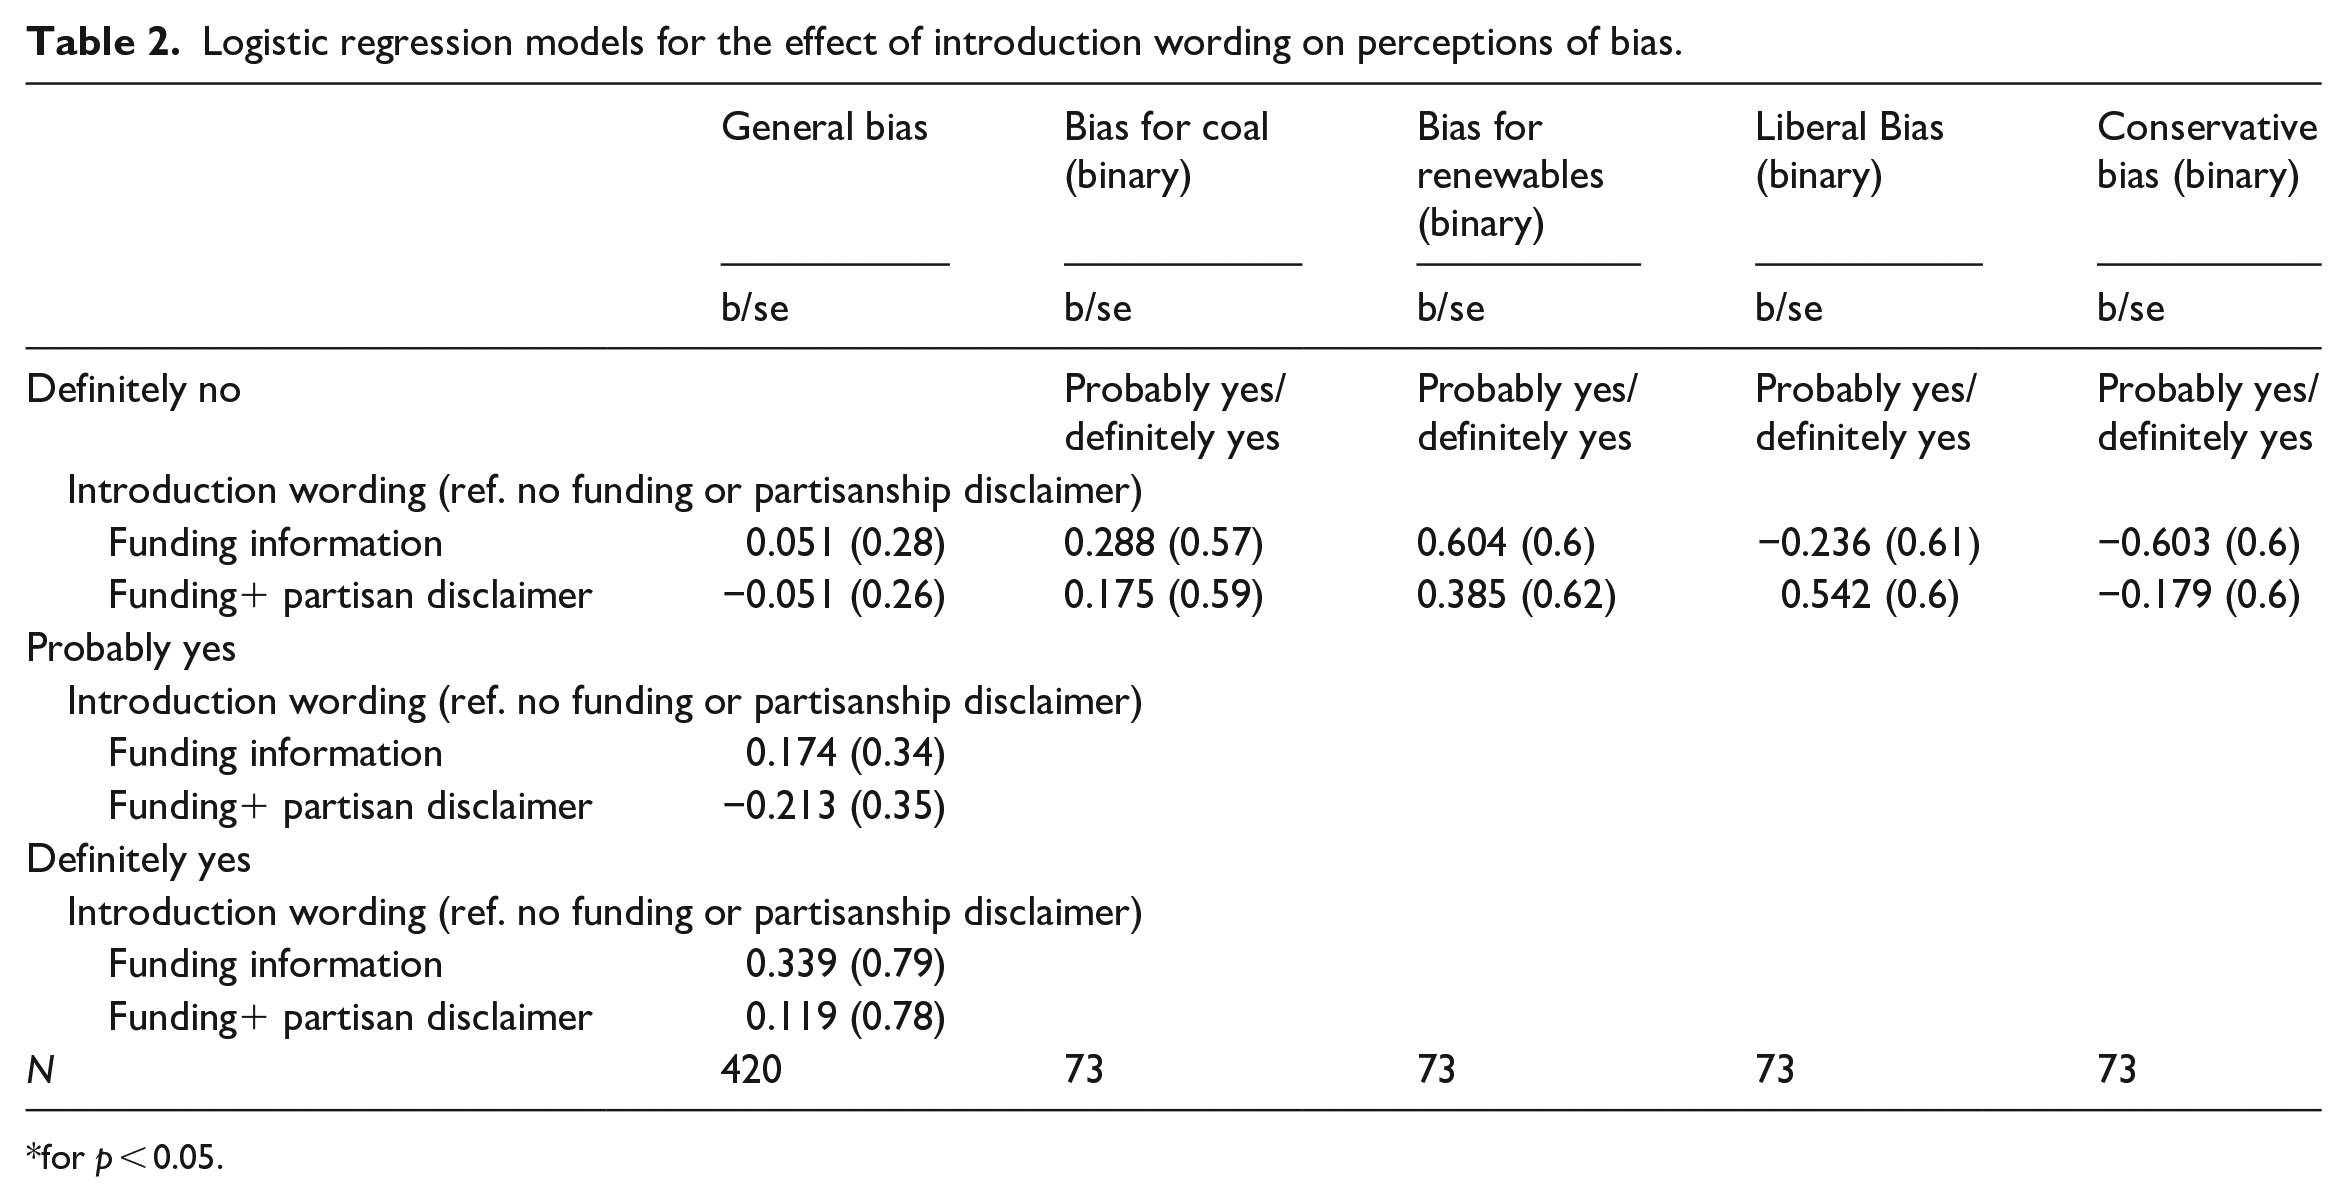
for p < 0.05.
We also suggested that political ideology may lead some individuals to perceive bias—in particular, those who identify as conservative may be more apt to state that a survey was biased. We find very modest support for this proposition, with conservatives more likely to state that the survey had a liberal bias when prompted (Table 3). Yet, conservatives more not more likely to state that the survey was simply biased, as evidenced by the null effects in the multi-nominal logistic regression model reported in the first column.
Logistic regression models for the effect of political ideology on perceptions of bias.
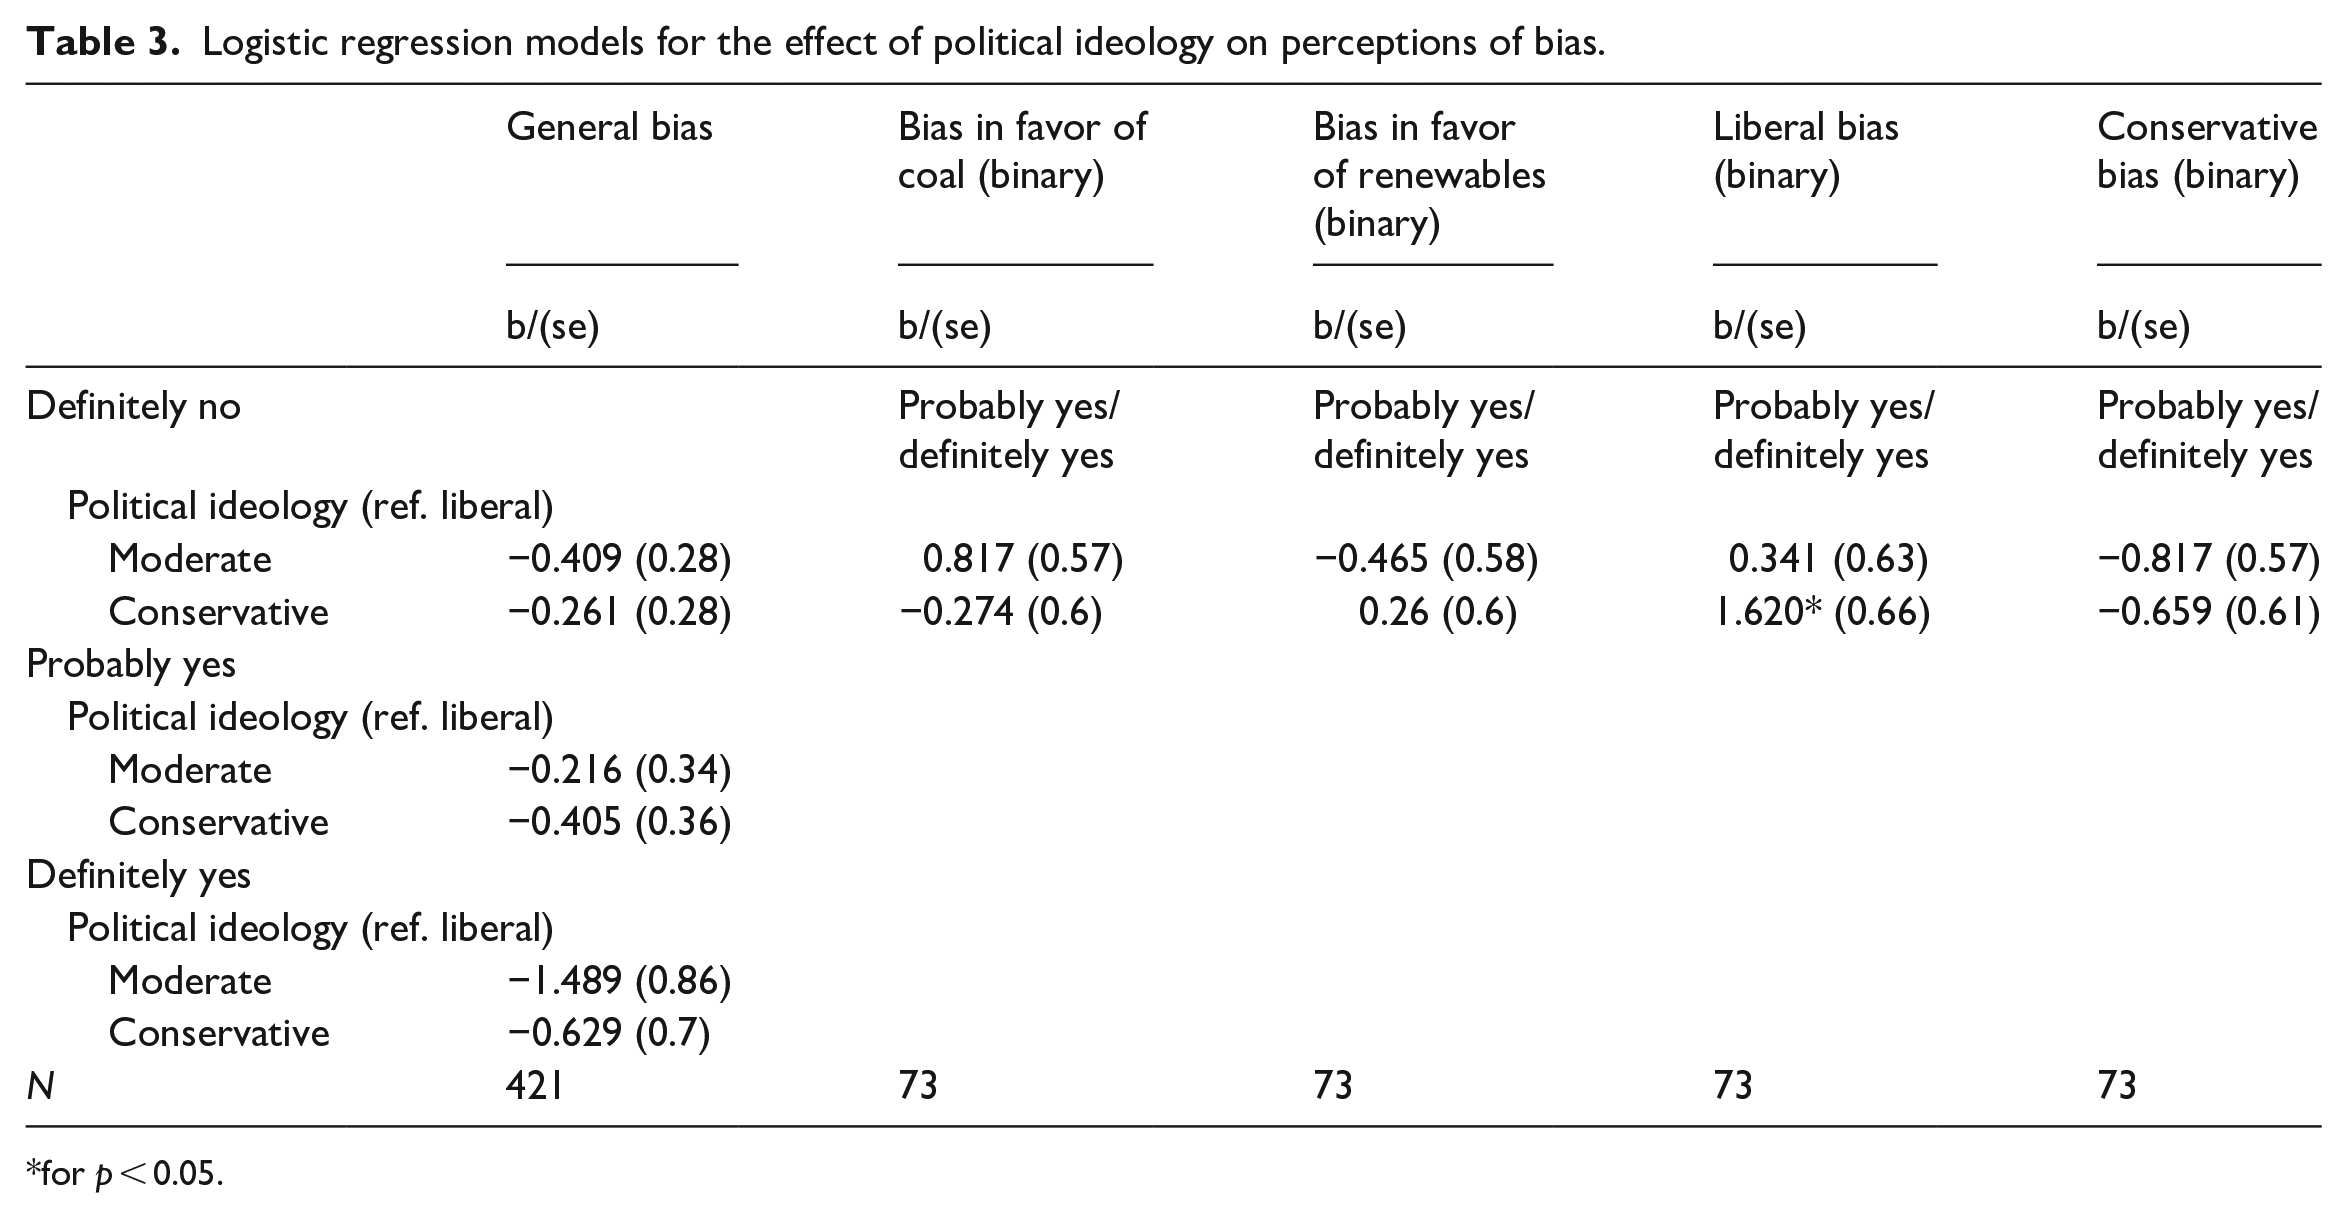
for p < 0.05.
Qualitative results
Respondents were also provided space to explain in qualitative terms via a text box why they stated that the survey was biased. Among the 73 that stated that the survey was “definitely” or “probably” biased, only 56 chose to provide an opened ended response. Among those, 14 stated “no” or “n/a” when asked if they would like to clarify why they stated the survey was biased. The remaining 42 answers provide mixed and largely inconsistent responses that does not point to a single explanation of why respondents stated that the survey was biased. Three provided answers that implied that they had recanted or grown unsure about their earlier claim of bias, with one stating that “the survey was good, it wasn’t really biased.” Five gave answers that suggested that bias is fundamental to survey research, implying that perhaps all research has some hidden agenda (e.g. “all surveys are biased”). Two indicated that the survey had a “leftist” or “liberal” bias, with one of these specifically mentioning the geographic nature of political polarization in Colorado, wherein the densely populated front range region of the state skews more Democratic compared to the more rural western areas of the state. Finally, seven suggested that the survey was biased in favor of the coal industry, with one even stating that “whoever wrote this survey must be related to a miner.”
Discussion and conclusion
Survey research, especially that which seeks to be representative of large populations, is becoming increasingly costly and perhaps even untenable as response rates decline and trust in science as an institution may be waning. Against a cultural backdrop of widespread conspiracy theorizing and distrust, we argued that a significant challenge facing survey researchers is the perception that surveys are biased, or perhaps designed or implemented by parties that have secret, often nefarious, agendas. Building upon our prior work, this paper sought to better understand the correlates of these perceptions and develop possible ameliorative mechanisms.
Based upon our prior work, we expected that some portion of respondents would state that the survey was biased in favor of one energy source or another or biased by an implicit liberal or conservative bent. Our descriptive analysis suggests that these views do indeed persist. We suspected that careful wording in the introduction that explained that the survey was non-partisan and not funded by industry or environmental groups could reduce perceptions of bias. However, our results suggest that this is not the case, that the wording of the introduction does not influence perceptions of bias.
We also suspected that political ideology would play an important role, given that a sizable literature documents a marked decline of trust in science among conservatives in the U.S. and the proliferation of conspiracies about science among conservatives, most notably about climate change. Although conservatives were more apt to claim that the survey had a liberal bias, they were not more likely than moderates or liberals to perceive other kinds of bias. This implies that perceptions of bias in surveys is not necessarily a partisan phenomenon. The fact that a minority of respondents perceived that the survey was “biased” and that, among those, relatively few perceived a strong partisan bias—in the charged partisan atmosphere of the contemporary U.S., this is a promising finding.
This analysis moves the literature on perceptions of bias forward, but several questions still remain. Mostly notably, we have tracked the attitudes of those who completed our survey, but we cannot address questions about perceptions of bias among non-responders. That is, perhaps some individuals believe that surveys or survey researchers are so fundamentally biased that they systematically non-respond to survey. Researching non-responders is fraught with difficulties but is an important task for future research. Further, researchers should consider how survey mode might influence perceptions of bias.
We found null effects of our disclosure and partisan disclaimer interventions. It is possible that additional reminders that the survey is non-partisan and not funded by vested interest groups (in our case, the fossil fuel industry, or environmental groups) might have reduced perceptions of bias. On the other hand, it is possible that some portion of respondents will hold perceptions that are obdurate against any interventions—those who attribute hidden or potentially nefarious motives to researchers may be especially resistant to change.
We also found some potentially important correlates of perceptions of bias that point to possible causes of perceptions of bias. Completion time was negatively and non-trivially correlated with many perceptions of bias—that is, respondents who took longer to complete the survey were less likely to state that it was biased. We can only speculate on why this is the case. As noted above, some respondents provided qualitative comments that indicated a belief that all surveys are inherently biased, and a small portion spoke about the ostensible liberal or “leftist” bias of research and universities in general. It is possible that some perceptions of bias occur a priori—that is, before the respondent has even taken the survey, creating a scenario where perceptions of bias are virtually inevitable. Another possibility is that those who more carefully and effectively engaged with the survey, as evidenced by their time to completion, may have found that any initial perceptions of bias waned as they navigated through the survey. On the other hand, this causal effect could run in the opposite direction, wherein those who suspect that a survey has some type of bias or hidden agenda will complete it more quickly.
There were a few negative correlations between indicators of socio-economic status—such as income and education—and perceptions of bias. This implies that individuals of a higher socio-economic status may be slightly less likely to perceive some types of bias. Our models imply that younger persons of lower income and less formal education will typically perceive more bias, although there are important exceptions, and the correlations are generally modest in magnitude. Survey research has long been the cornerstone of many of the social sciences and informs the decision-making of major institutions. We suggest that more work is needed to understand how declining trust in science, conspiratorial theorizing, and general perceptions of bias might impact survey research.
Footnotes
Declaration of conflicting interests
The author declared no potential conflicts of interest with respect to the research, authorship, and/or publication of this article.
Funding
The author disclosed receipt of the following financial support for the research, authorship, and/or publication of this article: Funding was provided by the Rural Sociological Society and Energy Institute at Colorado State University.