
Abstract
Listing images are part of a property’s “shop window” to the world, impacting performance. Recent neuroscience and psychology research suggests that when combined in an interaction, color and scene in an image may not have a significant effect except for achromatic colors, which require fewer processing resources. As a first test of the achromatic feature integration theory of attention in tourism research, we use generalized linear mixed modeling on 0.26 million properties in 30 US locations with extensive control variables. The results find significantly stronger color interaction effects on demand for different scenes only for achromatic colors (white, gray, and black). Images that emphasize achromatic colors in scenes provide the most positive effect on consumers since they minimize processing resources. The research suggests that accommodation providers should take a more analytical approach to creating and selecting listing images, considering the potential interaction effects of image features on overall visitor behavior.
Introduction
Exposure to products or services is generally viewed in marketing as a key element in increasing sales and revenues (Karrh et al., 2003). The more a consumer is exposed to a product the more likely they are to respond positively (Baker, 1999; Janiszewski et al., 2013). Notwithstanding, exposure does not equate to attention, and the limited visual processing capacity of consumers means that attention is selective, as different products and stimuli vie for consumers’ attention (Cowan, 2010; de Fockert et al., 2001). Such selective attention is important since it can influence future consumer preferences (Florack et al., 2020; Janiszewski et al., 2013). This issue is even more acute in online situations where visual imagery may be viewed only once by a consumer, and thus attention must be gained quickly amongst competing stimuli, often from a single listing image. Lindgaard et al. (2006) found that a visual impression is obtained in as little as 50 ms. Visitor choice in tourism relies heavily on mental imagery, which in turn is most strongly influenced by—sometimes exclusively—visual imagery (Lee & Gretzel, 2012). Therefore, from a tourism management perspective understanding the features of an image that gain the attention of potential visitors would seem particularly important, especially in the post-COVID world as tourism economies attempt focus on sustainability and regenerative tourism (Zaman et al., 2023). This research seeks to identify features of accommodation listing images that can facilitate stronger customer demand in a more efficient and effective way.
Attention is becoming recognized as an important aspect of tourism research in online contexts (Campos et al., 2017; B. Liu et al., 2023). The feature-integration theory of attention implies that features in an image such as color, texture, scene depiction, and so on, will be processed by individuals according to an automatic “mental screenshot” of the features of the whole image, and a further focused attention stage where more than one feature is combined into an object (Treisman & Gelade, 1980). Attention can play two principal roles for a consumer processing information from an accommodation listing image: as a filter that selects and admits stimuli from an accommodation listing image; and as a resource to facilitate information processing (including memory), restrained by the demands of particular tasks (Wickens, 2021).
Within tourism marketing, research into selective attention and color are extremely scarce. Only a few tangential papers exist, including the work of D.-Y. Kim (2010), H. Li et al. (2022), and B. Liu et al. (2023). This paper offers a unique contribution to understanding the mechanisms of attention for accommodation listing images using the feature-integration theory of attention (FITA) combined with recent neuroscience and psychology research. The research question for the study is “How does the integration of color features with scene objects affect the performance of accommodation listing images?” It provides the first test of FITA to understand the effects of color and scene on visitors and their behavior in tourism research. In sum, the achromatic feature integration theory of attention (AFITA) demonstrates that achromatic colors dominate in the perceptions of consumers for accommodation scene images. In addition, the paper offers blueprint for a new research process based on big data analytics for a quarter of a million images from across the US using neural networks and machine learning; a generalized linear mixed model that includes random variation across locations, and controls for various aspects of the image, host, property, and location of the property; and a comprehensive and best-practice set of diagnostic robustness tests for the results of model testing. The paper also contributes original practical findings that are essential for the development of effective listing images for accommodation providers and their associate online platforms. In essence, all elements of an image and their psychological interactions on potential consumers must be considered when creating, procuring, analyzing, and selecting images that lend themselves toward the most effective levers of revenue performance. This is a move beyond the current understanding prevalent in tourism image research based on individual features or feature groups.
The structure of this paper is as follows. In the next section, the theoretical foundation for the paper is examined, and the hypotheses and research model are presented. The third section details the methodology and research process for the investigation. The results of the analysis are presented in the penultimate section. Conclusions, limitations and implications for theory and practice are then provided in the final section.
Theoretical Background: A Feature Integration Theory of Attention
Attention is strongly associated with the degree of cognitive processing used for encoding information in short-term memory, and the next processing link following exposure to a message in cognitive processing (S. B. Kim et al., 2014; Leshner et al., 2011). The capacity of cognitive systems is limited, leading to selective attention, and the need for features in a message to lead individual attention (Johnston & Dark, 1986). For example, Florack et al. (2020) found distinct selective attention effects in the context of product preferences via the use of eye tracking experiments. Paivio’s (1986) dual coding theory suggests that verbal or sensory imagery can represent information, but that each will be processed and stored differently as verbal or image storage. Paivio states that pictures are superior to words with regards to coding and recall of stored memory.
Treisman and Gelade (1980) move well beyond earlier theories in the development of the feature-integration theory of attention (FITA). This model suggests that there are two key stages between in the input of stimuli and perception within the brain: the pre-attentive stage, and the focused attention stage. The pre-attentive stage acts as a “mental screenshot” of all features in an image where features are “registered early, automatically, and in parallel across the visual field” (p. 98) and “the visual scene is initially coded along a number of separable dimensions, such as color” (p. 98). In the focused attention stage, objects are identified. In this later stage, features of objects are recombined and “stimulus locations are processed serially with focal attention,” whereby “focal attention provides the “glue” which integrates the initially separable features into unitary objects” and are stored as such (Treisman & Gelade, 1980). Features may be combined to create “illusory conjunctions” whereby features of objects are combined into one based on the “blending” of features together into new objects. This can potentially be explained by a lack of attention due to the time fixated on an object and the limited processing resources of the individual (Treisman & Schmidt, 1982).
In line with the FITA, Wickens (2021) develops model that combines elements of selective attention and resource processing for a human-computer environment that is relevant to the processing of screen information from an Airbnb accommodation listing. In this model of human attention and performance the first key concept is that attention provides a “filter of selective attention that selects and admits channels of information from the environment to be processed,” while the second is that attention is a “resource to enable subsequent information processing, constrained by the individual demand of tasks” (Wickens, 2021, p. 403). A simplified version of the model is shown in Figure 1. Importantly, Wickens draws attention to visual search and the limitations of human cognitive resources to process multiple elements of information. An individual would exhibit selective attention toward various stimuli, such as images and text, and filter out elements outside their bandwidth and area of interest according to the net attractiveness of an object. Stimuli that make it through an individual’s attention filter are perceived, but further processing is subject to the availability of cognitive resources, which are limited. Notwithstanding, those elements that are processed provide the basis for action, such as clicking on a linking or booking specific accommodation.
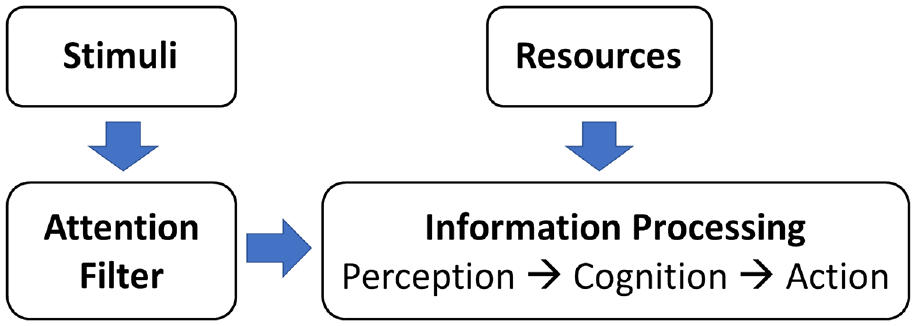
Attention and performance model (after Wickens, 2021).
Research Model and Hypotheses
In the modern business environment, many customers search for and decide on products and services via listings from web-based media. The listing image of an accommodation provider, such as Airbnb, plays a critical role in developing the mental imagery of the service being provided, and ultimately influences attitudes and behavior. In this vein, luxury hotels have invested significantly to create rooms that fulfill the esthetic values of customers and differentiate from competitors (McNeill, 2008).
Richer content in listings for accommodation, such as images, is likely to garner greater attention (Vraga et al., 2016). In the restaurant context, considering images posted by firms on social media, Simonetti and Bigne (2022) found that fixation time on product images (measured via eye-tracking) had a significant effect on visitor intention and expected liking in positive valence conditions for reviews. Mental imagery is extremely important in tourism marketing. Mental imagery processing occurs as a psychological process for potential consumers as they become exposed to tourism content from providers. S. B. Kim et al. (2014, p. 64) provide an example of mental imagery in the accommodation context: “a hotel ad can lead consumers to imagine the comfortable bed or delicious meals conjured up by descriptions contained in advertisements.” Mental imagery of a tourism product can significantly influence purchasing decisions (Walters et al., 2007).
This study involves the perception of color and scene stimuli for visitors to Airbnb listings and how cognition of these stimuli drive demand for properties. We would expect consumers to filter out scenes and colors that they are not interested in or that they do not consider attractive and then process selected colors and scenes, and their interactions, which feed into their decision to book and accommodation and pay for it. However, FITA and Wicken’s model imply that cognitive resources are limited, and so some colors, scenes, and their interactions may not be available for processing. Research suggests that the combination of different objects in visual processing results in a lack of accuracy, which is supported by discriminant-based and space-based theories of visual attention (Duncan, 1984).
Servicescape research examining color has tended to focus on hue, that is, the wavelength of light entering the eye (Roschk et al., 2017). In general, red and yellow, which occur through longer wavelengths, tend to be considered warm colors, while green and blue, indicative of shorter wavelengths, are typically considered cool colors (D. Kim et al., 2020). Color has been found to affect consumer psychology through learned and embodied meaning (Labrecque & Milne, 2012). Learned meaning links to memory and associations of colors in particular contexts, built through experiences of repeated use of color, concepts and meanings, such as red signaling a warning (Elliot et al., 2007). Embodied meaning is inherent in physiology and biological human development in that certain colors invoke specific reactions. For example, blue tends to have a calming effect, whilst red leads to greater arousal (Roschk et al., 2017). Different colors have different embodied and learned meanings and will differ in their effects on consumer psychology and subsequently behavior (C. E. Yu et al., 2020).
Attention focused on particular image features in a search task has an effect on performance (Bacon & Egeth, 1997). Search time increases for the number of items on display but is improved when search is limited to items that possess a single feature, such as the color blue (Bacon & Egeth, 1997). It is easier for consumers to focus on a particular color (feature) in an image. Taken with the learned and embodied meaning of colors, we would expect that the proportion of at least some colors in a listing image would have a positive relationship with consumer demand, such as the color blue, which has been found to have a positive effect on consumers regardless of cultural background (J. Yu & Egger, 2021).
Research has found that tourism consumers appear to prefer particular types of scenes in online media. For example, H. Kim and Stepchenkova (2015) discovered a number of scenes in images related to heritage that influenced the desire and behavioral intentions of tourists to visit Russia, including nature, architecture, and landscape scenes. Furthermore, Mata et al. (2018) found that in Norway, user-generated content from tourists tends to exhibit a greater degree of natural landscapes and culture. W.Y. Liu et al. (2023) examined the changes in color of a forest national part in Taiwan via attention theory. They found that landscape scene preference and willingness to stay differed according to the forest landscape, and that landscape preference was positively associated with the expected length of stay.
Overall, we would expect that customers have a preference for some colors and scenes in listing images, and for these colors and scenes to have a positive relationship with purchasing. We do not expect all colors to have a relationship with demand, but at least one color to be influential in driving demand, especially given the strong support for the color blue in influencing intentions in the literature. We would also expect color to have a non-linear relationship with customer demand: an image without only a little blue may not attractive, with some blue may be attractive, but fully occupied with blue may not attractive again. To capture this non-linear relationship, we use a quadratic curve in our research models. In the model we will compare the performance of different scenes in their relationship with demand against the referent. Post-hoc tests are also used to examine the direct effect of scene on demand. In terms of the direct effect of color, we hypothesize that:
H1. Color has a significant relationship with customer demand for listing images.
H2. Scenes in listing images will have significantly different relationships with customer demand.
Neuroscience research has found that achromatic images are actually seen by the brain in color. Such color tends to be built in the brain through associations and memory (Hansen et al., 2006; Olkkonen et al., 2008). Studies of image processing in the brain using fMRI (functional magnetic resonance imaging) have proven the relationship between midlevel visual regions and the primary visual cortex, referred to as predictive coding (Bannert & Bartels, 2013). Separate research has found that the light-sensitive cones of the retina are predominantly linked with achromatic sensations, while those associated with color are small in number (Sabesan et al., 2016). Generally, the nervous system “encodes high-resolution achromatic information and lower-resolution color signals in separate pathways that emerge as early as the first synapse” (Sabesan et al., 2016), which suggests that achromatic image processing has a dominant role over color image processing in the brain.
In the context of a study of advertisements for luxury brands (clothing and bags), Wang et al. (2022) conducted three experiments and found significant effects for achromatic colors (black-and-white) as opposed to chromatic colors on the perceived luxuriousness of the products and evaluations of luxury brand advertisements. Wang et al. (2022) even find that achromatic images are more effective than iconic (as well as non-iconic) colors for well-known luxury brands. More generally, much of tourism research has focused on chromatic colors but has ignored interactions between achromatic colors and scene (e.g., J. Yu & Egger, 2021).
D.-Y. Kim (2010) examines the role of color in visual attention and working memory (after a color stimulus is no longer present) through a computer-based experiment using images of tourist attractions. Strikingly, and consistent with earlier research by Gorn et al. (1997), Kim finds that color has no effect on visual attention. However, full color is found to have a significant effect on working memory. In the context of customer demand for accommodation, working memory will play a significant role in the choices and ultimately purchases that the customer makes on an online platform.
The scene in an image should be more important than the colors. The colors themselves are features of the scene that are assembled into the object that we call a scene. Meaningful wholes are more important than parts in Gestalt psychology. As Treisman (1986) put it: “If you were magically deposited in an unknown city, your first impression would be of recognizable objects organized coherently in a meaningful framework. You would see buildings, people, cars, and trees. You would not be aware of detecting colors, edges, movements and distances, and of assembling them into multidimensional wholes for which you could retrieve identities and labels from memory” (p. 114B). Frey et al. (2008) find that individuals differ in their fixation locations for images according to whether the image has chromatic or achromatic colors. Furthermore, Frey et al. (2008) demonstrate that the effect of the color in an image on attention differs according to the scene that is being viewed.
Neuroscience research has shown that the brain has a natural tendency to process images in black and white, so if cognitive resources are limited, we would expect individuals to process color and scene interactions (which consume considerable cognitive resources) only in achromatic colors (gray, black, and white). This is supported by FITA and the differentiation between pre-attentive stage (colors as features) and the focused attention stage (scene as an object integrating color features). Based on the foregoing, it is hypothesized that:
H3. Achromatic colors in listing images will have significantly higher relationships with customer demand for room types.
H4. Chromatic colors in listing images will not have significantly higher relationships with customer demand for room types.
We refer to this systematic bias in attention toward achromatic colors in feature integration as the achromatic feature integration theory of attention (AFITA). This will be measured in the research by analyzing the significance of the difference of the relationship between the color and customer demand for the referent and the focal scene. The research model for the study is shown in Figure 2. Customer demand in this research is measured using the proxy variable, annual property revenue (see methodology). A considerable number of control variables are included in the model, for the host, the property, the image, and the location of the property. The mathematical model and its variables are described in more detail in the next section.
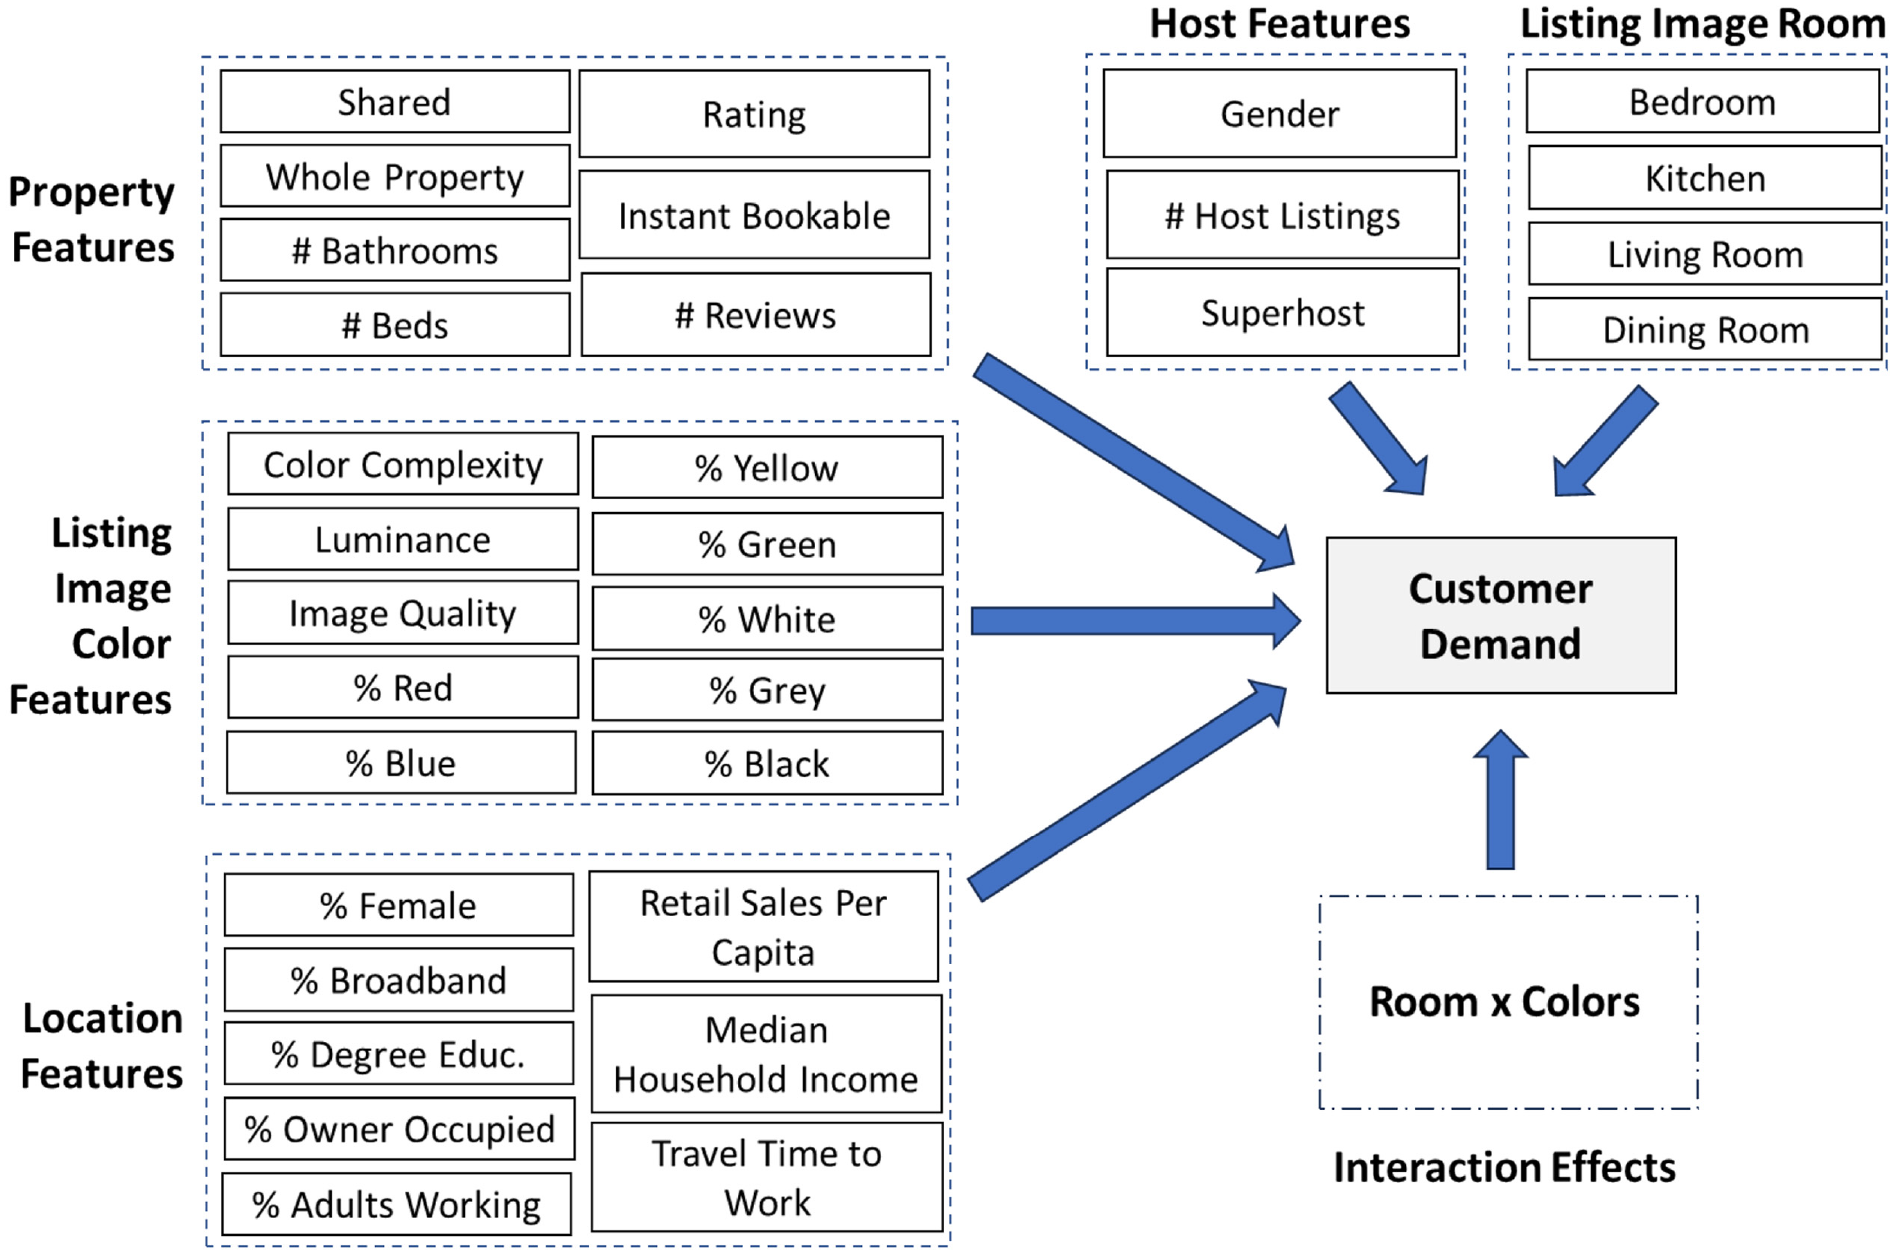
Research model.
Methodology and Research Process
The research process followed is depicted in Figure 3. This begins with selecting the sample of listings for the investigation, followed by assessing the scene of the listing image, calculating and extracting color metrics, downloading data for additional control variables, preparing and merging data sets, data preparation, testing each research model, diagnostic tests for model robustness, and ultimate testing of the research hypotheses. Each step is now examined in more detail.
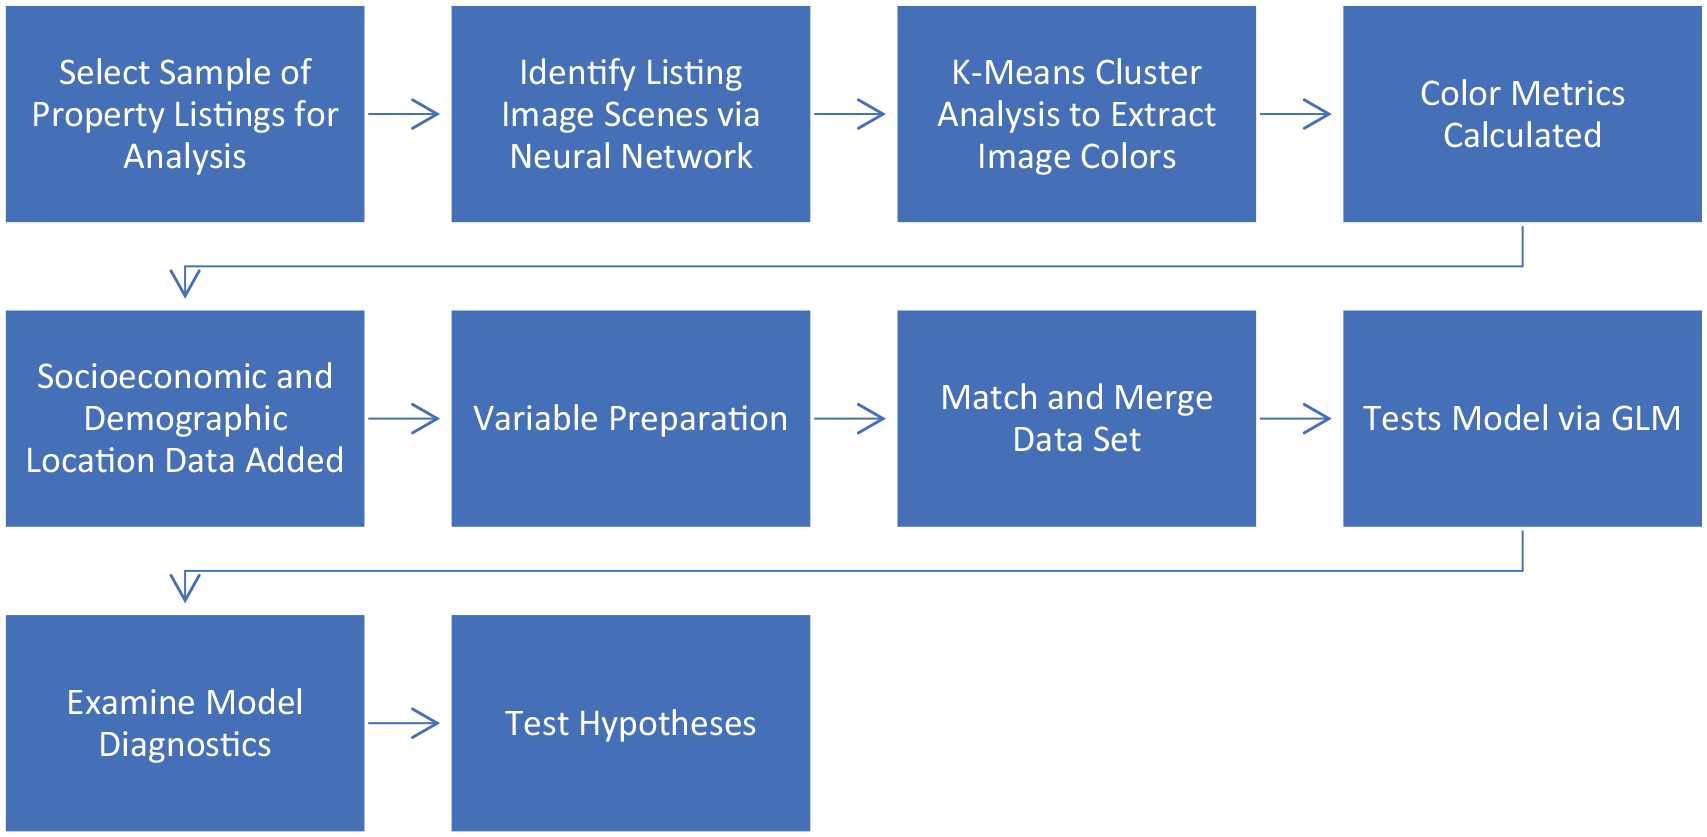
Summary of research process.
Sample Selection
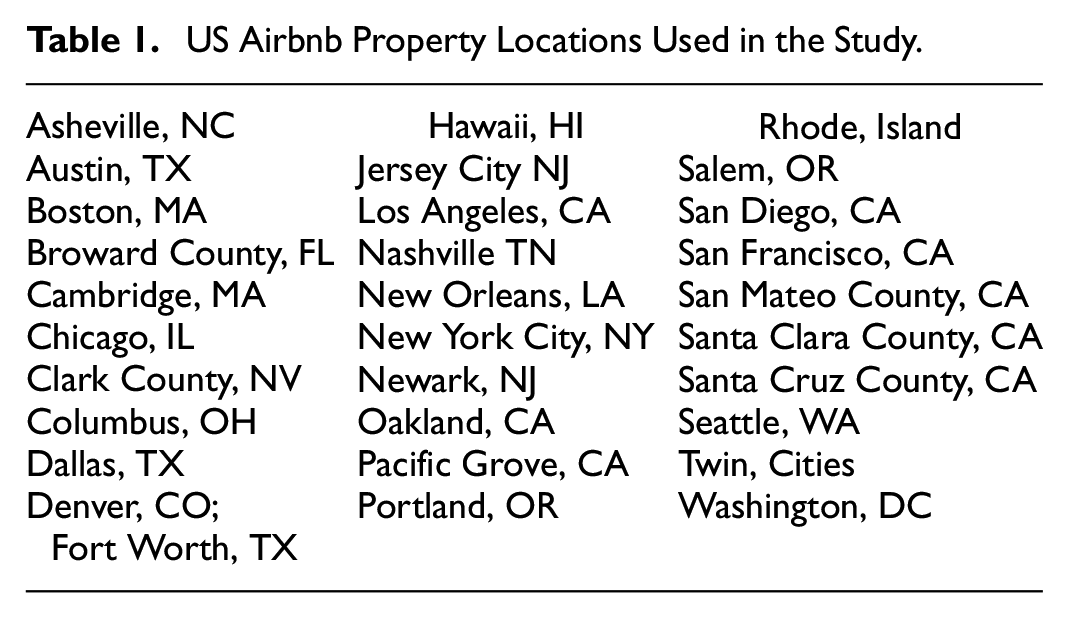
The study examined the listings of all Airbnb properties made available across 30 locations in the United States. The investigation used publicly available data; the data included all locations made available by insideairbnb.com and was downloaded in March 2023. The sample locations are shown in Table 1. A total of 256,249 listing images were available for download.
US Airbnb Property Locations Used in the Study.
Scene Identification
Scenes were identified in listing images using a pretrained Places205-VGGNet-16 convolutional neural network in MATLAB. VGGNets are convolutional neural networks invented by Simonyan and Zisserman (2015) of the Visual Geometry Group (VGG) at the University of Oxford. Wang et al. (2015) established that the 16-layer VGGNet has the highest accuracy (88.5% for top 5) against alternatives when using the Places205 data set of 205 outdoor and indoor scenes (Zhou et al., 2014) and a high transfer performance (81.2%) when applied to the MIT67 indoor scene data set (Quattoni & Torralba, 2009). The neural network was trained over 40,000 iterations utilizing mini-batch gradient descent, 0.9 momentum, 0.01 learning rate, 256 batch size, regularization of the weight decay, ratio 0.5 and drop-out for the first two fully connected layers, randomized crop/resize to 224/224 pixels (Wang et al., 2015). A total of 256,236 scene IDs could be processed.
To ensure a sizeable sample for analysis across multiple US locations, the study focused on the four most common room types: Living Room (including Parlor), 77,706 images, 29.3%; Bedroom (including those that look like a Hotel Room), 61,817 images, 23.6%; Kitchen (including Kitchenette), 14,738 images, 5.7%; and Dining Room (including Dinette), 8,615 images, 3.3%. These four rooms covered 61.9% of all images. Each room of these types was well represented across the 30 locations. Other room types had 1% frequency or less in the total sample, with patchy representation across some locations. Other room types represented the referent scene type in the analysis.
Color Assessment and Measurement
For the purposes of this study, we focus only on monochrome plus four colors. These are the main colors in the CIELAB color space—green, red, yellow, blue—plus white, black, and gray. Technically, black and white are not colors, but for the purposes of this study we will refer to black, white, and gray as the set of monochrome colors. The CIELAB color space is shown in Figure 4. CIELAB is a device-independent color space developed by the Commission Internationale de L’Éclairage (International Commission on Illumination) in 1976. It has 75% agreement with human vision. CIELAB (or L*a*b*) defines color via perceived lightness (L*) and four unique colors in two opponent pairs—red/green (a-axis) and yellow/blue (b-axis). CIELAB was further developed in 1994 and 2000 and managed to achieve greater than 95% agreement with the human eye in its color space. It has been used in other studies to examine product or service features and consumer behavior (e.g., Deng et al., 2010; Ou & Luo, 2006; Wei et al., 2014). In this study we use the most recent CIELAB 2000 measure.
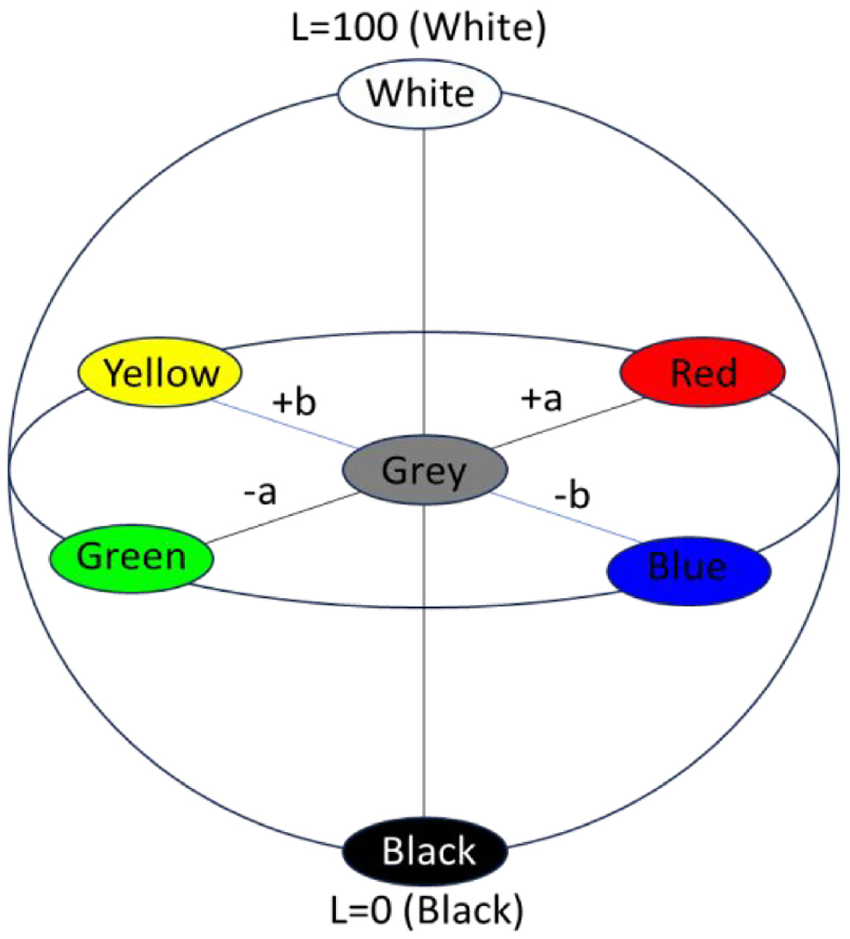
Basic CIELAB colors.
As a first step to k-means cluster analysis, the number of colors to extract from each image should be established. Silhouette analysis has been applied in other studies of image colors in tourism research, specifically Airbnb listing images (Barnes, 2022). Barnes (2022) found that 10 colors was more than ample to capture the majority of an image, whereby “99.99% of all color cluster could be captured using k = 9,” with an extra safeguard of k = 10 ultimately used. For this reason, k = 10 is used for cluster analysis in this study. A total of 10 core colors were extracted from every listing image via k-means cluster analysis. This procedure determines 10 color clusters minimizing the aggregate of distances between pixels in the color space. Cluster centers are then determined. Colors were extracted via the colorspace software package.
To find the main color type, a process of mapping was followed. Each of the 10 colors extracted from the RGB color space was mapped to one of 657 R color classes via Euclidean distance, and then to one of 12 main colors (white, black, gray, red, green, blue, and yellow for this study, plus orange, pink, cyan, brown, and purple) using Rapid Tables (2021) color mappings. Finally, the percentage of white, black, gray, red, green, blue, and yellow in each listing image was calculated.
Several other image metrics were calculated as control variables. This included color complexity, based on the sum of the weighted perceptual color distance between each pair of the 10 colors extracted from an image, wΔE*00. The
Socio-Economic and Demographic Data on Locations
To control for variation across the 30 locations examined in the study, a number of socio-economic and demographic indicators were introduced. All of the data is freely available and was downloaded from the United States Census Bureau (https://www.census.gov/). The data measured included the percentage of female population in a location, the percentage of the population with a Batchelor’s degree or higher, the percentage of households with broadband Internet connections, the percentage of properties that are owner occupied, the percentage of adults in the workforce (aged 16 or older), the amount of retail sales per capita (US$) in a location, median household income (US$), and mean travel time to work (in minutes). These measures controlled for elements of the population, economic indicators, the population’s propensity to use the Internet and to rent out a property, a location’s transport infrastructure, and so on.
Data Preparation, Merging and Matching
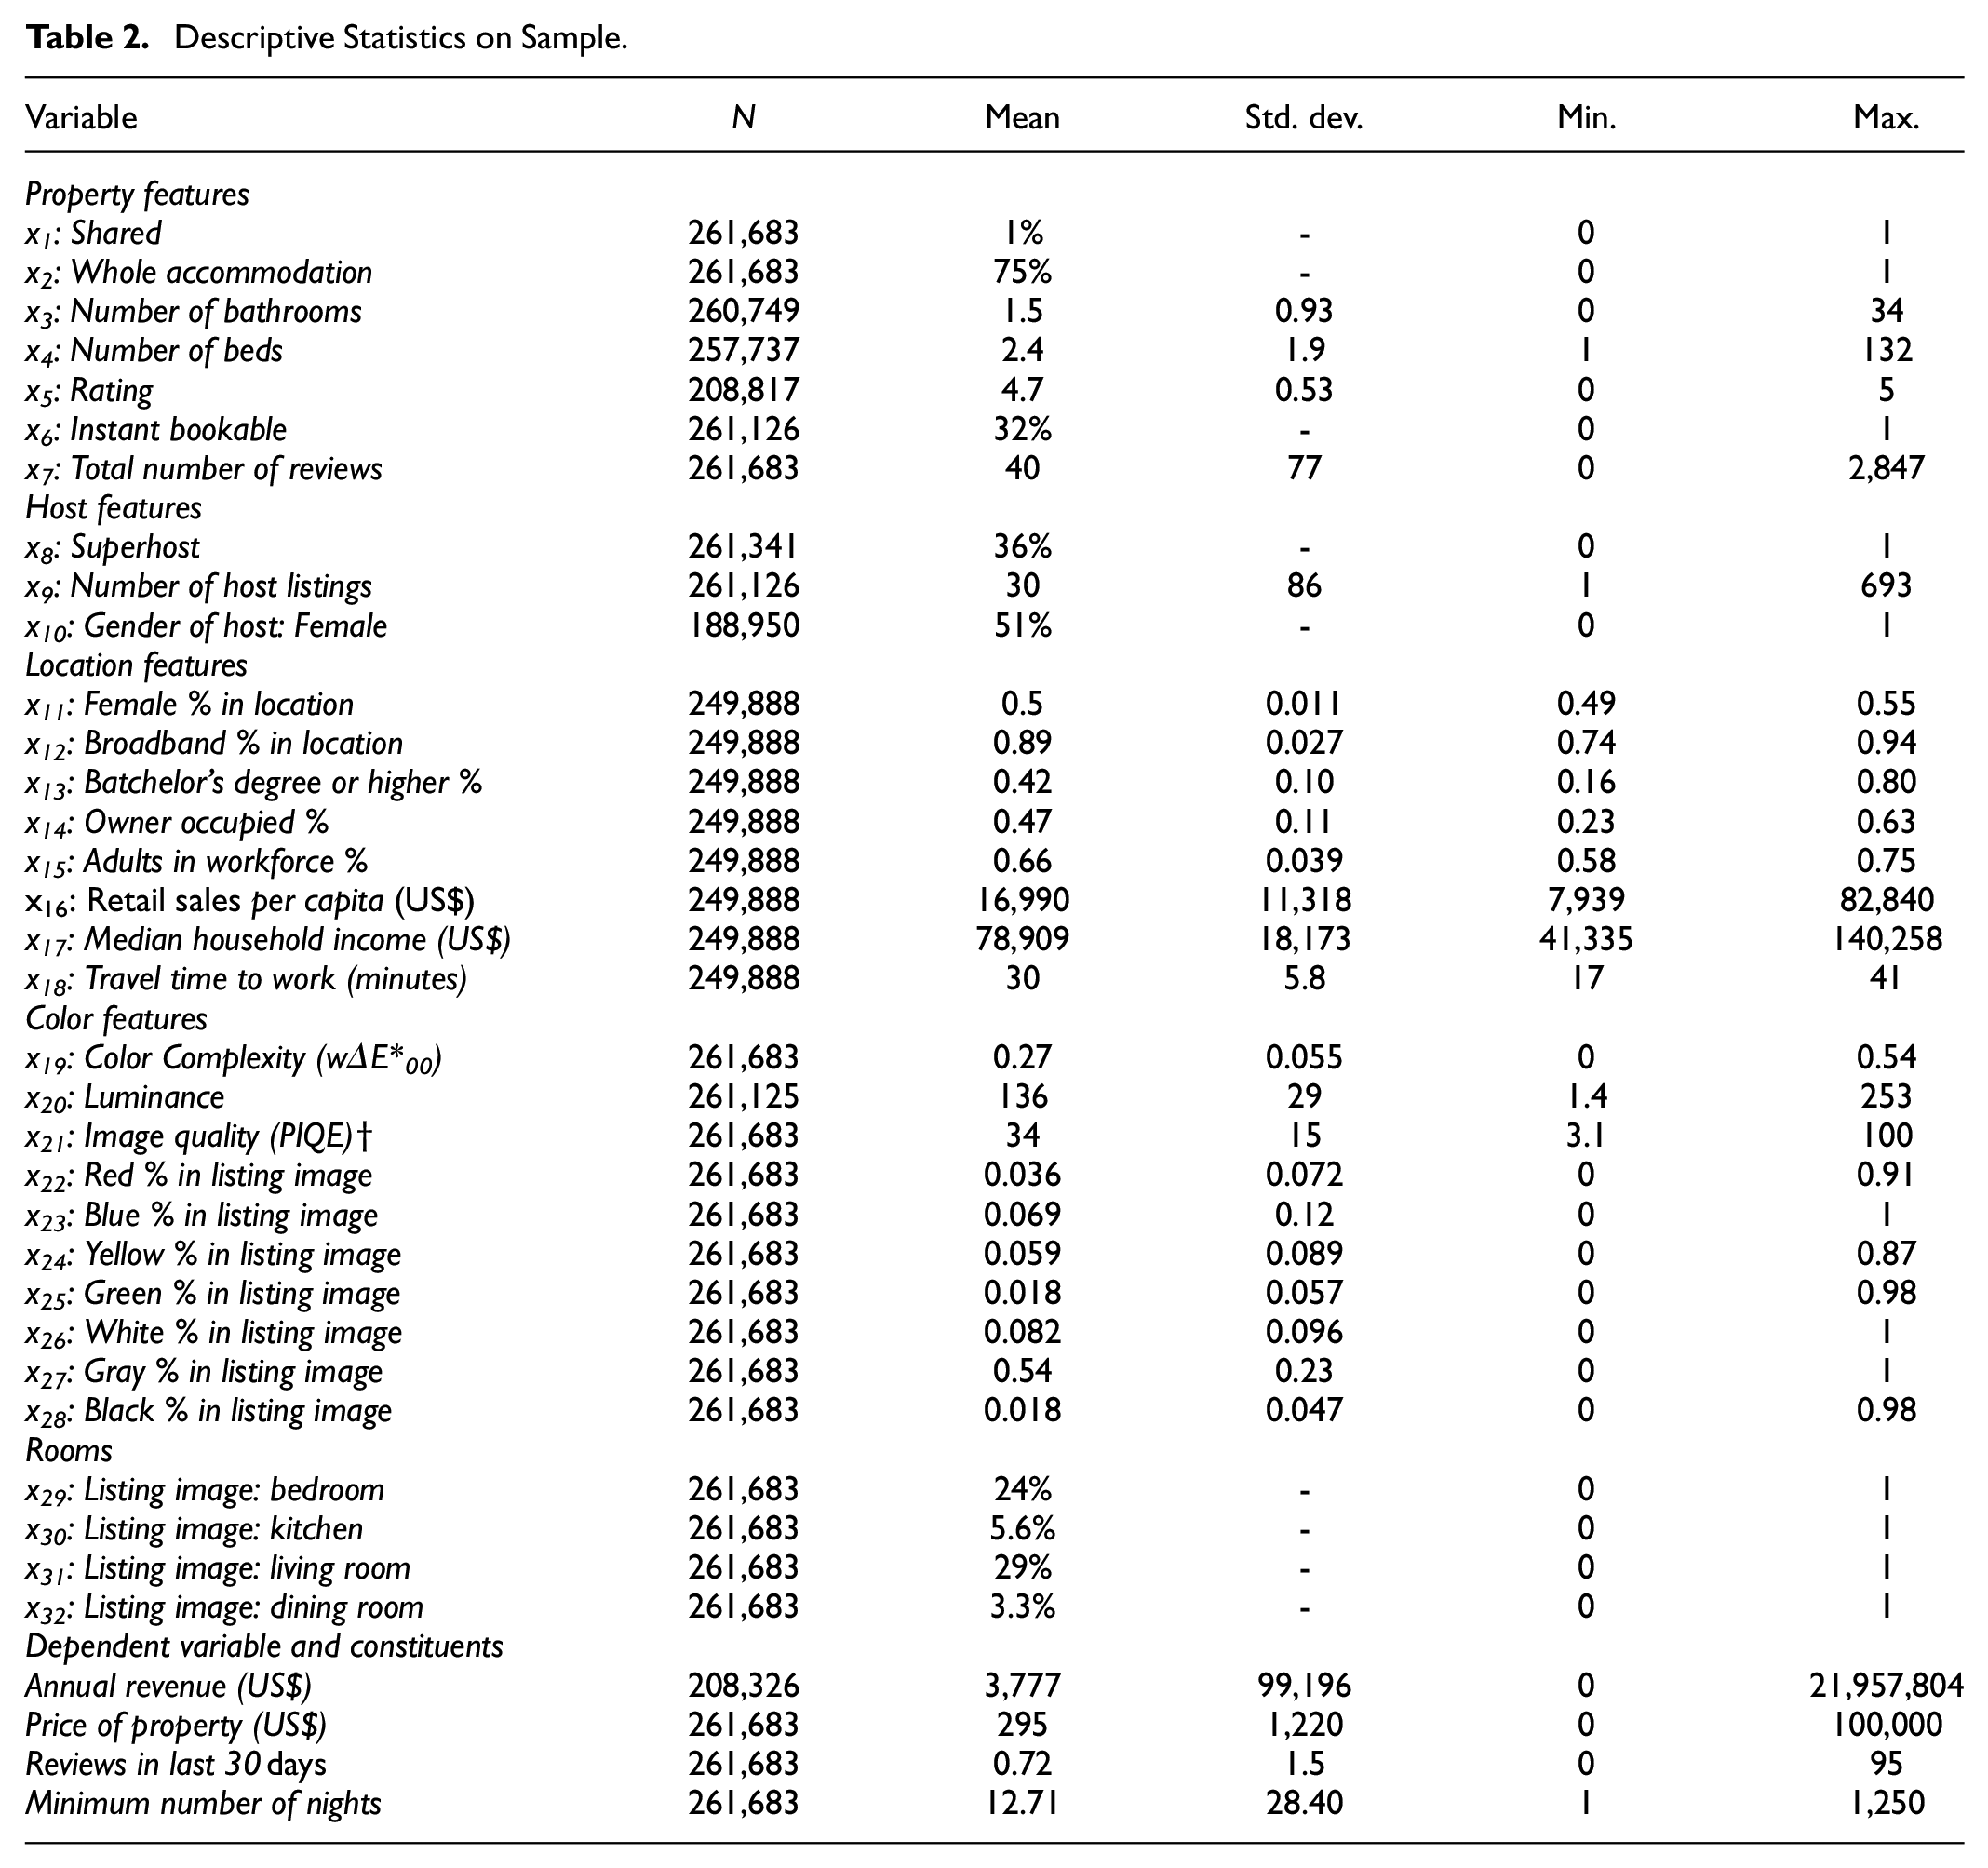
The data on listing image scenes was matched with the data on color features and location features using the ID of each image as a key. Other elements of a listing were also included as control variables, including whether a property was shared, whether the whole accommodation is offered for rental, whether it is instant bookable, the number of beds and bathrooms, overall guest rating, and the total number of reviews of a property. Regarding the host, three control variables were introduced into the analysis. These included whether the host had “Superhost” status, the number of property listings of a host, and the likely gender of the host. These elements measured the degree of customer-orientation and variation introduced via a span of control across more properties. The demographic feature of host gender was assessed using a host’s first name and the predictrace package (Kaplan, 2023). The package employs data from the United States Social Security Administration (SSA) to predict the most likely gender of a first name. Only male and female genders were assessed. Cases with more than one host name were not assessed. Descriptive statistics on the sample are provided in Table 2.
Descriptive Statistics on Sample.
Customer demand was computed via the proxy variable of revenue performance, which has been found to be strongly positively correlated with customer demand. The revenue performance,

where
The distribution of annual revenue was found to be extremely positively skewed and leptokurtic. We are modeling using Gaussian functions, thus transformation via an Ordered Quartile normalization transformation was applied, which resulted in a distribution that was approximately normal. The independent variables in the study were prepared for modeling via the usual practice of centering and scaling them to ensure that unit dependencies were not a problem.
Generalized Linear Mixed Modeling
Recent advancements in software available for mathematical modeling have enabled much more sophisticated analysis of big data. Multilevel mixed models are strong mathematical instruments that allow research to examine data sets with different unit levels of analysis (Raudenbush & Bryk, 2002). This investigation uses multi-level mixed modeling to measure both fixed and random effects and variation across different US locations. The study first tests models with blocks of variables using a “step-up” approach and linear mixed modeling (LMM). The final model is tested generalized linear mixed modeling (GLMM) using a distribution that is found to be a better fit with the data. All models are tested via the glmmTMB software package (Brooks et al., 2017). The glmmTMB package was developed in the ecological sciences and offers flexible, powerful, and relatively recent extension of LMM to include a wide array of statistical distributions that offer a better fit with the data, such as gaussian, gamma, Student’s t, and many additional distributions, with the bonus of different link functions. GLMM is powerful and able to take consideration of issues that often go unnoticed in OLS regression, such as under-/over-dispersion and zero-inflation (Bolker et al., 2009; Brooks et al., 2017).
Model Specification
Model selection in LMM and GLMM aims to find the best fit with the data using a parsimonious set of variables. This investigation uses the popular “step-up” strategy encouraged by Raudenbush and Bryk (2002) and Heck et al. (2014). First, a null, baseline model is tested with the level one fixed intercept and random effects associated with level two units. Next, individual groups of covariates are added to the model and the improvement in fit of the model is assessed. Model 0 is the null model in this study. Since only a random intercept is introduced in this model, models 1 to 6 incrementally test the effects of different blocks of covariates on revenue performance, while model 7 tests model 6 with a different error distribution. The model equations are shown in Table 3.
Models Tested in the Analysis.
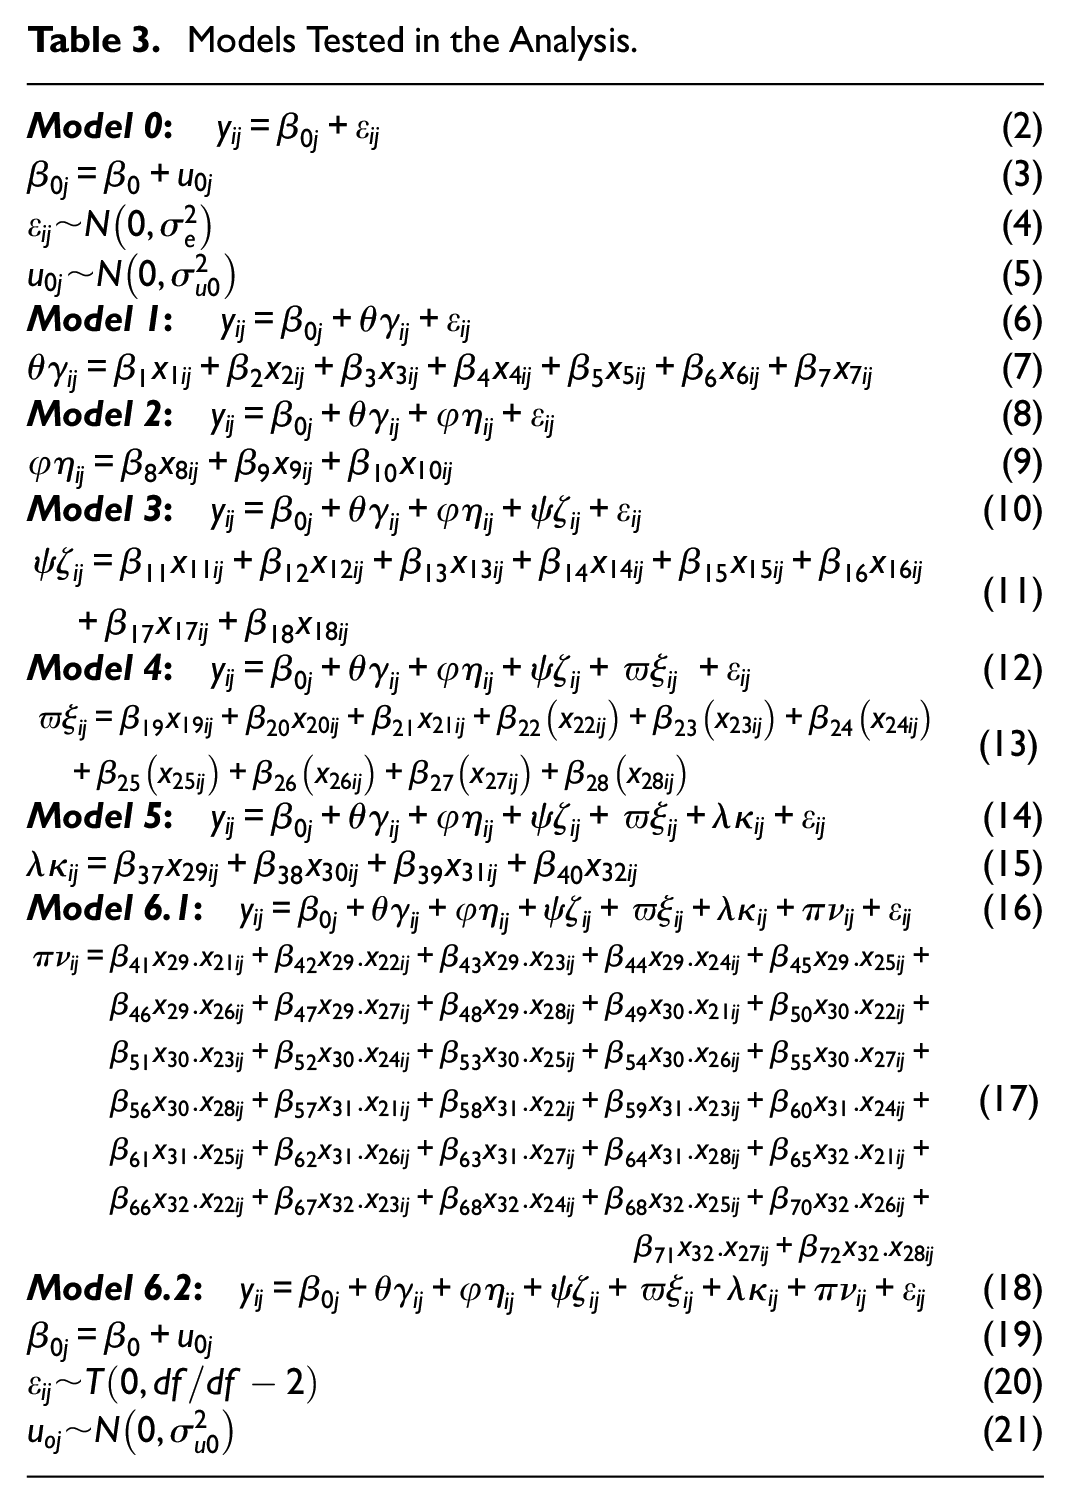
Model 0 is the null model without any fixed effects where
Model 6.1 introducing interaction effects with a block of variables
where
Results
In this section we report the results of the study, testing of the research models, and the diagnostic tests on the models to confirm robustness.
Model Testing: Null and Control Variable Models
The results of testing Models 0 to 3 are shown in Table 4. As a baseline in the step-up modeling procedure, the null Gaussian model (Model 0) without predictor variables was first tested across the 30 US locations, using Equations 2 to 5. Location is the random variable in this model. The model had an AIC = 591,046.70, AICc = 591,046.70, BIC = 591,070.24, and a Log-Likelihood = −295,516.75.
Results of Model Testing.
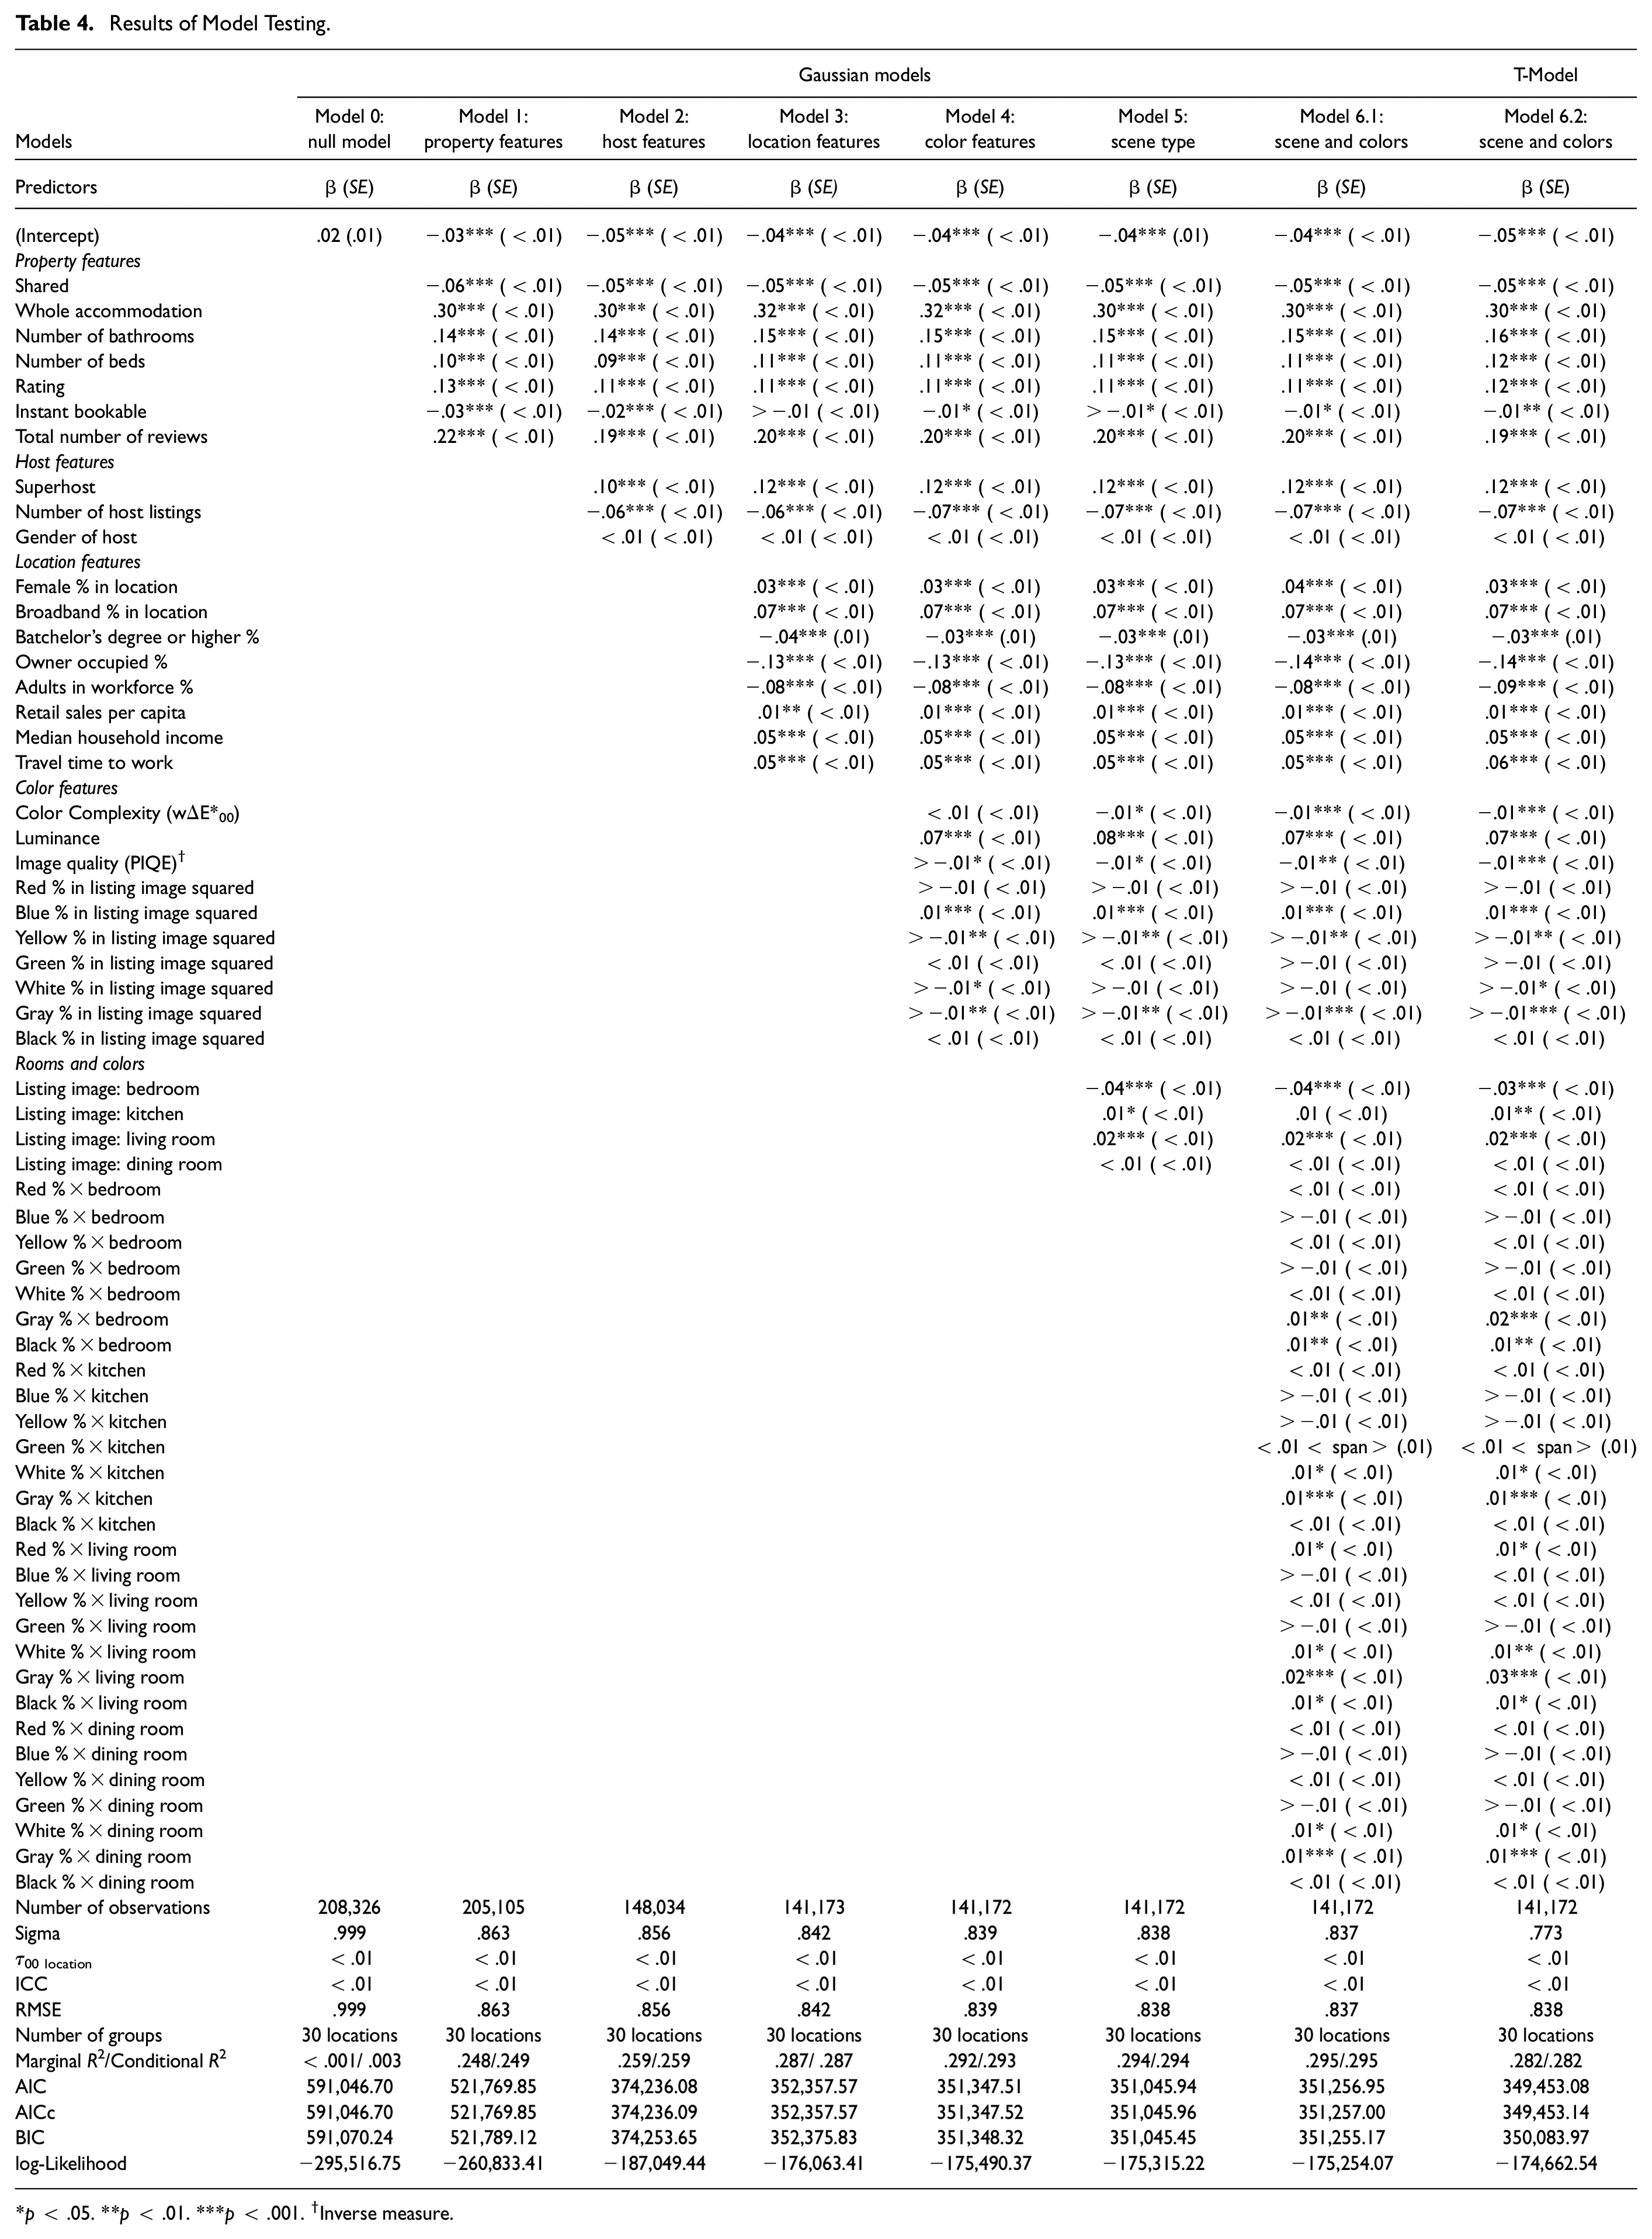
p < .05. **p < .01. ***p < .001. †Inverse measure.
Next, Models 1 to 3 were tested, each introducing a block of variables in the step-up modeling procedure. Model 1 introduced property features as control variables via Equations 6 and 7. All variables in the Gaussian model are significant at p < .001, including whether the property is shared, whether the whole accommodation is offered, the number of bathrooms, number of beds, rating, whether it is instant bookable, and the total number of reviews. The model is a stronger fit than the null model (AIC = 521,769.85; AICc = 521,769.85; BIC = 521,789.12, and LogLik = −260,833.41). Model 2 introduces a block of host features as control variables via Equations 8 and 9, tested via a Gaussian model, but only two of these were significant (Superhost status and the number of host listings, both at p < .001)—host gender was not significant. Model fit improved further in Model 2 (AIC = 374,236.08; AICc = 374,236.09; BIC = 374,253.65; LogLik = −187,049.44). Finally, Model 3 introduces a variety of location features as control variables via Equations 10 and 11. All eight of these were significant in the Gaussian model at p < .001 (female % in location, broadband % in location, Batchelor’s degree or higher %, owner occupied %, adults in workforce %, retail sales per capita %, median household income %, and travel time to work). The new model is again a much better fit with the data (AIC = 352,357.57; AICc = 352,357.57; BIC = 352,375.83; LogLik = −176,063.41).
Model Testing: Gaussian Color, Scene, and Color Interaction Models
Model 4 introduced a block of variables related to color that are aimed at testing Hypothesis 1 and providing further control variables. The variables for the percentage of color are quadratic to capture the curvilinear effect of color on customer purchasing in the model. Model 4 tests Equations 12 and 13. In terms of the color variables, the squared percentage of blue (β = .01, p < .001), yellow (β > −.01, p < .01), white (β > −.01, p < .05), and gray (β > −.01, p < .01) color in a listing image all had a significant relationship with annual accommodation revenue. Blue has a strong positive curvilinear association with behavior, and this is in line with previous literature. Yellow, white, and gray all had negative relationships with behavior. Other color associations were not significant. Overall, the diversity of colors that have a significant effect (with two chromatic and two achromatic variables) supports H1. The control variables luminance and image quality were all significant at the 0.1% and 5% levels, but color complexity was not significant. The model had a better fit with the data than Model 3 (AIC = 351,347.51; AICc = 351,347.52; BIC = 351,348.32; LogLik = −175,490.37).
Model 5 introduces direct effects of scene on annual revenue. The model tests Equations 14 and 15. The results show that images of a living room (β = .02, p < .001) or kitchen (β = .01, p < .05) had a significantly more positive effects on annual revenue than the referent images. Living rooms and kitchen images were associated with more positive behavior. However, listing images of a bedroom scene were significantly less associated with annual revenue than the referent (β = −.04, p < .001). Consumers did not want to see this room as the main listing image, favoring different scenes. Dining room listing images had a non-significant difference in their effect on annual revenue than the referent. Overall, the results support significant differences in the effect of the type of scene in a listing image on annual revenue. Post-hoc tests for main effects of the relationship between scenes and customer demand using the emmeans software package found significant main effects of living room (p < .001) and bedroom (p < .001), but not for kitchen or dining room compared to the referent. Overall, the results support H2: consumers process the different listing scene images, and this has an effect on their evaluations. Model 5 again had an improvement in fit to the data (AIC = 351,045.94; AICc = 351,045.96 BIC = 351,045.45; LogLik = −175,315.22).
Turning to Model 6.1, and testing Equations 16 and 17, we are able to discern interaction effects for scene on color and annual revenue—with some interesting results. Regarding achromatic colors, the results show that living room images have significantly more positive interaction effects for achromatic colors and annual revenue than the referent images—white (β = .01, p < .05), gray (β = .02, p < .001), and black (β = .01, p < .05). For kitchen scenes, there is a significantly more positive interaction effect for white (β = .01, p < .05) and gray (β = .01, p < .001), again deviating from the baseline, but not for black. Bedroom scenes also have a positive significantly different interaction effect for the gray (β = .01, p < .01) and black (β = .01, p < .01) in a listing image for annual revenue compared to the referent. Finally, dining room images had a positive significantly different interaction effect for the white (β = .01, p < .05) and gray (β = .01, p < .001) in a listing image and demand compared to the referent. Overall, the results offer support for gray across all four rooms, white across three rooms, and black across two rooms. This offers substantive support for H3 (75% of color/room combinations), with significant results for type of scene and either two or three achromatic colors and annual revenue. Regarding significantly different interactions for scene type and chromatic colors (red, blue, yellow, and green) with annual revenue compared to the referent, there were no significant results for kitchen, bedroom, or dining room images, supporting H4. However, for bedroom images, the was a slightly significant positive difference in interaction effect for red and annual revenue (β = .01, p < .05), compared to the referent. This offers only partial support for H4 for bedroom images. Overall, only 6.3% of chromatic color/scene combinations were supported. Model 6.1 was tested for robustness using a number of diagnostic tests. The variance inflation factor was examined across all variables for model 6.1 and was found to range between 1.00 and 4.77 (considered low) for all items except the control variable for the percent of the population with Batchelor’s degrees or above (VIF = 7.51), well within the recommended threshold of 10 for GLM models (Hair et al., 1995; Liao & Valliant, 2012). A comprehensive set of tests for the fit of the model were made using DHARMa (Hartig, 2020). These are summarized in Figure 5. The distribution of residuals from Model 6.1 were examined via a one-sample Kolmogorov-Smirnov test in DHARMa (Hartig, 2020), using simulation to compare expected and actual distributions. The results reveal that the distribution does not have a clear fit to the data (D = 0.025, p < .001). A further plot examining the relationships between standardized residuals and standard normal quartiles revealed that the distribution has a heavy tail, indicating that a different distribution may need considering for the model. A non-parametric dispersion test was applied to examine the degree of dispersion, examining the standard deviation of fitted versus simulated residuals. The ratio of observed to simulated was found to be more than 0.999 (p = .888), indicating that over-dispersion was not a concern. Further, no zero-inflation was found in the data. Notwithstanding, an outlier test of the data in DHARMa confirmed the presence of 1,525 outliers from 141,172 observations (p < .001), which is in accordance with the finding regarding the heavy tail of the distribution noted above. Finally a test for heterogeneity of variance, illustrated on the right of Figure 5 shows clear issues and a test for the location of quantiles using qgam was significant at p < .001. Model 6.1 was also a worse fit with the data than Model 5 (AIC = 351,256.95; AICc = 351,257.00; BIC = 351,255.17; LogLik = −175,254.07).
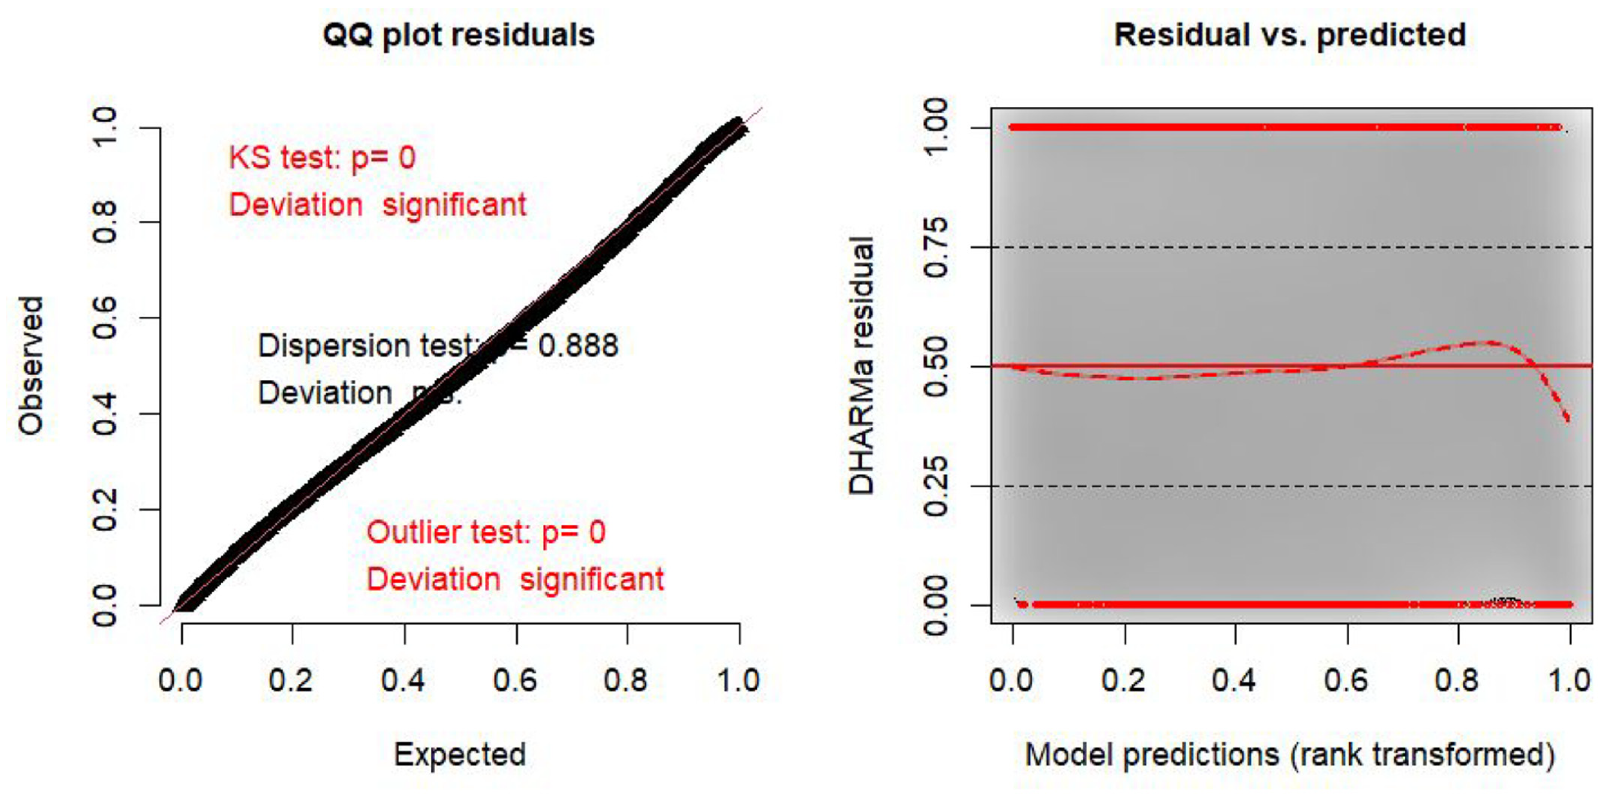
Diagnostics for Model 6.1.
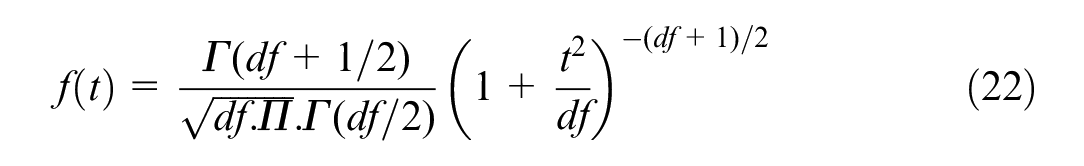
In order to confirm the robustness of the results from testing Equations 16 and 17, an error distribution was used that allows for long tails. Model 6.2 tests Equations 19 to 22 using a Student’s t-distribution rather than a Gaussian distribution. It is otherwise equivalent to Model 6.1. Model 6.2 is a stronger fit with the data than Model 6.1 (AIC = 349,453.08; AICc = 349,453.14; BIC = 350,083.97; LogLik = −174,662.54). The final model explains 28.2% of the variance in customer demand. In Table 4, the results of testing Model 6.2 are almost identical to those of testing Model 6.1. All of the results that were significant in Model 6.1 remain significant in Model 6.2, with few changes.
Only four variables in the model related to the hypotheses are different in Model 6.2. A bedroom scene in an image has the same significance but a slightly lower coefficient (β = −.04 →−0.03, p < .001), while the interaction of gray and bedroom scenes (β = .01, p < .01 → 0.02, p < .001) and white in living room scenes (β = .01, p < .05 → 0.01, p < .01) are more significant. The interaction of gray and living room scenes has a higher coefficient but the same significance (β = .02, p < .001 → 0.03, p < .001). White in an image becomes slightly significant (β = −.01, p = n.s. →−0.01, p < .05). Several control variables have a slightly different β but the same significance in Model 6.2 compared to Model 6.1 (number bathrooms, β = .15→ 0.16, p < .001; number of beds, β = .11 → 0.12, p < .001; rating, β = .11 → 0.12, p < .001; total number of reviews, β = .20 → 0.19, p < .001; percentage of females in a location, β = .04, p < .001 → 0.03, p < .001; percentage of adults in the workforce, β = −.08, p < .001 →−0.09, p < .001; and travel time to work, β = −.05, p < .001 → 0.06, p < .001).
The VIFs for Model 6.2 were similar to Model 6.1. They ranged between 1.00 and 4.76 for all but the percentage of the population with a Batchelor’s degree or above (VIF = 7.45). Thus multicollinearity was not considered a problem in the final model. Further diagnostics of the model are shown in Figure 6. The distribution of residuals from Model 6.2 were examined via a one-sample Kolmogorov-Smirnov test in DHARMa via simulation to compare expected versus actual distributions. The results show that the modeled distribution has a clear fit to the data (D = 0.002, p = .852). A non-parametric dispersion test showed that there was no over dispersion (ratio of observed to simulated = 1, p > .999) and a test for zero-inflation indicated that it was not found in the data (p > .999). An outlier test of the data in DHARMa was also non-significant (p = .316), suggesting that outliers were not a problem. Finally a test for heterogeneity of variance using qgam was non-significant (p = .773), indicating no problems with heteroskedasticity. Overall, the results of testing model 6.2 are very robust to diagnostic tests, demonstrating strong support for Model 6.2.
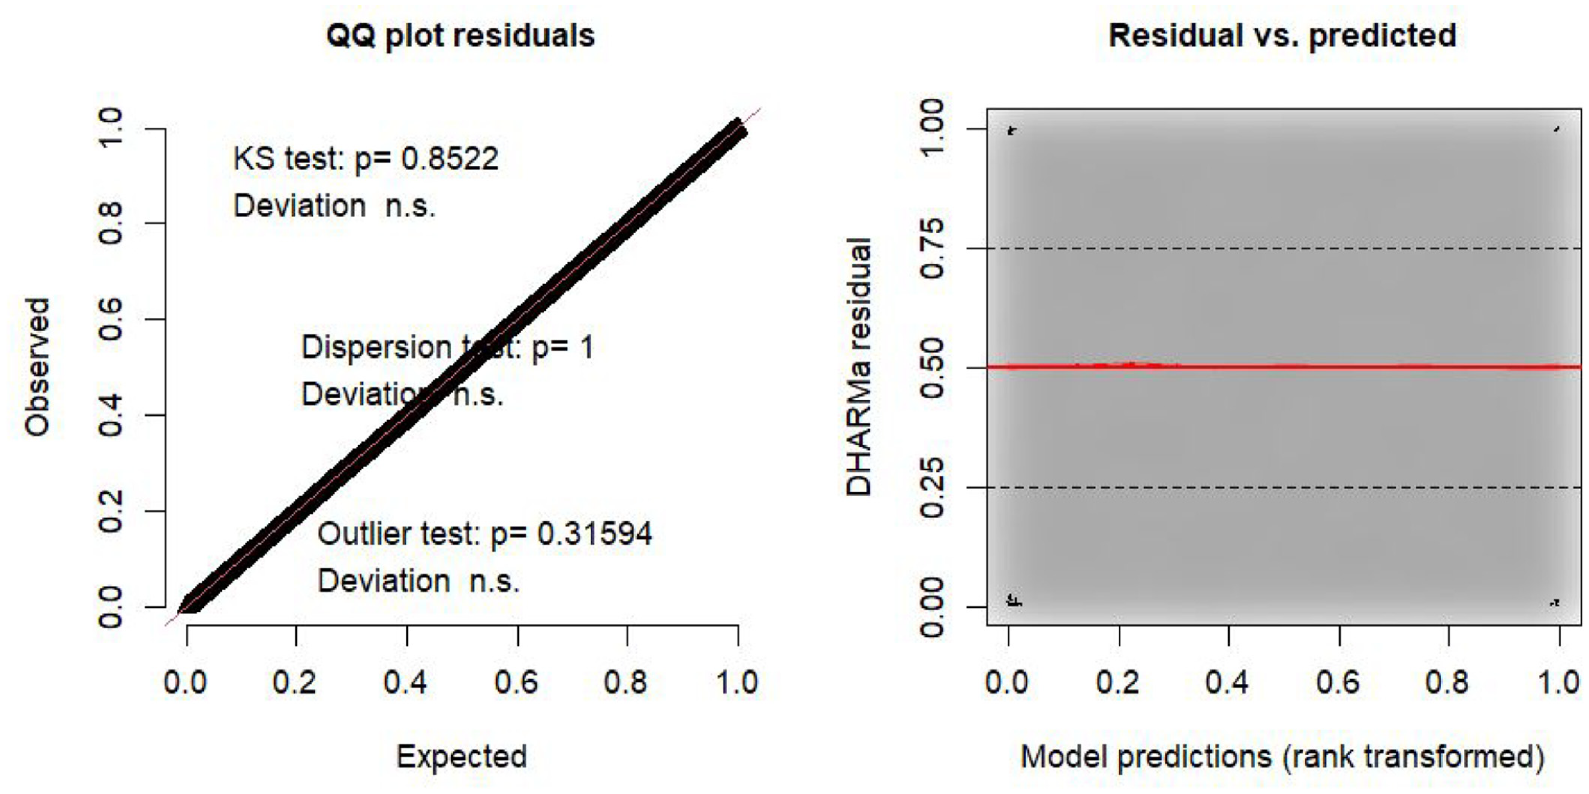
Diagnostics for Model 6.2.
Discussion and Conclusions
This paper offers a unique contribution to understanding the mechanisms of attention for accommodation listing images using an extension of the feature-integration theory of attention (FITA) to include recent research in neuroscience and psychology regarding color perceptions. It provides the first test of achromatic feature integration theory of attention (AFITA) to understand the effects of color and scene on visitors and their behavior in tourism research. In addition, the paper offers detailed blueprints for a comprehensive research process for similar image-based research. The research is built on big data analytics for a quarter of a million images from across the US using neural networks and machine learning; a generalized linear mixed model that includes random variation across locations, and comprehensive controls for various aspects of the image, host, property, and location of the property; and a comprehensive and best practice set of diagnostic robustness tests for the results of model testing.
The FITA theory and Wickens’s (2021) model enables us to understand that human visual processing for different accommodation listing images is limited by mental processing power. Separately, color has an impact on customer demand (H1 is supported; four colors have significant relationships with customer demand), and rooms have significantly different impacts on customer demand (H2 is supported; three rooms have significant results). However, when considered in interaction, the majority of achromatic colors have a significantly different relationship with customer demand from the referent for different room types (75% of achromatic color relationships tested—100% gray, 75% white and 50% black; H3 is supported for gray and partially supported for white and black), while chromatic colors in listing images do not display significantly different relationships with customer demand from the referent for different room types (H4 is 100% supported for blue, green, and yellow, and 75% for red; only one relationship, 6.3% of those tested, is significant at the 5% level for red in living rooms). This systematic bias toward achromatic colors, underpinned by recent neuroscience and psychology research, suggests that consumers will be more apt to process achromatic images of listing images on accommodation websites, and that chromatic color is an unnecessary feature in driving customer demand in the current context. The achromatic feature integration theory of attention is thus supported by the large-scale, rigorous analysis provided in this study.
The research provides an original application of FITA theory underpinned by separate and somewhat different bodies of research in neuroscience and psychology. A growing body of research has considered the effects of color in tourism, but there is scant understanding of the underlying mechanisms for human behavior. This research demonstrates that more research is needed to understand the impact of achromatic color on tourist behavior. Wang et al. (2022) finds that achromatic images are more effective than iconic (as well as non-iconic) colors for well-known luxury brands. This research shows that the impact of achromatic images on human behavior goes much deeper than just luxury brands, driven by systematic reactions underpinned neuropsychology and even the physiology of humans through an achromatic feature attention theory of attention (AFITA).
The research has distinct theoretical implications related to the role of achromatic color in visitor perceptions. The listing image of an accommodation provider, such as Airbnb or even a hotel, plays a critical role in developing the mental imagery of the service being provided by online platforms. In this vein, luxury hotels have invested significantly to create rooms that fulfill the esthetic values of customers and differentiate from competitors (McNeill, 2008). Imagery provided on the internet is important in conveying this esthetic. McNeill (2008) points out the importance of professionally taken photographs and the art esthetic of the space being offered to the consumer which may be consumed at a distance and the linkage between hotel design and interior design trends. The art esthetic argument would appear apt in the case of our research, with more achromatic listing images being more important in conveying the perception of accommodation to leverage a significant increase in visitor demand. Wang et al. (2022) found that achromatic colors in images increased the positive evaluation of luxury products more than that of chromatic colors. Further they found that the evaluations were higher for hedonic appeals compared to utilitarian appeals. Typically, we would expect visitors to Airbnb to be traveling for vacation purposes, so it is more likely that hedonic appeals would be more dominant, boosting the evaluation of achromatic colors for the accommodation listing scenes in our dataset. Achromatic images tend to be perceived as more psychologically distant than chromatic images (Stillman et al., 2020), which may suggest a psychological advantage over chromatic color, since an image on a computer screen cannot be directly felt and could be considered as transcending the individual in the present and requiring a connection with a more distant place, person, or time (Liberman & Förster, 2009; Stephan et al., 2011).
From a practical perspective, achromatic images appear to be important in online offerings of accommodation, linking particularly to hedonic appeals and to working memory for influencing purchase decisions. For accommodation providers this means that color is less important than might be expected for listing images and that they need to focus more on other features of the listing images provided to use them more effectively as a hook for customer attention. Thus, practitioners should emphasize more effective listing images, investing in the quality and esthetics of the scene provided. This guidance counsels concerted effort in improving the design and artistic elements in the images used for effective listings of accommodation to develop the most appealing scenes for tourism consumers, and to ensure that the quality of the images provided is of the requisite quality (including resolution, PIQE, focus, and so on).
Notwithstanding, the practical implications go much deeper, and point to potential interaction effects among features for images presented to tourism consumers on digital platforms such as Airbnb. Given the importance of listing images in capturing the attention of consumers in tourism settings and driving revenue generation, significant effort must be expended not only in in designing and analyzing the individual elements of the images created, procured, curated, and used in the online marketing of properties on consumer behavior and property performance, but in their combination or permutation. Feature analysis is important and has been the dominant stance in image research in tourism, including the use of particular colors or particular scenes as a driver of consumer attitudes and behavior. However, an aspect that has been hitherto neglected in image research in tourism is the importance of elements of images in interaction with each other. This study has found that there may be unexpected interactions between elements that have serious implications for listing image creation, procurement, curation, and use. The research has focused on comparing interactions between color features and scene objects, but there may be many other interactions yet to be discovered by scientific research, such as those between any combination of color, shape, object, texture, and scene.
Consequently, practitioners must consider all aspects of an image and their potential interactions in influencing tourism consumer behavior and accommodation performance. Advice for practitioners from this study includes the development of a feature inventory for each image curated for inclusion on an accommodation website—this includes colors, scenes, shapes, objects, textures, and so on. This inventory can be screened based on salient knowledge of the most successful feature interactions on performance (customer demand). Images that are black and white or that contain a significant proportion of achromatic colors should be considered for inclusion to represent the accommodation available. Gray appears to be a particularly influential color in interactions with all room scenes examined (bedroom, living room, kitchen, and dining room), although white and black are also influential in certain room settings. Living rooms and kitchens appear to have a stronger relationship with customer demand, suggesting a typically appropriate choice, while this is not the case for bedroom images in the case of Airbnb, where whole accommodation representing a range of rooms is often provided. Based on future research findings, practitioners may further screen the image feature inventory to inform listing image choice.
This study has a number of limitations. First, although the sample size is huge, it is based only on a single country, the United States, and within the target country the data on 30 locations. Future research could attempt to examine the data for other locations within the US and for other countries. Second, the data is based only on a single online accommodation sharing platform, Airbnb. It is desirable to assess whether the research can be replicated for the images available from other online accommodation providers, including accommodation websites such as Booking.com, Trivago, Tripadvisor, Expedia, HomeStay, Vrbo, HomeToGo, as well as for smaller, independent providers of accommodation. Third, the research focuses only on accommodation. The underlying theory suggests that the results should also apply for images of other types of products or services, such as restaurants or excursions. Future research should seek to extend the research into different contexts. Fourth, the research has only examined the implications of FITA theory for scene and color. The results of the study are also likely to have wider implications for other features that could be examined in the future, such different types of shapes, numbers of shapes, and so on.
Footnotes
Declaration of Conflicting Interests
The author(s) declared no potential conflicts of interest with respect to the research, authorship, and/or publication of this article.
Funding
The author(s) received no financial support for the research, authorship, and/or publication of this article.