
Abstract
Research on the ties between congestion and visitors’ experiences in a destination has primarily used subjective methods. The current study proposes that the emotional, subjective visitor response to congestion be measured alongside the objective experience, in real time and real-world conditions. To do so, advanced tracking methods in time and space (GPS) were combined with the Experience Sampling Method (ESM), which includes self-reporting and physiological monitoring of electrodermal activity (SCL). An intra-subject experiment was designed, with all participants asked to traverse an identical path in Jerusalem’s main market, Mahane Yehuda, under two different crowding conditions. The partial concordance between subjective and objective arousal highlights the methodology’s significance for increasing our understanding of a visit’s emotional dimension in urban destinations, particularly congested public spaces. Alongside the study’s limitations, the practical application of the methodology for tourist destinations and urban settings that face congestion and overcrowding is discussed, aiming to improve the quality of the visitor experience and urban well-being.
Introduction
Congestion in tourist sites is not a new phenomenon (Capocchi et al., 2020; Dodds & Butler, 2019); however, in recent years, it has been rebranded as overtourism, as more and more cities are facing its negative effects. Crowds at tourist sites, congestion in urban infrastructure, a rise in the cost of living, retail gentrification, pollution, and damage to heritage sites due to inappropriate tourist behavior are only some of the negative effects attributed to overtourism (Dodds & Butler, 2019; Nilsson, 2020).
Despite the widespread discussion about overtourism in recent years, there is no consensus regarding its definition. Peeters et al. (2018) and Wall (2020) define the phenomenon in terms of the destination, using objective terms of thresholds and capacities. This approach converses with classic models from the mid-1970s and early 1980s, which were occupied with the idea of a tourism-area life cycle (TALC; Butler, 1980) and tourism carrying capacity (TCC), ideas that are now reemerging vis-à-vis the urban setting (Wall, 2020). In contrast, UNTWO (2018) and Goodwin (2017) define the phenomenon more broadly, relating not only to the negative effects of overtourism on a destination and on the local population’s quality of life but also to its consequences for tourists and the quality of the visiting experience. This definition emphasizes the phenomenon’s subjective dimension and the way in which it is perceived.
The two approaches to defining overtourism are evident in the methods proposed for its measurement. The former approach promotes spatial geographical measures such as TIR (Tourist Intensity Ratio) and TDR (Tourist Density Ratio), quantifying overtourism and its effect on a destination (Peeters et al., 2018). The latter approach asserts that overtourism is essentially subjective and therefore the objective assessment must be supplemented by subjective measures (Uysal & Sirgy, 2019) that assess overtourism from the perspective of local populations (Kuscer & Mihalic, 2019) and/or visitors (Krajickova et al., 2022). Thus far, overtourism has primarily been measured in relation to its effects on hosting populations, relating less to visitors and their experience (Yu, & Egger, 2020). Within the research that has focused on the visitors’ perspective, the phenomenon’s effect on the nature of the experience has been measured for the most part using subjective verbal retrospective metrics of visitor satisfaction (L. Li et al., 2017). More novel research methods for assessing visiting experiences, including online questionnaires, do bridge the temporal gap, as reporting takes place at the site and in real time, but the data are still subjective (Birenboim & Shoval, 2016).
The present study, as illustrated in the conceptual model (see Figure 1), focuses on one of overtourism’s social effects and spatial expressions: overcrowding (Papadopoulou et al., 2023). The study examines the effects of crowding and congestion on the visitor’s experience and, more specifically, on emotional arousal (Park & Santos, 2017). To measure the connection between the two variables, the study employs an innovative methodology that integrates spatial, temporal, and emotional tracking. Moreover, it uses two methods to document the emotional response to crowding, one subjective and one objective. The objective method makes use of physiological sensors to record unconscious emotional responses, and the subjective method records the conscious emotional response through self-reports, using an online questionnaire that includes interpretation (Packer & Ballantyne, 2016) (see Figure 1).
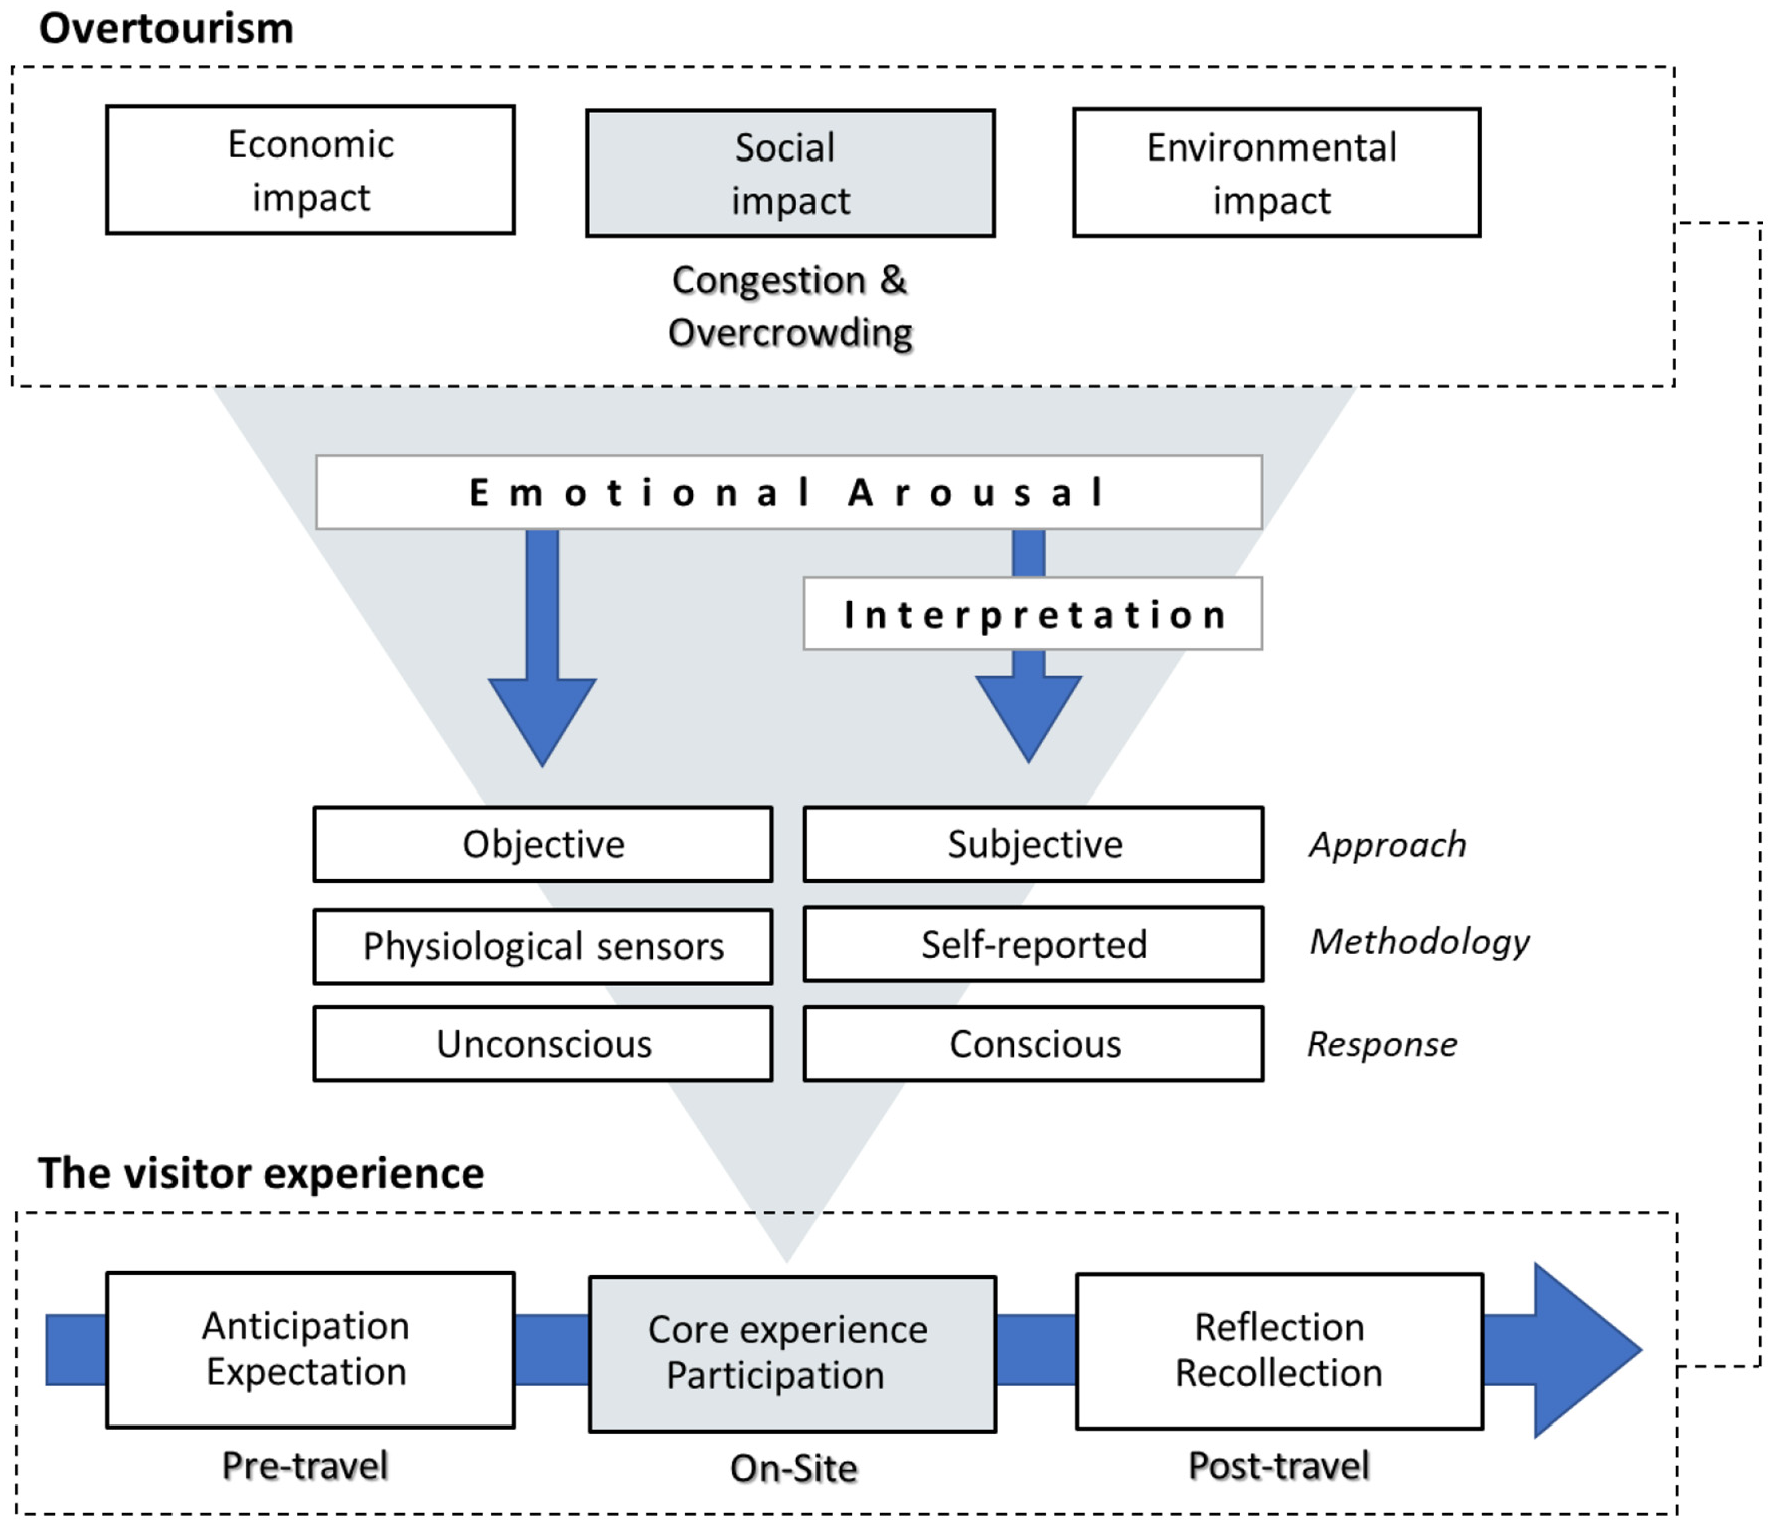
Conceptual model.
Two central research questions were formulated: (1) How do visitors respond to crowding and congestion at an urban-public consumption site, both objectively and subjectively? (2) What new information about the visiting experience can be gleaned by combining subjective and objective emotional measurement? The first question relates to crowding’s effects on the visitors’ experience and was tested through the study’s empirical results; the second relates to the relationship between the two emotional arousal sensing methods, methodologically examining their joint implementation for a deeper understanding of the visitors’ experience, particularly vis-à-vis varying crowding conditions.
On the first question, we hypothesized that the two variables—crowding and congestion (independent variable) and emotional arousal (dependent variable)—would have a positive correlation. That is to say, as the congestion at a site increases, so will the emotional arousal, and vice versa; crowding can be explained as a psychological and physiological stressor (Stokols, 1972).
Since the two methods complement one another (Uysal & Sirgy, 2019), our hypothesis regarding the second question was that applying the two together would increase our knowledge about the impact of crowding and congestion on the visitor’s emotional experience. The subjective approach reveals the arousal’s valence and garners extensive qualitative data about the stimulus in real time; the objective approach gleans reliable and more precise quantitative data regarding levels of emotional arousal in time and space (Birenboim & Shoval, 2016). This integrated methodology contributes uniquely to both knowledge and practice; it bridges the theoretical gap noted above and facilitates a better understanding of the visitor’s core experience, affording an opportunity to help improve tourist destinations’ planning and management.
Literature Review
The Visiting Experience, Crowding, and Perceived Crowding
The visiting experience is a subjective one, influenced by internal elements that include visitors’ expectations, immediate emotional responses, and post hoc interpretations as well as external elements such as activities, physical surroundings, and interactions between visitors (Packer & Ballantyne, 2016; Park & Santos, 2017). Crowding is considered an external element, which creates a spatial and social limitation during the visit to a site. Nonetheless, Stokols (1972), lending a psychological perspective to the discussion, has argued that crowding is necessarily perceived and subjective, and includes internal elements as well. Accordingly, he suggested distinguishing between density and crowding, where density refers to the physical condition and is defined as number of people in a specific area, and crowding refers to the psychological and physiological experience stimulated by density as well as its subjective assessment (Stokols, 1972; Yu & Egger, 2020). Papadopoulou et al. (2023) also noted the difference between the two aspects of crowding; they used the term social crowding to describe the physical state of crowding caused by people in a space (actual density) and the term perceived crowding to describe the subjective experience.
Visitors’ perceptions of crowding are influenced by an environment’s physical characteristics, by social dimensions such as interaction with other visitors, and by personal qualities like expectations and motivation (Neuts & Nijkamp, 2012). Despite the environmental and personal elements that may influence the experience, crowding involves stress; it is characterized by negative manifestations of tension. These may be physiological, expressed in blood pressure, body temperature, and perspiration, or psychological, manifest in cognitive or emotional imbalance (Stockdale, 1978; Stokols, 1972). In research on leisure, this negativity has usually been explained as stemming from the physical limitations crowding incurs, which make it difficult for the individual to realize his or her objectives, and from unwanted or inappropriate human interaction, manifest in high proximity and stimulation overload (Cheng et al., 2021; Kalisch, 2012; Papadopoulou et al., 2023).
Crowding, it must be noted, essentially attests to high demand for a given space; it is not necessarily negative (Papadopoulou et al., 2023). Thus, in studies, perceived crowding has also led to increased satisfaction and augmented positive feelings among retail (Jung et al., 2017), urban (Neuts & Nijkamp, 2012), and festival visitors (Cheng et al., 2021; Gedecho et al., 2023). At festivals, the connection between perceived crowding and the visitors’ experience has been described as an inverted U-shape; the positive effect of perceived crowding is limited to a certain maximal value. This finding suggests that different visiting experiences have different ideal values of perceived crowding (Cheng et al., 2021).
One common element used to measure the quality of the visiting experience has been level of satisfaction (Li et al., 2017). Despite the classic assumption that a direct connection exists between social crowding and perceived crowding, with an inverse effect on satisfaction (L. Li et al., 2017), empirical research on these links has not shown consistent results (Kalisch, 2012; L. Li et al., 2017; Kohlhardt et al., 2018; Yu & Egger, 2020). Several explanations have been offered in the literature for the variance. Methodologically, the failure to find the link may have resulted from how perceived crowding was defined and measured (Cheng et al., 2021; Neuts & Nijkamp, 2012; Pons et al., 2014; Yu & Egger, 2020) as well as the near-exclusive use of the satisfaction variable to evaluate the quality of a visiting experience (Kohlhardt et al., 2018; L. Li et al., 2017; Papadopoulou et al., 2023).
To minimize methodological failure and better understand visitors’ feelings regarding crowding and congestion, studies have included other measures to evaluate the quality of the visitor’s experience, such as the destination’s perceived attractiveness (L. Li et al., 2017), loyalty and repeat visits, and destination recommendations (Papadopoulou et al., 2023). The literature also contains psychological-behavioral explanations such as coping mechanisms and adaptive responses that are used to minimize the marring of a visiting experience at a crowded destination. The central coping mechanisms named are displacement, a change in the pattern of the space’s consumption to adapt to environmental limitations, and rationalization, supplying a positive logical explanation to the experience (Kohlhardt et al., 2018; Papadopoulou et al., 2023; Pons et al., 2014; Stokols, 1972).
Measuring the Visitor Experience
Subjective measures
Traditionally, data relating to experiences and emotions have been collected verbally using self-reporting measures such as interviews, surveys, and questionnaires (Hosany et al., 2021). But this methodology comes with a limitation: a time gap between the core experience and data collection. Retrospective assessment is often rosier and results in an overall evaluation rather than an estimation of the episodic experience (Chark et al., 2022). In order to bridge the gap, activity diaries have been used; these can be filled in during the experience and on site, rather than retrospectively (Shoval & Isaacson, 2009). The cellular revolution made it possible to employ traditional sensing methods online as well, in real time, increasing the data’s credibility and response rates. Research methods that collect data regarding visitors’ experiences and feelings in a destination in real time are called “experience sampling methods” (ESM; Birenboim & Shoval, 2016). Whether collected manually or online, these data are subjective; they are an active and conscious response and include anticipation, interpretation, and reflection, tied to the time of data collection (pre-travel/on-site/post-travel) (Park & Santos, 2017).
Tourism studies based on visitors’ retrospective assessments have tended to view emotion as static. But multidimensional psychological models that identify core affect can overcome this shortcoming. In contrast with the basic approach, which identifies a limited number of key emotions, the multidimensional approach categorizes emotions in relation to a number of facets (S. Li, 2021). These studies rely on Russell’s (1980) circumplex model of affect, which suggested two basic affective dimensions: arousal and valence. This conceptual model (see Figure 2) places the different arousal levels on a vertical axis, moving from high arousal/activation to low arousal/deactivation. On the horizontal axis, the valence levels move between pleasant and unpleasant (positive and negative affect). The integration of the two makes it possible to identify and assess affective states (Posner et al., 2005).
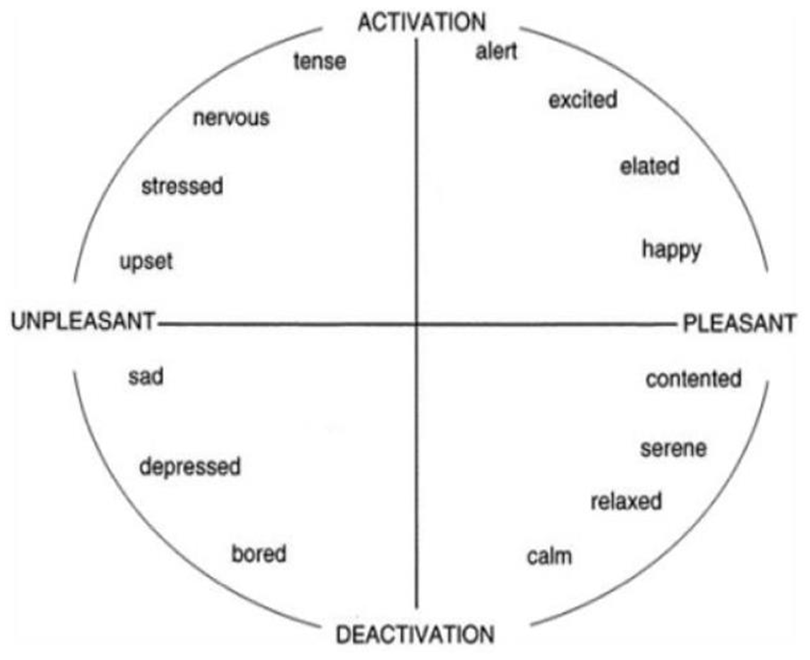
The circumplex model of affect, from Posner et al. (2005).
Objective measures
The use of wearable biosensing and advanced tracking technologies has opened up a new world of possibilities for evaluating a participant’s visiting experience. In contrast with subjective sensing, which is dependent on the user’s activity, here the sensing methods are objective, with the participant passive; data are automatically, methodologically, and unconsciously monitored (Birenboim & Shoval, 2016).
Spatial-temporal tracking
The use of advanced tracking technologies in tourism studies—Global Positioning System (GPS) tracking devices, mobile location and big data sources, Bluetooth tracking, geographically coded social media, and image databases—has greatly increased over the past two decades. While traditional analogue methods such as surveys, travel diaries, and observations help generate a broader picture of tourists’ spatial and temporal activity patterns, the new digital methods offer researchers precise data with a high-resolution in time and space (Hardy, 2020; Reif & Schmücker, 2020; Shoval & Isaacson, 2009). Of the digital tracking technologies, GPS techniques are the most commonly used. In addition to their accuracy, they are usually accompanied by surveys that provide personal data about the tourist. However, dedicated GPS devices’ data-collection process requires many resources, limiting sample size (Shoval & Isaacson, 2009). Big data sources (i.e., Passive Mobile Data) can also be employed to identify tourists’ spatiotemporal movement patterns at a higher volume and velocity—yet big data sources come with their own limitations, such as restricted data access, privacy concerns, and the lack of personal data (Reif & Schmücker, 2020).
Early tourism studies using advanced tracking technologies focused primarily on the methodological dimension and its potential for the field. Current tourism studies have done so on a greater scale, even subverting fundamental questions in the field of tourism and consumer behavior (Shoval & Ahas, 2016). So, for example, De Cantis et al.’s (2016) study used advanced tracking technologies to examine the effects of incentives on spatial behavior among visitors to Palermo, Sicily. Hardy et al. (2020) used the high-resolution spatial-temporal data of some 900 visitors, aiming to assess the main factors influencing the dispersion of tourists on a national level on the Australian island of Tasmania. Recently, Mashkov and Shoval (2023) presented an innovative application for GPS data in calculating high-resolution tourism demand indicators, using a large sample of approximately 3,000 tourists whose activity was also documented on a national level.
Emotional arousal detection
Psychophysiology assumes a connection between human psychology and physiological changes in the human body (Green et al., 1970), making it possible to evaluate stimulus-related emotional arousal through autonomous physiological responses (Levenson, 2014). The sympathetic nervous system (SNS), which is responsible, among other things, for the sweat glands and sudomotor activity, is often used for measurement (Boucsein, 2012; Braithwaite et al., 2013). “Emotional sweating” occurs in places such as the palms of the hands or soles of the feet; sweat glands, concentrated in great density, respond not only to thermal stimuli but also to emotional stimuli. The sweat serves as an indicator of emotional arousal and can be measured in relation to the skin’s electrical characteristics (Aqajari et al., 2020; Posada-Quintero, 2016). The ability to recognize and measure signs from the brain’s control center through the skin has made EDA (electrodermal activity) one of the most researched activities of the SNS (Braithwaite et al., 2013; Hosany et al., 2021).
Electrodermal activity is documented using two elements: the skin’s electric resistance (SR) and the skin’s electric conductance (SC). The more sweat is secreted, the lower the skin’s resistance (SR) is and the more the skin’s conductance (SC) grows (Boucsein, 2012; Posada-Quintero, 2016). The EDA complex includes two components: the tonic and the phasic. The tonic component relates to general conductivity; it is noticeably different between individuals, varies slowly, and is characterized by a constant upward trend. In contrast, the phasic component is reactive, and documents quick and momentary changes. This reactivity makes it possible to gauge emotional arousal in relation to a specific event or stimulus taking place in the range of 1–4 seconds before the measurement is taken. Sudden changes in phasic activity above the tonic activity are known as EDA/GSR peaks (see Figure 3) (Braithwaite et al., 2013; iMotions, 2017; Posada-Quintero, 2016). Recent technological improvements in measuring tools, which now have a higher sampling rate, have shown that for 50% of subjects, the scope of latency is limited and ranges between 1.6 and 2.23 seconds (Sjouwerman & Lonsdorf, 2019). For more detailed data about the anatomical, physiological, and biophysical aspects of electrodermal research, see Boucsein’s 2012 book, The Electrodermal Activity.
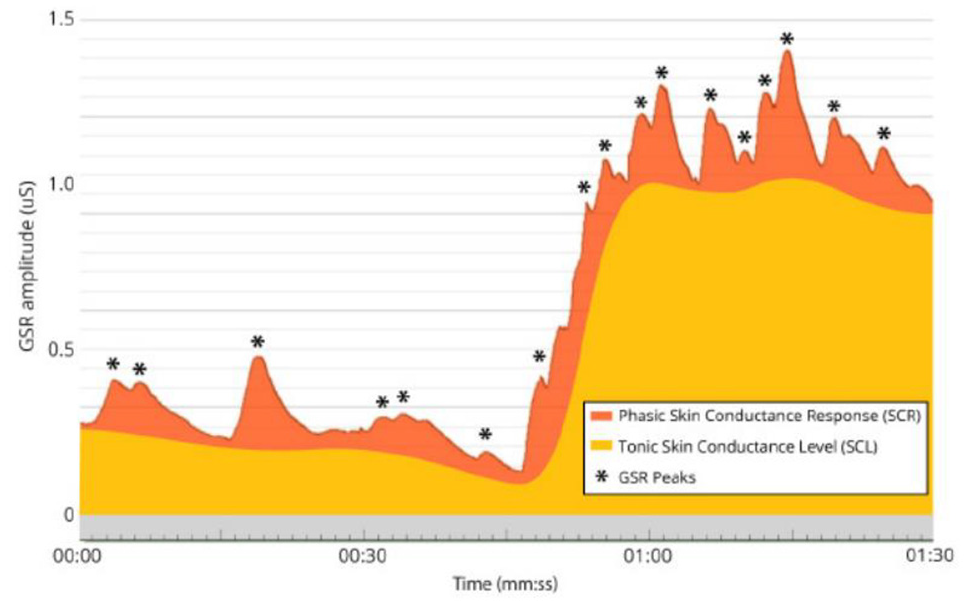
Components of the EDA complex (from iMotions).
Psychophysiological experiments have examined the effects of crowds and interpersonal proximity on emotional arousal. Epstein et al. (1981) conducted a simulation in a lab setting, examining the emotional response to crowding using metrics that belong to the cardiovascular system. In contrast, Christou et al. (2015) measured human responses to changes in crowds in a virtual reality simulation using cognitive and physiological metrics, including EDA. These two lab experiments, which demonstrated the widespread psychological occupation with the subject, reached similar conclusions: a sharp increase in emotional arousal was seen in response to a rise in crowding and level of proximity.
Emotions are an important dimension in the visiting experience (Hosany et al.,2021). Physiological tools can measure electrodermal activity, improving our understanding of the experience and influencing how destinations are planned and managed. Over the past decade, scholars in the field of tourism have also begun to incorporate these methods into their research. However, these tools have not yet been applied widely, and most studies have sampled an average of about 60 participants (S. Li et al., 2022).
Combined methodology
Combining emotional data with spatio-temporal data makes it possible to study and map emotional responses in relation to various environmental characteristics (Shoval et al., 2018a). A methodology that combined spatial tracking and physiological monitoring was first presented in tourism research by Kim and Fesenmaier (2015), who demonstrated the feasibility of objective emotional mapping in real space and over time using GPS tracking and EDA monitoring for two subjects. Shoval et al. (2018a) applied a combined methodology that included four data-collection techniques: time and space data, real-time surveys, physiological metrics, and retrospective questionnaires. The methodology was implemented on a wider scale (n = 68) in an urban context. In another analysis (Shoval et al., 2018b), the interaction between space and emotion was examined both in tourist and broader urban contexts. The two methods of measuring emotion—objective and subjective—–did not result in uniform patterns. A recent tourism study employed a combined methodology of subjective and objective emotional measurement on a relatively broad scale (n = 123) to assess the visiting experience at an amusement park. Levels of physiological arousal and subjective retrospective assessments displayed no notable correlation (S. Li, 2021). One possible explanation is that EDA, which measures emotional arousal, does not expose emotional valence; high arousal levels can be related to positive or negative emotions. This explanation underscores the need to supplement physiological measures with self-reports, which provide information about valence, in order to better capture tourists’ emotions (S. Li, 2021; Shoval et al., 2018a, 2018b).
Methodology
Research Methods
The present research aims to examine the reciprocal relationships between density and crowding, on one hand, and visitors’ emotional arousal, on the other, in an urban public space. Density levels were the independent variable; their effect on emotional arousal, the dependent variable, was the study’s subject. Crowding was defined as a binary variable, with off-peak and peak hours) identified in relation to the activity in urban space.
Two sampling methodologies were used to quantify emotional arousal: (1) the subjective sampling method, which included online questionnaires for self-reporting during the experiment and after it, and (2) the objective sampling method, which included wearable biosensors for monitoring visitors’ emotional arousal. The Shimmer3 GSR+ was used to monitor electrodermal activity (EDA), specifically skin conductance (SC). Data collection, processing, and analysis for each methodology are detailed below in section “Research Data.”
Research Location
Jerusalem’s Mahane Yehuda market was selected as the study’s field of research (see Figure 4). The market began to function in the late Ottoman period as the first market outside of Jerusalem’s Old City walls. During the British Mandate era, it became more firmly established and transformed from a temporary market to a permanent one. After the State of Israel’s establishment, it became the western city’s central market. In the late 1990s and early 2000s, the market experienced a decline as a result of terror activity and processes of suburbanization, with the building of Jerusalem’s satellite neighborhoods. In the past decade and a half, within efforts to revive Jerusalem’s city center, the market has undergone a wide-scale process of touristification; abundant restaurants, cafés, pubs, and souvenir shops have opened (Mashkov & Shoval, 2020).
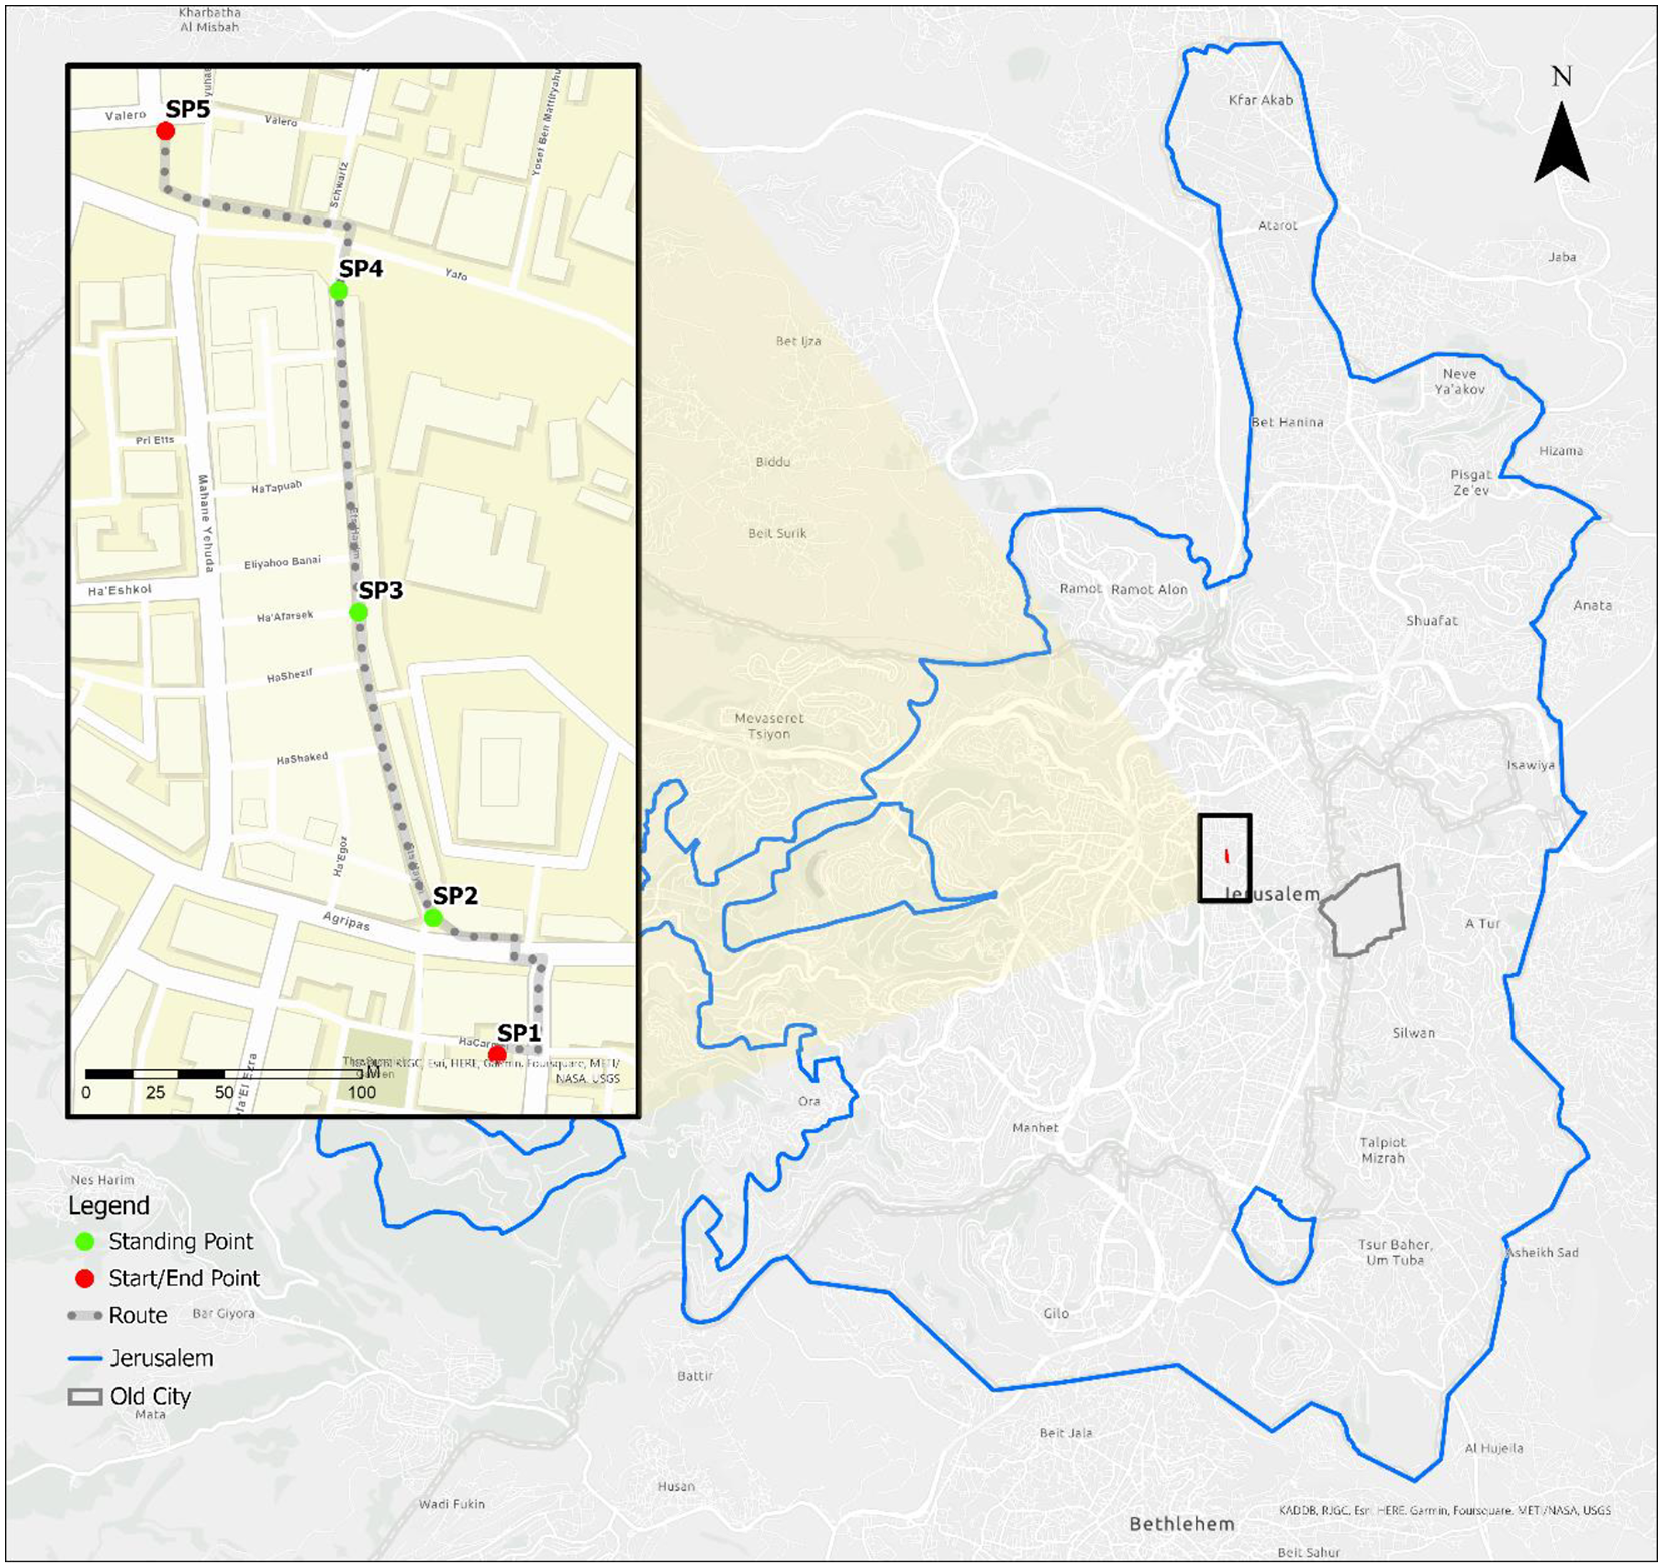
The walking route in the market.
Today, visits are made to the market not only for purposes of food consumption but primarily for recreation. Correspondingly, the mix of visitors and visiting hours in the market has expanded and it is characterized by regular periods of high and low density.
Geographically, the market is bounded to the north by Jaffa Street and to the south by Agrippas Street (see Figure 4). Etz Haim—one of the two central streets, which has light roofing and is relatively narrow (roughly 2 meters)—was selected for the study. This was due to three characteristics: its mixed uses, the fluctuations of its visitors, and its structure.
One challenge of working outside of a laboratory setting in real conditions was the difficulty controlling and stabilizing independent variables; nonetheless, the street’s spatial structure made it possible to replicate the visiting experience in a way that minimized the disruptive variables, ultimately creating a “living laboratory.”
Research Population
The experiment was conducted in August and September of 2021 and used 25 participants, all students in institutions of higher learning in Jerusalem, most of them undergraduates. Because data were collected at the beginning of the fourth wave of COVID-19 in Israel, when there were restrictions on international movement, using a tourist sample was not possible. The selection of the student population was not intended to represent the tourist population but rather to demonstrate the method’s feasibility.
The students’ age range was relatively homogenous, with the vast majority defined as young adults in the third decade of their lives. All were Jerusalem residents, and the vast majority lived near the market (a distance of up to 1,500 meters). The gender breakdown between women and men was almost equal. Participants were selected according to the limitations of the tracking devices being used: they did not wear glasses or contact lenses, had a normal health status, and were not epileptic.
Because this was a preliminary study and in light of the small sample, an effort was made to make the research population as homogeneous as possible to reduce the variation between the participants.
Experiment Design
The study was designed as an intra-subject experiment; this made it possible to examine how each subject responded to varying crowding conditions while circumventing physiological differences between participants (Boucsein et al., 2012) and increasing the study’s statistical power. It was comprised of three stages—setup, a morning walk, and an afternoon walk—with the last two constituting a repeated task for the intra-subject analysis.
The first stage included meeting with the participant; giving a short explanation about the course of the experiment and the sensors that would be worn, including the correct way to use them; signing a consent form; and answering a preliminary questionnaire.
The second and third stages consisted of taking a short walk in the market along a fixed route (some 300 meters) at two different times: morning and early afternoon. The morning walk was defined as ranging between the hours of 7:00 and 9:00 a.m. (on Friday mornings, between 7:00 and 8:00 a.m.), when the market was coming to life and free of visitors (off-peak). The afternoon walk was defined as ranging between 12:00 and 3:00 p.m. (on Fridays, from 10:00 a.m. until 3:00 p.m.), when the market was filled with visitors (peak hours).
Despite the fact that the experiment was conducted during COVID-19, the peak times at the market remained the same. This was thanks to Israel’s high vaccination rate during the period, which was about 60% of the population (first and second dose) (Israel Ministry of Health, 2023), and to the “soft containment” policy declared by the Israeli government, which aimed to suppress contagion with minimum harm to the economy (Lubell, 2021), resulting in an easing of restrictions, especially in open public spaces (mask-wearing was not obligatory and gatherings of up to 5,000 people were permitted in open spaces).
Figure 5 demonstrates the varying crowding states at the market at the two different times (participant no. 21 is wearing a yellow t-shirt and encircled by a red dashed circle).
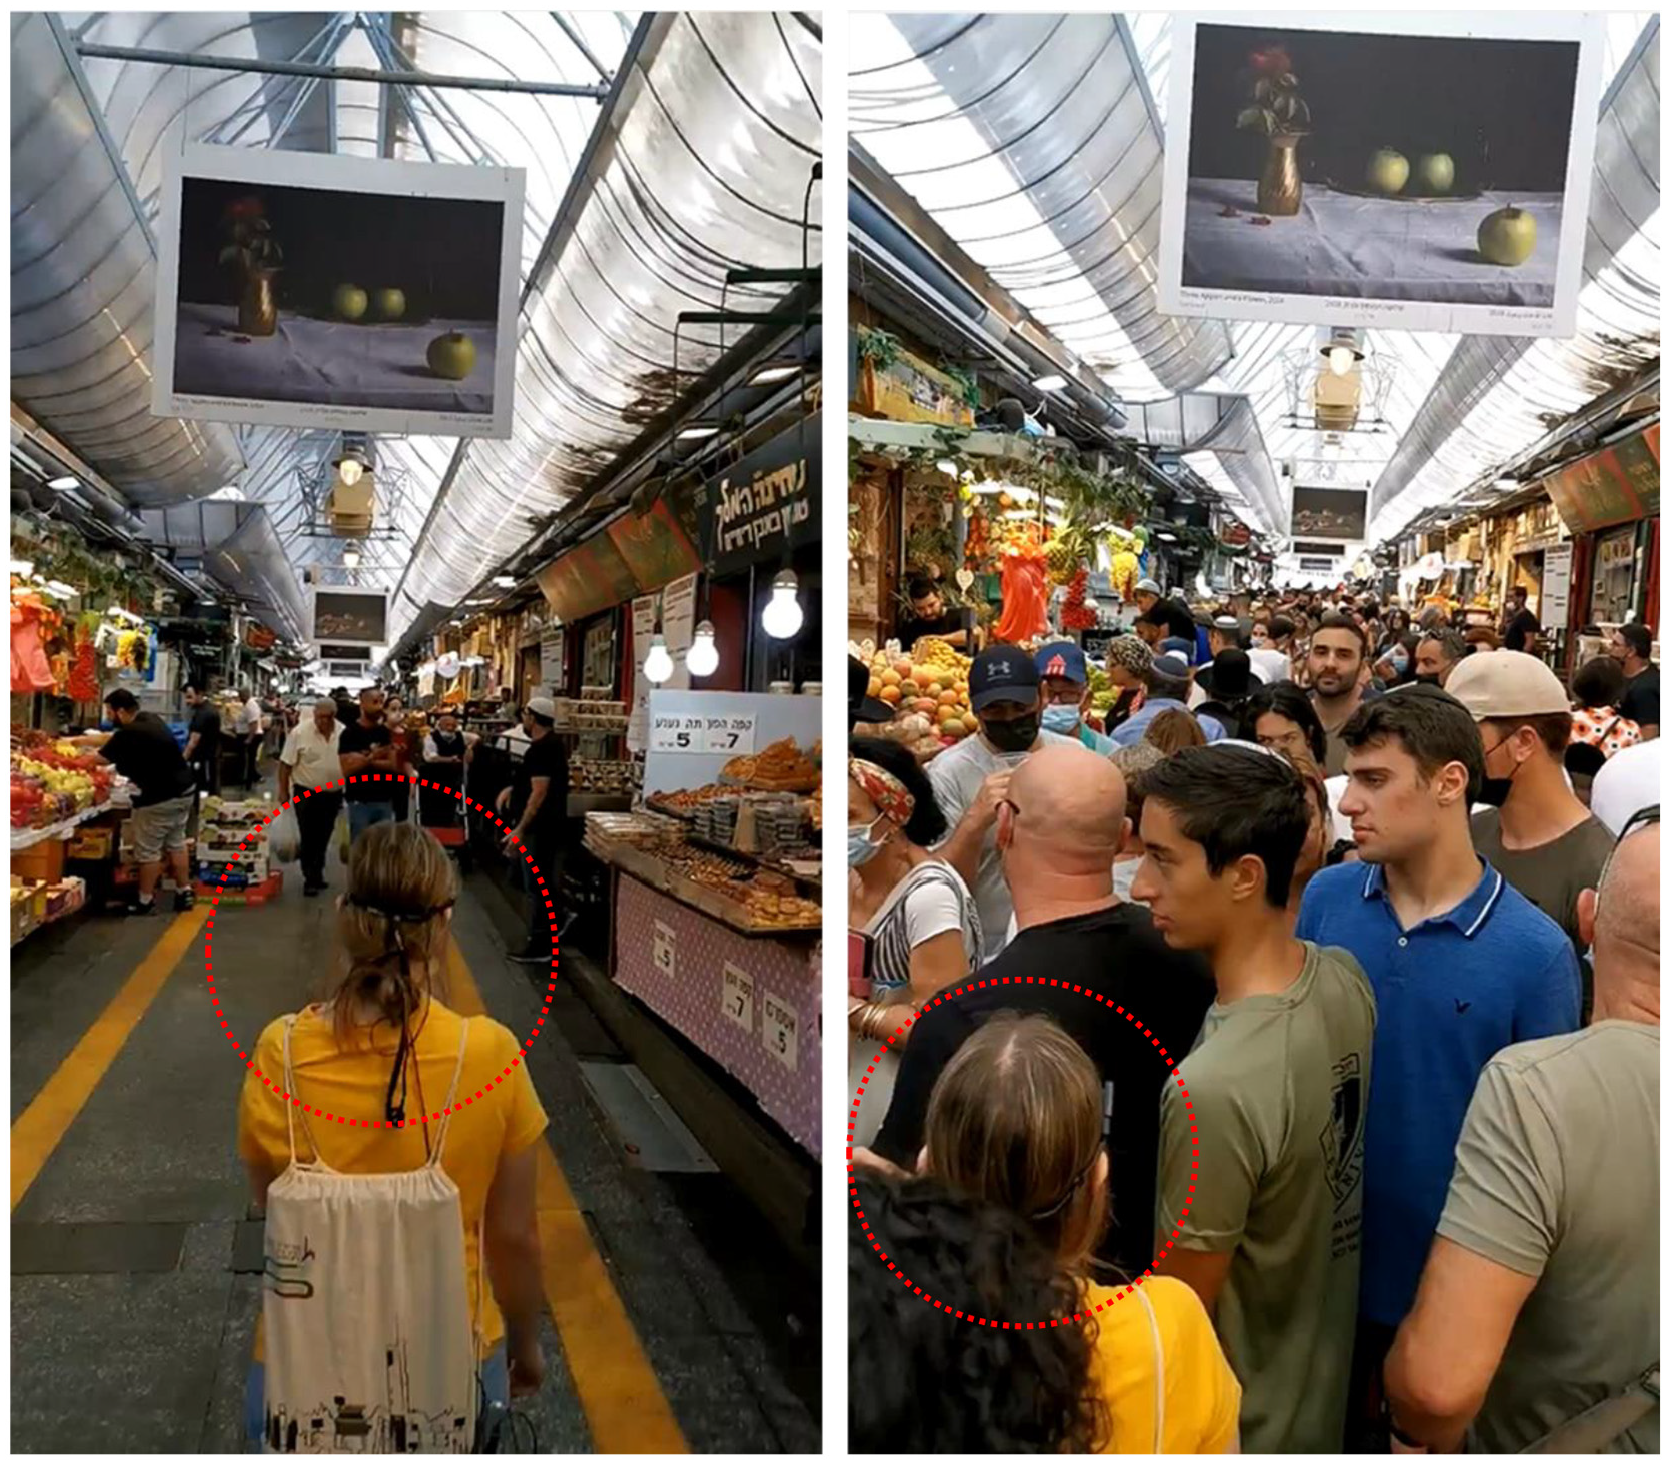
Participant no. 21 walks in the Mahane Yehuda market in two varying density levels (left: morning walk; right: afternoon walk).
Stages 2 and 3 included outfitting the participant with equipment and adjusting it as well as calibration and baselining, marking a value against which the data received during walks could be compared. Along the route, five standing points of two minutes each were defined. The first and last points were labeled the base and relaxation points, respectively, and they were, in effect, outside of the domain of the market (see Figure 4). During each walk, participants completed a short online questionnaire in which they reported on their subjective feelings immediately after a standing point (SP).
After each walk, the participants were disconnected from the devices and asked to complete an additional questionnaire, in which they were given the opportunity to detail their feelings regarding the walk. After the second walk, the questionnaire also included questions comparing the two walks.
At the end of the experiment, participants received financial remuneration for their participation.
The experiment’s design took technical and technological limits into consideration, as well as the methodological limitations detailed below in section “Limitations and Future Research.”
Research Data
Self-reported arousal
Data collection
Subjective emotional data were collected using three types of questionnaires (see Supplemental Appendix 1): a preliminary questionnaire, an online questionnaire, and a concluding questionnaire. The preliminary questionnaire (A) was used to characterize the participants (gender, age, place of residence, academic program, etc.), their consumption and recreation habits, and their general preferences regarding crowding and COVID-19. The online questionnaires (B) were used to characterize the level of crowding in the market, participants’ subjective emotional arousal, and their perception of safety; they were filled in by the participants during the walk, in real time, after each standing point (SP1–5). The concluding questionnaire (C), completed at the end of each walk, was used to expand on the participants’ subjective emotional response and elaborate on their emotions at each standing point within the market (SP 2–4) using open, binary, and 5-point Likert scale questions. After the second walk, the concluding questionnaire (D) also included questions comparing the two walks and regarding the impact of COVID-19 on their concerns about crowdedness within the market.
The evaluation of the state of crowding was measured using a 5-point Likert scale question. Participants were asked to assess the level of crowding in the market, with 1 being very low and 5 being very high (questionnaire B). The quantitative emotional perception of crowding was measured according to Russell’s (1980) circumplex model using two dimensions: valence and arousal. A simple binary question was used for valence; it established whether the feeling was positive or negative. For arousal levels, a 5-point Likert scale question determined to what extent standing at this point evoked emotions, with 1 being no emotions evoked and 5 being a high level of emotion. The emotional perception of crowding was also given qualitative expression through open questions: participants were asked to describe their emotions and explain what triggered them.
Data processing and analysis
The answers to the closed questions (binary or 5-point Likert scale) were averaged per each standing point and per walk (morning/afternoon). The answers to the qualitative open questions were analyzed using a word cloud generator created by Jason Davies (https://www.jasondavies.com/wordcloud), which presents a visual representation of word frequency. The quantitative and qualitative data received during and after each walk were cross-checked to better understand the causation behind the emotional arousal reported. An additional comparison was conducted between the subjective emotions reported and the objective emotional data collected (see details in next section).
Measured arousal
Data collection
Objective emotional data were collected using the Shimmer3 GSR+ bio-sensing device, which measures GSR (Galvanic Spin Response; Shimmer, 2018). GSR is recognized in research literature as EDA (electrodermal activity), and it is used to define the autonomous changes in skin’s electric characteristics—SC and SR (Boucsein, 2012). The Shimmer3 GSR+ is a wearable physiological sensor that facilitates ambulatory assessment (AA) of everyday experiences in real-world conditions (Trull & Ebner-Priemer, 2013). It records electrodermal activity externally by transmitting a low electric current between two points of contact with the skin and measuring the difference between the two results.
Measurements were taken using a pair of electrodes connected to the proximal phalanges of the palm of the hand on the index and middle fingers (see Figure 6). To avoid interference during monitoring, the measurement was taken from the non-dominant hand and participants were instructed to avoid moving the hand as much as possible. The raw EDA signals included only two measures—SC and SR—and were gathered using iMotions software, which facilitates the simultaneous collection of data from several biosensors. While emotional data were collected throughout the walks (both morning and afternoon), they were analyzed only for the five standing points defined and not for the total walking time. For this purpose, each standing point with a time window of 2 minutes was marked in the software as a separate annotation.
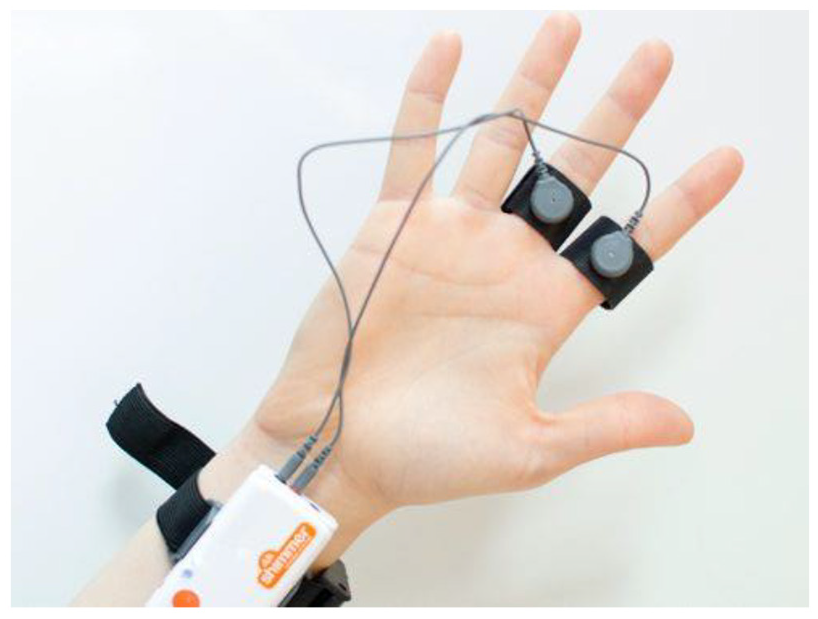
Placement of electrodes and manner of wearing emotional biosensor (from iMotions).
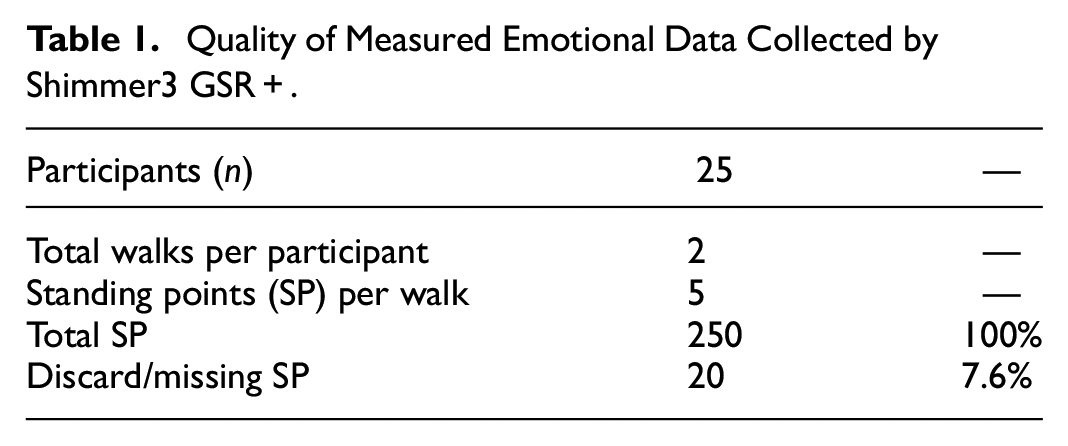
The data from the Shimmer3 GSR+ were sampled at a speed of 1,024 Hz and transmitted wirelessly to the iMotions software using Bluetooth technology. Due to the relatively small reception range, participants were asked to carry the laptop to which the data were being streamed on their backs. Nevertheless, approximately 8% of all objective emotional data measured were invalid. Samples of 10 standing points were monitored for each participant (five from each walk); in total, the analysis included 230 high-quality sampling points (see Table 1).
Quality of Measured Emotional Data Collected by Shimmer3 GSR+.
Data processing and analysis
It was necessary to extract the phasic data from the tonic component to identify peaks. Data processing was comprised of several stages and used Ledalab software, a free program based on MATLAB, for processing and analyzing SC data (http://www.ledalab.de). To make processing and analysis easier, a far lower sampling rate than the original could be used without weakening the data (Aqajari et al., 2020). Thus, the first stage included downsampling to 16 Hz. A process of cleaning and correcting the raw GSR data was conducted next to minimize “noise,” which may have resulted from a participant’s movement and/or the movement of electrodes from their place (Xia et al., 2015). Each sequence was reviewed to identify and exclude artifacts (Boucsein, 2012). Visual review and manual correction are feasible for short records (up to 2 hours long); for longer records, a computer-assisted artifact detection and removal program is needed (Boucsein et al., 2012). The current study’s average record time was approximately 30 minutes, so detecting and removing artifacts was done visually and manually via Ledalab software. Noises in the GSR sequence were identified in a limited number of records. These records were also found to be only partial and were ultimately discarded (see Table 1).
The next significant stage was EDA decomposition, the deconstruction of the EDA data to their phasic and tonic components. The decomposition used a threshold value recommended in the research literature for identifying a peak (SCR): 0.05 microsiemens (uS). The decomposition was conducted using continuous decomposition analysis (CDA). For more on the method and its advantages relative to the classic method of CTTP (Classic Trough-to-Peak method), see Benedek and Kaernbach (2010).
The accepted metrics for assessing level of emotional arousal are the average peak amplitude, measured in microsiemens (uS), and peak count (Aqajari et al., 2020). These metrics were calculated for the five standing points defined as annotations. Average peak amplitude was calculated for each participant at each standing point. The total peaks in each segment (peak count) and their division over the course of the segment created the comparative metric of peaks per minute. The intra-subject array, used to overcome the relatively small sample size and variation between participants, included an ANOVA analysis of variance for repeat measurements. The statistical analysis was conducted using TIBCO’s StasticaTM. It included two intra-subject variables: time (morning/afternoon), attesting to the level of congestion in the market, and location within the market (standing points).
Results
Measured Data
Below, we present the objective emotional SCL data: average number of peaks per minute and average peak amplitude.
Peaks per minute
Figure 7 shows number of average peaks for the two walks. To compare the participants, the number of peaks was normalized by dividing into the duration of stay in each standing point. The average number of peaks per minute received for the afternoon walk was slightly higher than that of the morning walk.
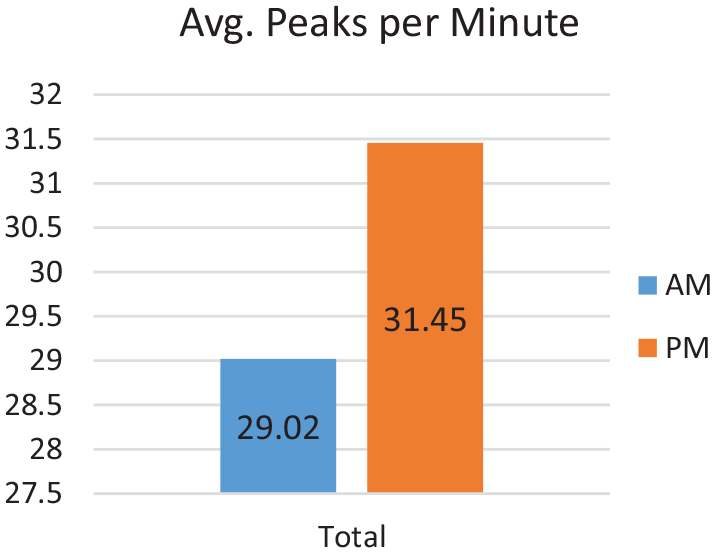
Average peaks per minute for each walk.
Average peak amplitude
An ANOVA test was run on the repeated measurements to examine the effect of the time (AM/PM) and place of measurement (SP) on the dependent variable (avg. peak amplitude). A significant main effect was found for the time of measurement (AM/PM), with the average peak amplitude lower in the morning (average and standard deviation) than in the afternoon; F(1,13) = 17.08, p = .001/p < .01, partial eta2 = 0.567876. The location of the measurement (SP) also showed a significant main effect, with the average amplitude lower at standing points 1–3 (average and standard deviation) than at points 4 and 5; F(4,52) = 3.44771, p = .014/p < .05, partial eta2 = 0.209616.
In addition, a significant interaction was found between time and place of measurement (see Figure 8). The morning walk showed almost no difference in emotional arousal between different standing points; in the afternoon, as the subject progressed, emotional arousal grew; F(4,52) = 2.62, p = 0.045/p < .05, partial eta2 = 0.167947.
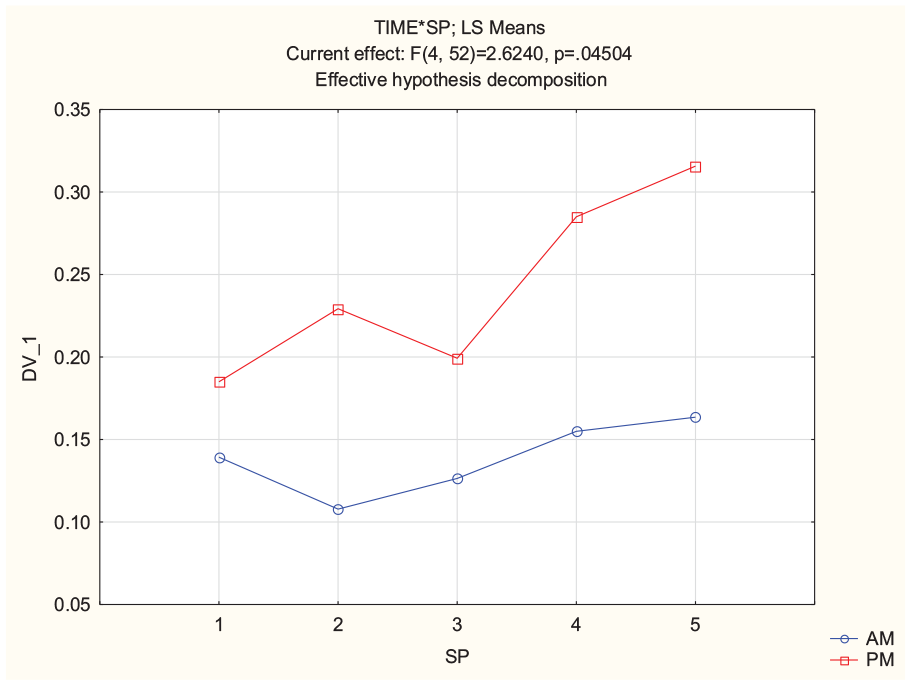
ANOVA analysis, significant main effect of interaction between time and place.
Because the interaction was significant, it could be decomposed—that is to say, different comparisons could be studied in order to understand the interaction’s source. We examined the difference between the first standing point (the baseline) and other points. When the interaction was deconstructed into simple effects, we found that the contrast in the morning was not significant; F (1,13) = 0., p = 0.97 p > .05, partial eta2 = 0. In the afternoon, however, the contrast was significant; F ([1,13) = 4.98, p = .043/p < .05, partial eta2 = 0.27. That is to say, the average amplitude values in the afternoon were significantly different from those of the baseline, a variance that did not exist in the morning walk.
Self-reported data
Participants’ self-reports regarding the cognitive perception of crowding in the market during the walk formed an inverse U, with the central point in the market (SP3) characterized as having the greatest level of crowding and the curve’s “tails,” the baseline (SP1) and relaxing (SP5) points, the lowest. The two walks may show a similar trend, but upon comparison, it is clear that the crowding perceived in the afternoon walk was recognizably higher than that of the morning walk (see Figure 9).
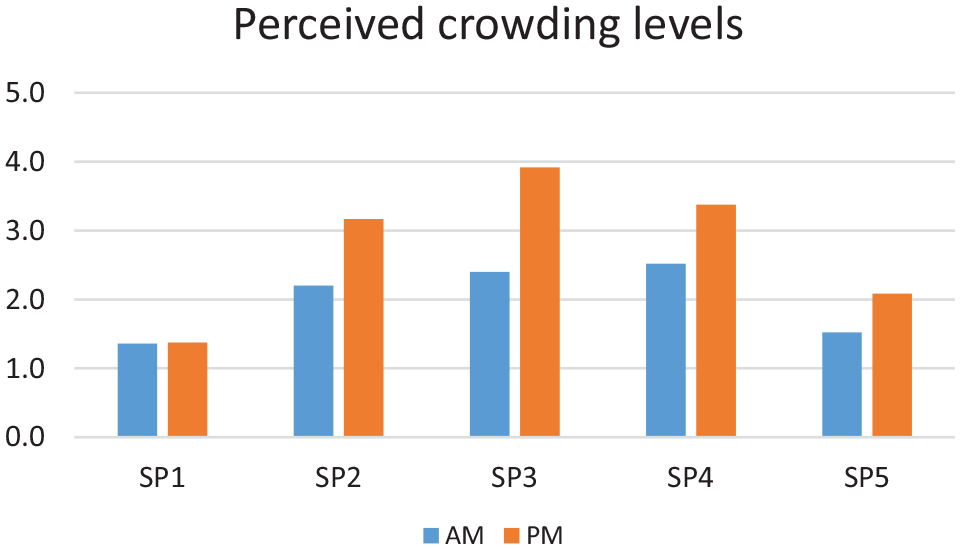
Ranking of cognitive perception of crowding at each standing point.
Participants’ self-reports regarding their emotional perception of crowding related to three standing points in the market (SP2–4). For the valence dimension, it was found that the vast majority of the morning walk caused a positive emotional reaction at each standing point (average of 92%). In contrast, reports about the afternoon walk were not uniform; the standing point at the market’s center was assessed for the most part as negative (average of 68%), in contrast with the market’s two other standing points (SP2, SP4), which for the most part produced a positive emotional reaction (average of 74%). Regarding arousal, the levels of emotional arousal reported were slightly higher during the afternoon walk (64% during the afternoon walk as opposed to 47% on the morning walk).
The inverse U that characterized the respondents’ evaluation of crowding also depicted the emotional perception of crowding, specifically during the afternoon walk; the standing point at the market’s center (SP3), which was perceived as the most crowded, was reported both as the point that caused the most negative reaction and as the one that aroused the most emotions (see Figure 10). To measure the linear correlation between the cognitive and emotional perceptions of crowding, a Pearson correlation coefficient was calculated. A very high correlation was found both for valence (Pearson = 0.9292) and for arousal (Pearson = 0.8643).
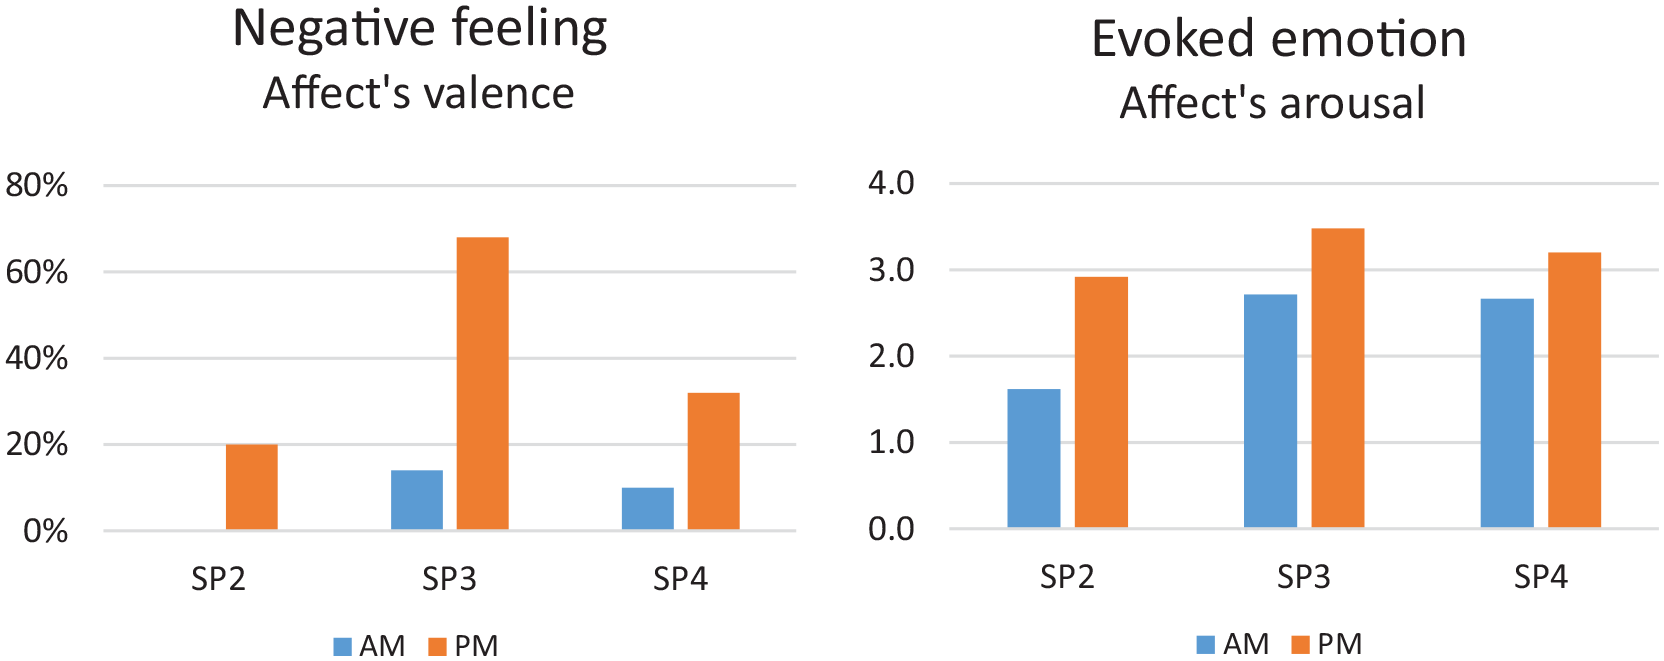
Summary of reported metrics concerning the emotional perception of crowding (SP2–4).
Retrospective self-reporting of participants’ emotions also related to the market’s three standing points (SP2–4). For the standing point at the market’s entrance (SP2), the participants described emotions that were relatively similar in both walks: calm, curiosity, and indifference. Additional descriptions noted in relation to the morning walk were excitement and anticipation, as this was the first time the participants were entering the market with all of the equipment.
The standing point at the market’s center (SP3) was documented in the quantitative analysis as the most crowded in relation to the other standing points for both the morning and the afternoon walk. The relatively high perception of crowding was expressed in the morning walk as positive (pleasure), with medium arousal levels characterized by calm and indifference alongside curiosity and interest. In the afternoon walk, this point was reported as the most crowded, not only in relation to the other points during the afternoon walk but also absolutely for both walks. At this point, the high perception of crowding generated high and negative emotional arousal described as pressure, nervousness, and stress (see Figure 11).
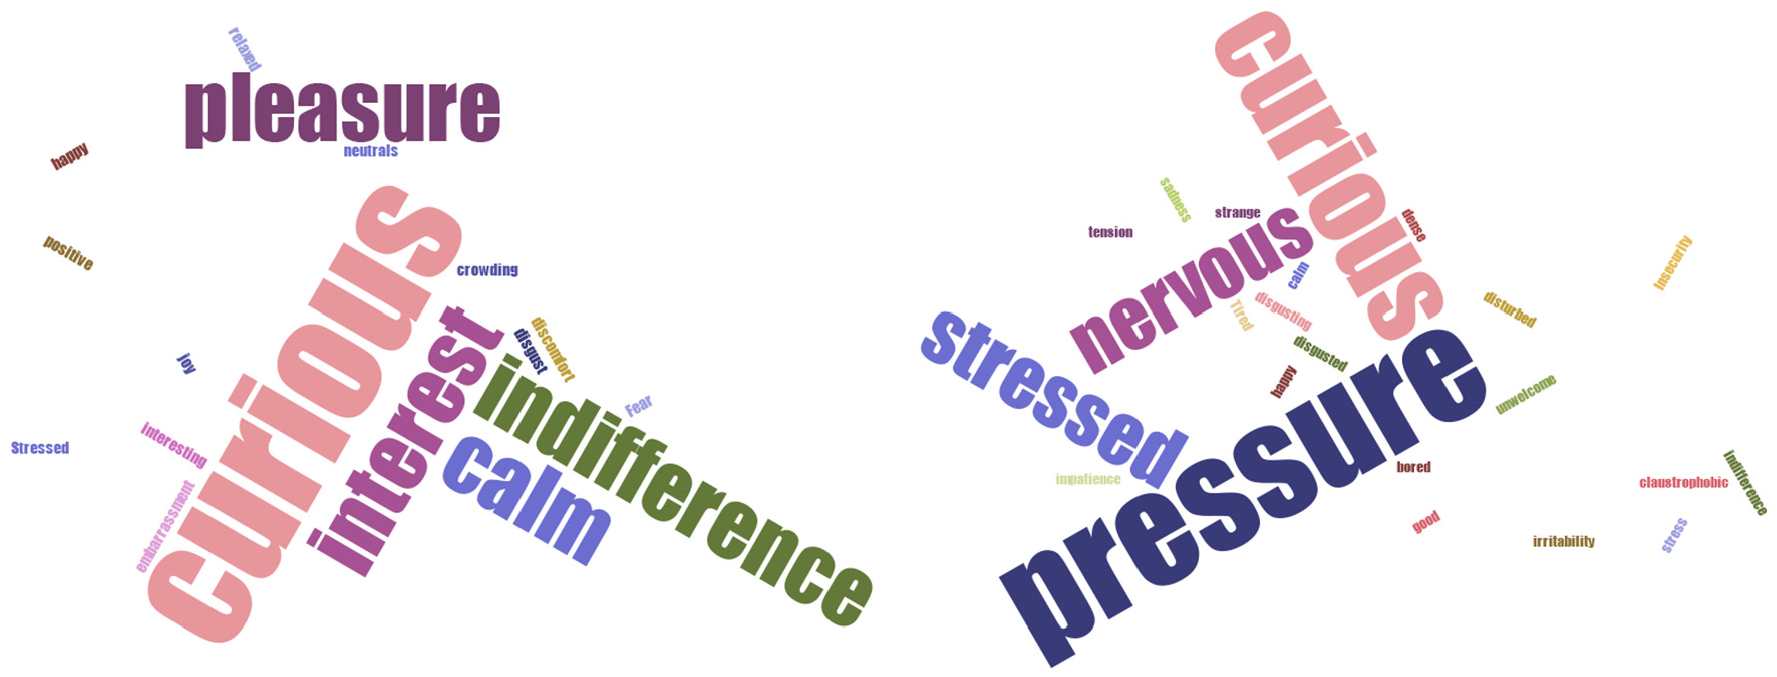
Animated word cloud: Participants’ descriptions of their emotions at SP3 (left: morning walk; right: afternoon walk).
SP4, located before the exit to Jaffa Street, was the market’s last standing point. Participants’ descriptions of emotions at SP4 differed for the two walks. Calm and curiosity were some of the descriptions of emotions in both walks, but while the morning walk was characterized by positive descriptions such as fun and amused, and it was clear that arousal levels were lower (indifference), the afternoon walk also included negative descriptions such as unpleasant, pressure, and nervousness. A notable positive feeling that arose in the qualitative report for this standing point in the afternoon was relief, which corresponded with the point’s spatial location and with the negative sense of pressure described in reference to the previous standing point (see Figure 12).
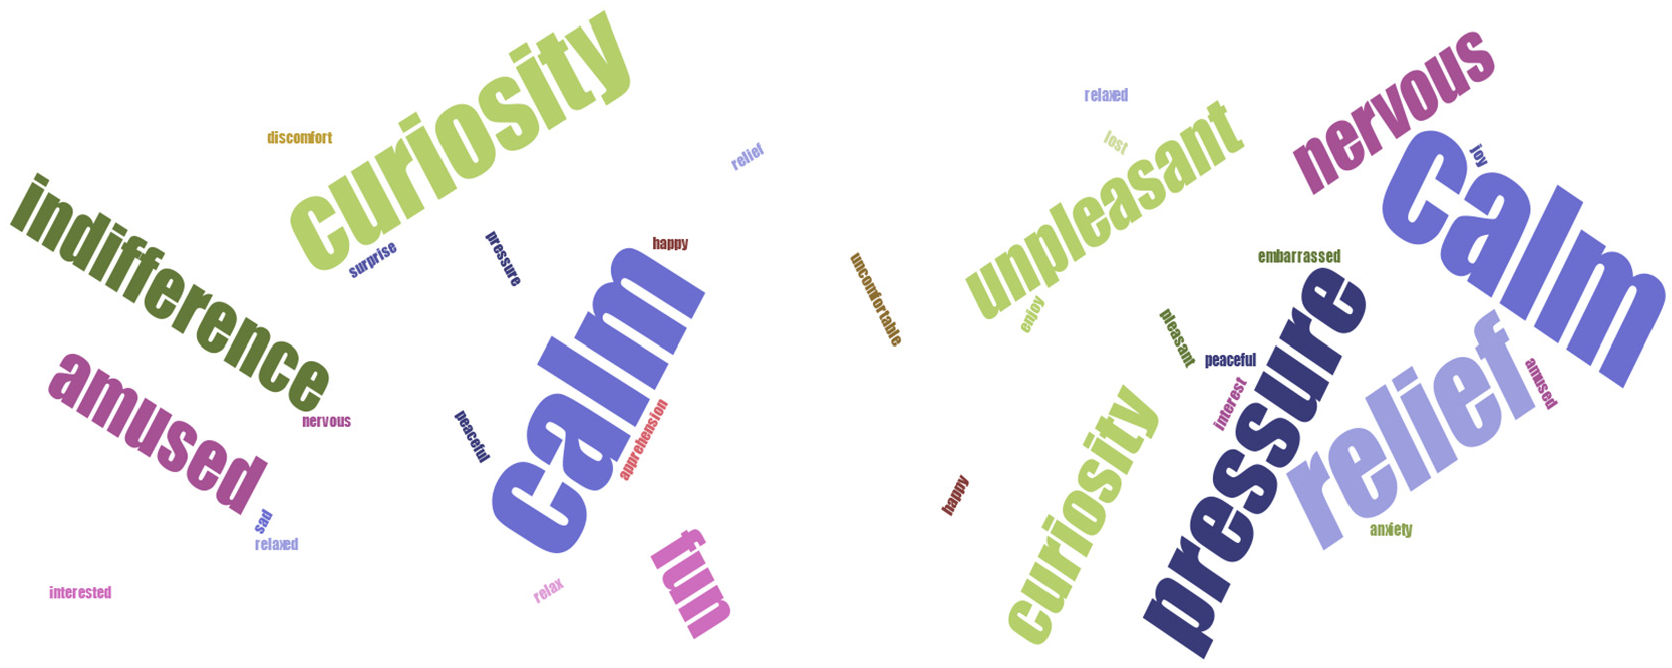
Animated word cloud: participants’ descriptions of their emotions at SP4 (left: morning walk; right: afternoon walk).
The retrospective self-report also included questions regarding COVID-19 and its impact on the participants’ concerns relating to crowded places and the crowdedness of the Mahane Yehuda market (see Supplemental Appendix 2).
Completing the Self-Reported and Measured Data
A basic analysis of the association between subjective and objective measures was run to assess the relationship between the average measured arousal levels and the average subjective level of emotional arousal for all standing points of both walks. A moderate positive correlation was found, but was not statistically significant (r = 0.371, p = 0.29).
Figure 13 presents a comparison of the subjective and objective measures of emotion (reported and measured) in relation to time and location. Regarding the time variable, in both cases, the afternoon walk was documented as more emotionally arousing. The subjective report provides additional information about emotional valence, which was found to be more negative in the afternoon walk. Nonetheless, when the variable of location (standing point) is examined, differences are found between subjectively reported emotional arousal and objective monitoring at SP3, the standing point at the market center, during the afternoon walk. While subjective reporting classified this point as having the highest emotional arousal, the most negativity, and the most crowding, objective monitoring showed a slight decline at this point, and the two subsequent points (SP4–5) had higher values.
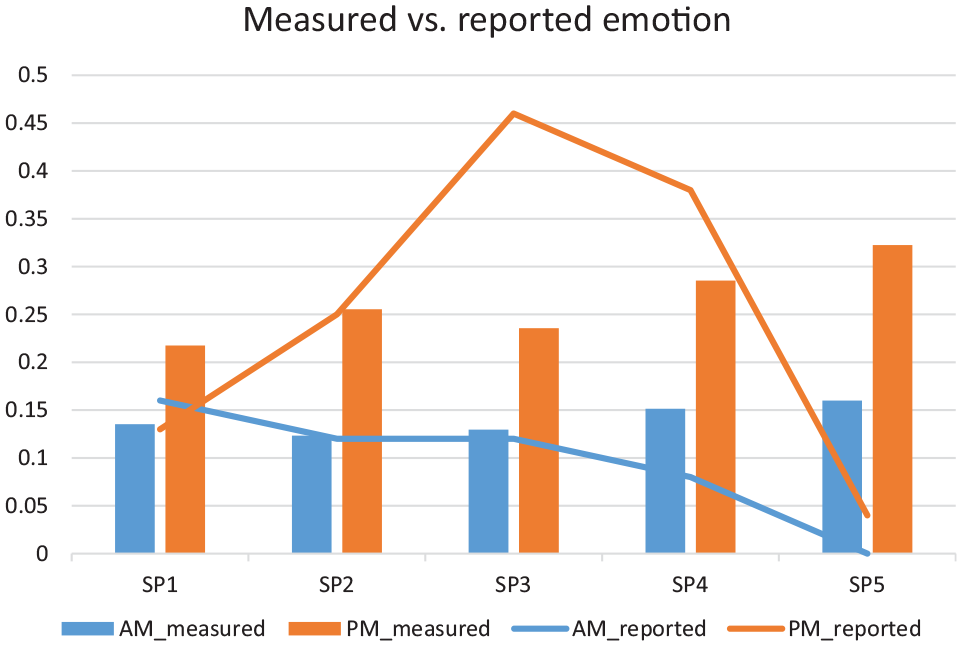
Comparison between reported and measured emotional arousal.
Discussion and Conclusions
This study focused on emotional perceptions of crowding, attempting to assess the effect of crowding on visitors’ emotional arousal in public spaces. The results highlight how crucial it is that geographical and psychological perspectives be integrated using spatial-temporal and emotional tracking and objective and subjective emotional measures. The study exposed new dimensions in tourism research and added to the discussion about overcrowding in visitors’ experience.
Theoretical Contributions
The study’s central theoretical contribution is methodological. Most research dealing with congestion and density’s social effects in the field of tourism has focused on host populations; congestion’s effects on tourists have received less attention (Joo et al., 2019). Moreover, most studies measuring perceived crowding have primarily used subjective self-reporting research methods (Cheng et al., 2021). The present research bridged these gaps by outfitting a visiting population with wearable physiological sensors.
Recent technological developments have made it possible to add objective measures to traditional subjective ones, as suggested by Uysal and Sirgy (2019) and Yu and Egger (2020). This integrated methodology of spatial, temporal, and emotional tracking continues the pioneering research of Kim and Fesenmaier (2015) and Shoval et al. (2018a). The former presented proof of concept; the latter applied the methodology on a wider scale and related generally to the visiting experience. The present study expands the possibilities for measuring visitors’ emotions in real time and in real environments, as well as in the context of tourism congestion and crowding.
Aside from its methodological contribution, the study’s results expand our theoretical knowledge about visitors’ emotional responses under varied congestion conditions, corresponding with previous studies in the field. The study’s results point to a correlation between subjective and objective emotional reports in reference to each of the walks on the macro level. Crowding in an urban consumption space not only generated higher emotional arousal but was also perceived by the visitors as a negative stimulus; among other things, the COVID-19 pandemic raised greater concerns among some of the participants about contagion. This was consistent with psychological studies that recognize crowding as a negative stressor (Stockdale, 1978; Stokols, 1972).
This finding also reinforced the conclusions of Kalisch (2012) and L. Li et al. (2017), tourism and recreation scholars, who claimed that as social density increased, so would tourists’ perception of crowding. They further stated that a strong negative correlation exists between high perceived crowding and the perceived quality of a visiting experience: as the perception of crowding grows, the assessment of the visiting experience’s quality diminishes.
However, a disparity between subjective and objective emotional reports was found when the location variable was added to the comparison. That is to say, when the emotional data for the afternoon walk were analyzed on the micro level—in relation to each standing point—a difference was seen between the reported data and the monitored data. While SP3, located in the market’s center, was reported in subjective measures as the point of greatest arousal and negativity, the objective data point SP4, at the market’s exit, had the highest average amplitude measure. In addition, the subjective measures may have indicated relatively high arousal at this point, but the valence measured were mixed and included positive responses as well.
A corresponding finding was found by Shoval et al. (2018a) between arousal at the observation point of a holy site (the Western Wall) and the stay at the site itself. It can be conjectured that observation, which leads to expectations, results in high objective levels of arousal. While for Shoval et al. (2018a), the observation of the holy site and the anticipation of visiting it created the highest arousal, in the current study, the observation of the open street and the anticipation of easing crowding conditions and the exit from the crowded market led to the highest arousal.
Lastly, the study applied a theoretical framework from the discipline of psychology to human geography and tourism studies to enhance the understanding of crowding’s impact on the visiting experience. This interdisciplinary, holistic approach used new tools and frameworks to tackle a complex phenomenon. Accordingly, the participants’ affect states were measured subjectively using two-dimensional evaluation, as per Russell’s (1980) psychological model. In addition, the objective physiological measures borrowed from the science of psychophysiology were used to evaluate unconscious arousal. Ultimately, the use of a new type of theoretical framework made it possible to present the phenomenon in a more holistic manner.
Site Management Implications
Besides its theoretical and methodical contributions, the study can have significant implications for the tourism industry, particularly for tourism destination management.
To begin with, understanding emotional arousal subjectively and objectively in response to density and crowding within the urban setting can enhance the overall visitor experience. Based on the methods used in the current study, destination managers can use accurate, data-driven conclusions from the proposed methodology to optimize visitor flows and determine capacities.
In addition, the study’s results can inform the design of tourism destinations; creating alternative routes and incorporating rest and observation points can reduce the stress that results from overcrowding and, in turn, improve the quality of the visitor’s experience in destinations.
Furthermore, implementing communication strategies to inform visitors regarding crowding levels in real time (as the data become available) can help adjust visitors’ expectations, allowing them to choose a preferred spatial pattern accordingly, and ultimately helping reduce negative feelings.
Finally, the tools described above can be used together not only for visitors and tourists but also in urban settings to help cities cope with urban pedestrian congestion and improve the quality of the urban space and the individual’s well-being (Hollander & Sussman, 2020). To this end, a four-step framework is proposed to ease urban pedestrian congestion: identification, high-resolution local evaluation, policy formulation, and re-evaluation.
After identifying urban spaces characterized as congested and overcrowded using traditional measurements, the methodology proposed in this study will be applied to supplement it with more accurate and higher-resolution temporal, spatial, and emotional data. Evaluating the ties between the urban space under examination and its users’ subjective and objective emotional responses to overcrowding will assist in formulating desirable urban policy and adapting crowd management strategies (Zhou et al., 2019). Flow mitigation and traffic distribution strategies are recommended in the short term, such as narrowing entrances, real-time load communications, signage, and directions to alternative routes. The long-term strategies will include designing interventions to increase throughput, such as creating rest locations, adding observation points, widening sidewalks, etc. A comparison of the emotional responses before and after the intervention in the urban space is needed for feedback and re-evaluation of the urban policy implemented.
Limitations and Future Research
The study made simultaneous use of several wearable sensors outside of the laboratory in real-world conditions. Alongside the technological complexity and methodological innovation, the study faced a number of limitations that must be noted.
While advanced tracking technologies facilitated quick, precise, and objective sampling, they also included technological challenges: (1) the battery life of different devices limited the number of participants per day; (2) the devices’ connection to data-collection software was not always continuous, with the Shimmer Bluetooth connection (see table 1) being especially choppy; and (3) there were technical limitations related to the devices themselves.
In terms of time-space tracking, the dedicated GPS device had difficulty receiving a signal in closed spaces (Isaacson & Shoval, 2006). The use of a fixed route made it possible to overcome this limitation by supplementing data that were not properly monitored fairly easily.
In terms of emotion, the Shimmer3 GSR+ was chosen for monitoring emotional arousal due to its mobility and precision, as mobile EDA sensors based on the finger and hand showed more credible results for measuring EDA than wrist sensors (such as the Empatica E4; Kleckner et al., 2021). Nonetheless, the pair of electrodes used for monitoring were less convenient to operate and more sensitive to the hand’s movement, which could lead to motion artifacts (Xia et al., 2015). In order to deal with this limitation, the experiment was designed to include specific 2-minute standing points at which participants were instructed not to move their fingers. In addition, the raw data underwent processing and motion artifact removal (see section “Data processing and analysis”).
Though EDA is considered “the gold standard for evaluating arousal” (Boucsein et al., 2012; Sato & Kochiyama, 2022), there are additional mobile physiological sensors, such as body temperature, heart rate (HR), respiration rate, pupillometry, and others, that should be considered for implementation in future studies. For instance, pairing EDA with body temperature can validate the results and reveal various arousal-valence conditions, resulting in a more comprehensive understanding of emotional state (Parikh et al., 2021). In addition, the current study used combined methods to gauge emotional responses, including verbal self-report and psychophysiological measures. Future research should consider assessing the visiting experience by triangulating and adding indirect qualitative emotional measures as well (Hosany et al., 2021).
Methodologically speaking, two main setbacks relate to the population sample—size and characteristics. The relatively small number of participants, which resulted from the high equipment cost and the technical limitations (as noted above), is not representative and does not make it possible to draw statistical conclusions about the general population. In addition, the choice of a student population due to COVID-19 restrictions was a compromise consciously made, given the fact that the research constituted a feasibility study. Future research should include greater numbers of participants and different types of visitors (including domestic and foreign tourists).
Moreover, attributing peaks to a specific stimulus is difficult, especially when experimenting outside the laboratory in a natural environment. While real-world experiments come with many pros, there are cons: the conditions are less sterile and include many noises and stimuli. The interference of external conditions, such as weather and the participant’s physical characteristics, can also influence and distort emotional arousal data. Nevertheless, the experiment was designed so that each participant visited the market twice, with the market’s conditions remaining consistent apart from crowding. The intra-subject measures made it possible to conduct a statistical analysis using the delta data between the two walks.
Future studies should include an additional phase prior to the outdoor experience that uses immersive virtual environment (IVE) technology to measure physiological indices in sterile laboratory conditions. Documenting the impact of crowding on the visitor’s experience first in a controlled environment and then in the real environment will facilitate the experimental task’s validation (Birenboim et al., 2021). In addition, future research should include intervention, an additional task in which the spatial variable (route) is not defined as fixed but rather as unrestricted, allowing for spontaneous movement in space, to investigate coping mechanisms and spatial tradeoffs or the displacement of visitors (Kohlhardt et al., 2018; Papadopoulou et al., 2023; Pons et al., 2014) at sites that suffer from overtourism.
Conclusions
The current study’s objective was to examine the immediate spatial influence of the phenomenon of overtourism—that is, overcrowding—on the quality of the visiting experience and, specifically, on emotional arousal. The disparities in the different definitions of the phenomenon of overtourism, as discussed in the introduction, illustrate how complex and multidimensional the phenomenon is (Koens, Postma & Papp, 2018). What follows is the need to study it in a holistic and comprehensive form (Capocchi et al., 2020; Mihalic, 2020). One of the ways to do this, as suggested in this study, is by using a methodology that integrates spatial and temporal tracking along with objective and subjective emotional measurement.
Relating to the first hypothesis, a correlation was found between actual density and the visiting experience: as crowding grew, the cognitive and emotional perception of crowding was higher and more negative.
It was also hypothesized that integrating the two emotional measures would give us more information about the impact of crowding on the visiting experience, as the two complement each other. The objective approach makes it possible to measure emotional arousal in an unconscious manner with a fine-grain resolution in relation to time and space, yet it lacks valence; the subjective approach is conscious and biased, yet it sheds light on causality and valence. The study exposed new information about the issue due to its integrated methodology—including the idea that observation and expectation are factors that arouse high positive emotions within the visiting experience.
This research represents an attempt to examine visitors’ emotions in real time during the experience at a site and, more importantly, to investigate how the specific social-environmental feature of overcrowding affected emotional arousal, both reported and monitored. It is one of the first to employ a combination of self-reporting and physiological measurement to track the emotional effects of crowding on visitors’ experiences in urban consumption spaces.
Supplemental Material
sj-docx-1-jtr-10.1177_00472875241249385 – Supplemental material for Measurement of Visitors’ Subjective and Objective Emotional Response to Congestion in Public Spaces
Supplemental material, sj-docx-1-jtr-10.1177_00472875241249385 for Measurement of Visitors’ Subjective and Objective Emotional Response to Congestion in Public Spaces by Rotem Mashkov and Noam Shoval in Journal of Travel Research
Footnotes
Acknowledgements
The authors would like to express their sincere gratitude to the following individuals for their valuable contributions and support:
Mr. Brian Isaac Rizowy, The Technion—The Israel Institute of Technology, for practical training on iMotions software and support in data analysis.
Ms. Hagar Srulovitch, a Ph.D. student at The Hebrew University of Jerusalem, for her advice on experimental design and assistance with data collection.
Mr. Uriel Shavin, M.A. graduate from The Hebrew University of Jerusalem, for his assistance with data collection.
Declaration of Conflicting Interests
The author(s) declared no potential conflicts of interest with respect to the research, authorship, and/or publication of this article.
Funding
The author(s) disclosed receipt of the following financial support for the research, authorship, and/or publication of this article: This research was supported by the Israel Science Foundation (Grant No. 1593/20).
Supplemental Material
Supplemental material for this article is available online.
Author Biographies
References
Supplementary Material
Please find the following supplemental material available below.
For Open Access articles published under a Creative Commons License, all supplemental material carries the same license as the article it is associated with.
For non-Open Access articles published, all supplemental material carries a non-exclusive license, and permission requests for re-use of supplemental material or any part of supplemental material shall be sent directly to the copyright owner as specified in the copyright notice associated with the article.