
Abstract
This study investigates the evolution of a multi-destination tourism innovation network, focusing on the city destination as the unit of analysis. We analyzed a 21-year panel dataset of China’s Yangtze River Delta’s tourism innovation network. Results show that the network has evolved from simplicity and looseness to complexity and compactness. Geographical proximity, differences in tourism development foundations, research institutes, and research investments have a positive impact on network evolution, while economic and technological differences exert a negative influence, albeit with varying degrees of impact at different stages. Notably, the convergence of regional economies emerges as a critical driver of network connections. The study broadens the scope of tourism innovation research from a macro perspective. Findings suggest that developed cities should lead regional tourism innovation, promote openness, and engage with less-developed cities, while local governments within the network should support coordinated growth and invest in inter-city transportation and developing tourism resources.
Keywords
Introduction
Innovation is a key driver for improving the quality, efficiency, and sustainability of the tourism sector (Martínez-Román et al., 2015; Yang et al., 2023). Tourism innovation encompasses various new and effective ideas, products, services, technologies, processes, and activities that can improve the tourists’ experience, and the efficiency and competitiveness of the tourism industry (Hjalager, 2015; Zach & Hill, 2017). However, innovation activities in the tourism industry are complex due to risks and uncertainties (Williams et al., 2021). At the micro level, there are intricate ties between tourists and tourism enterprises, at the meso level between tourism industries, and at the macro level between tourism destinations (Hjalager, 2015; Zach & Hill, 2017). Challenges of innovation cannot be addressed by individual actors alone; they necessitate a multi-actor network that integrates both internal knowledge creation and external knowledge acquisition. This integration enables collaborative efforts in co-exploring and co-exploiting innovation opportunities, as suggested by the industrial districts theory (Marco-Lajara et al., 2022). Particularly, multi-destination tourism innovation networks offer the promise of overcoming resource limitations and leveraging internal and external resources for innovation (Lyu et al., 2019).
Multi-destination networks promote collaboration, innovation, and regional development, ensuring industry sustainability (Kofler et al., 2018). Through these cross-destination networks, technologically advanced destinations can serve as a source of inspiration and benefit the less-developed destinations by providing access to essential resources, knowledge, skills, and experience, and enabling them to promptly respond to market opportunities, breaking free from the constraints of the “low-end locking” phenomenon (Brandão et al., 2019). The existing literature on tourism innovation networks primarily focuses on the relationships between tourism enterprises and between tourism and other organizations (Kofler et al., 2018; Raisi et al., 2018). Most studies are limited to analyzing the development of tourism innovation alone (Sun et al., 2022), rather than the dynamic evolution of tourism innovation networks within a group of multiple destination cities. Research on cross-destination tourism innovation networks is still in its infancy (Makkonen et al., 2018), and there is a lack of understanding on how to unlock the potential of multi-destination tourism innovation networks.
This study endeavors to fill the gap in the literature by analyzing the development of a multi-destination tourism innovation network, specifically examining its evolutionary dynamics and the factors that influence its evolution. We aim to answer the following research questions: How has the cross-destination tourism innovation network evolved in time and space? What factors drive this evolution? The empirical context is the central area within the Yangtze River Delta city cluster (see Figure 1), characterized by highly comprehensive development, strong tourism growth, and a vibrant innovation environment. The study region includes Shanghai and 25 cities from three other provinces (Jiangsu, Zhejiang, and Anhui), totaling 26 cities. It plays a crucial role in China’s national modernization efforts and is a major focus of the Chinese government’s plans to establish it as a world-class urban agglomeration, fostering scientific and technological innovation with global impact.
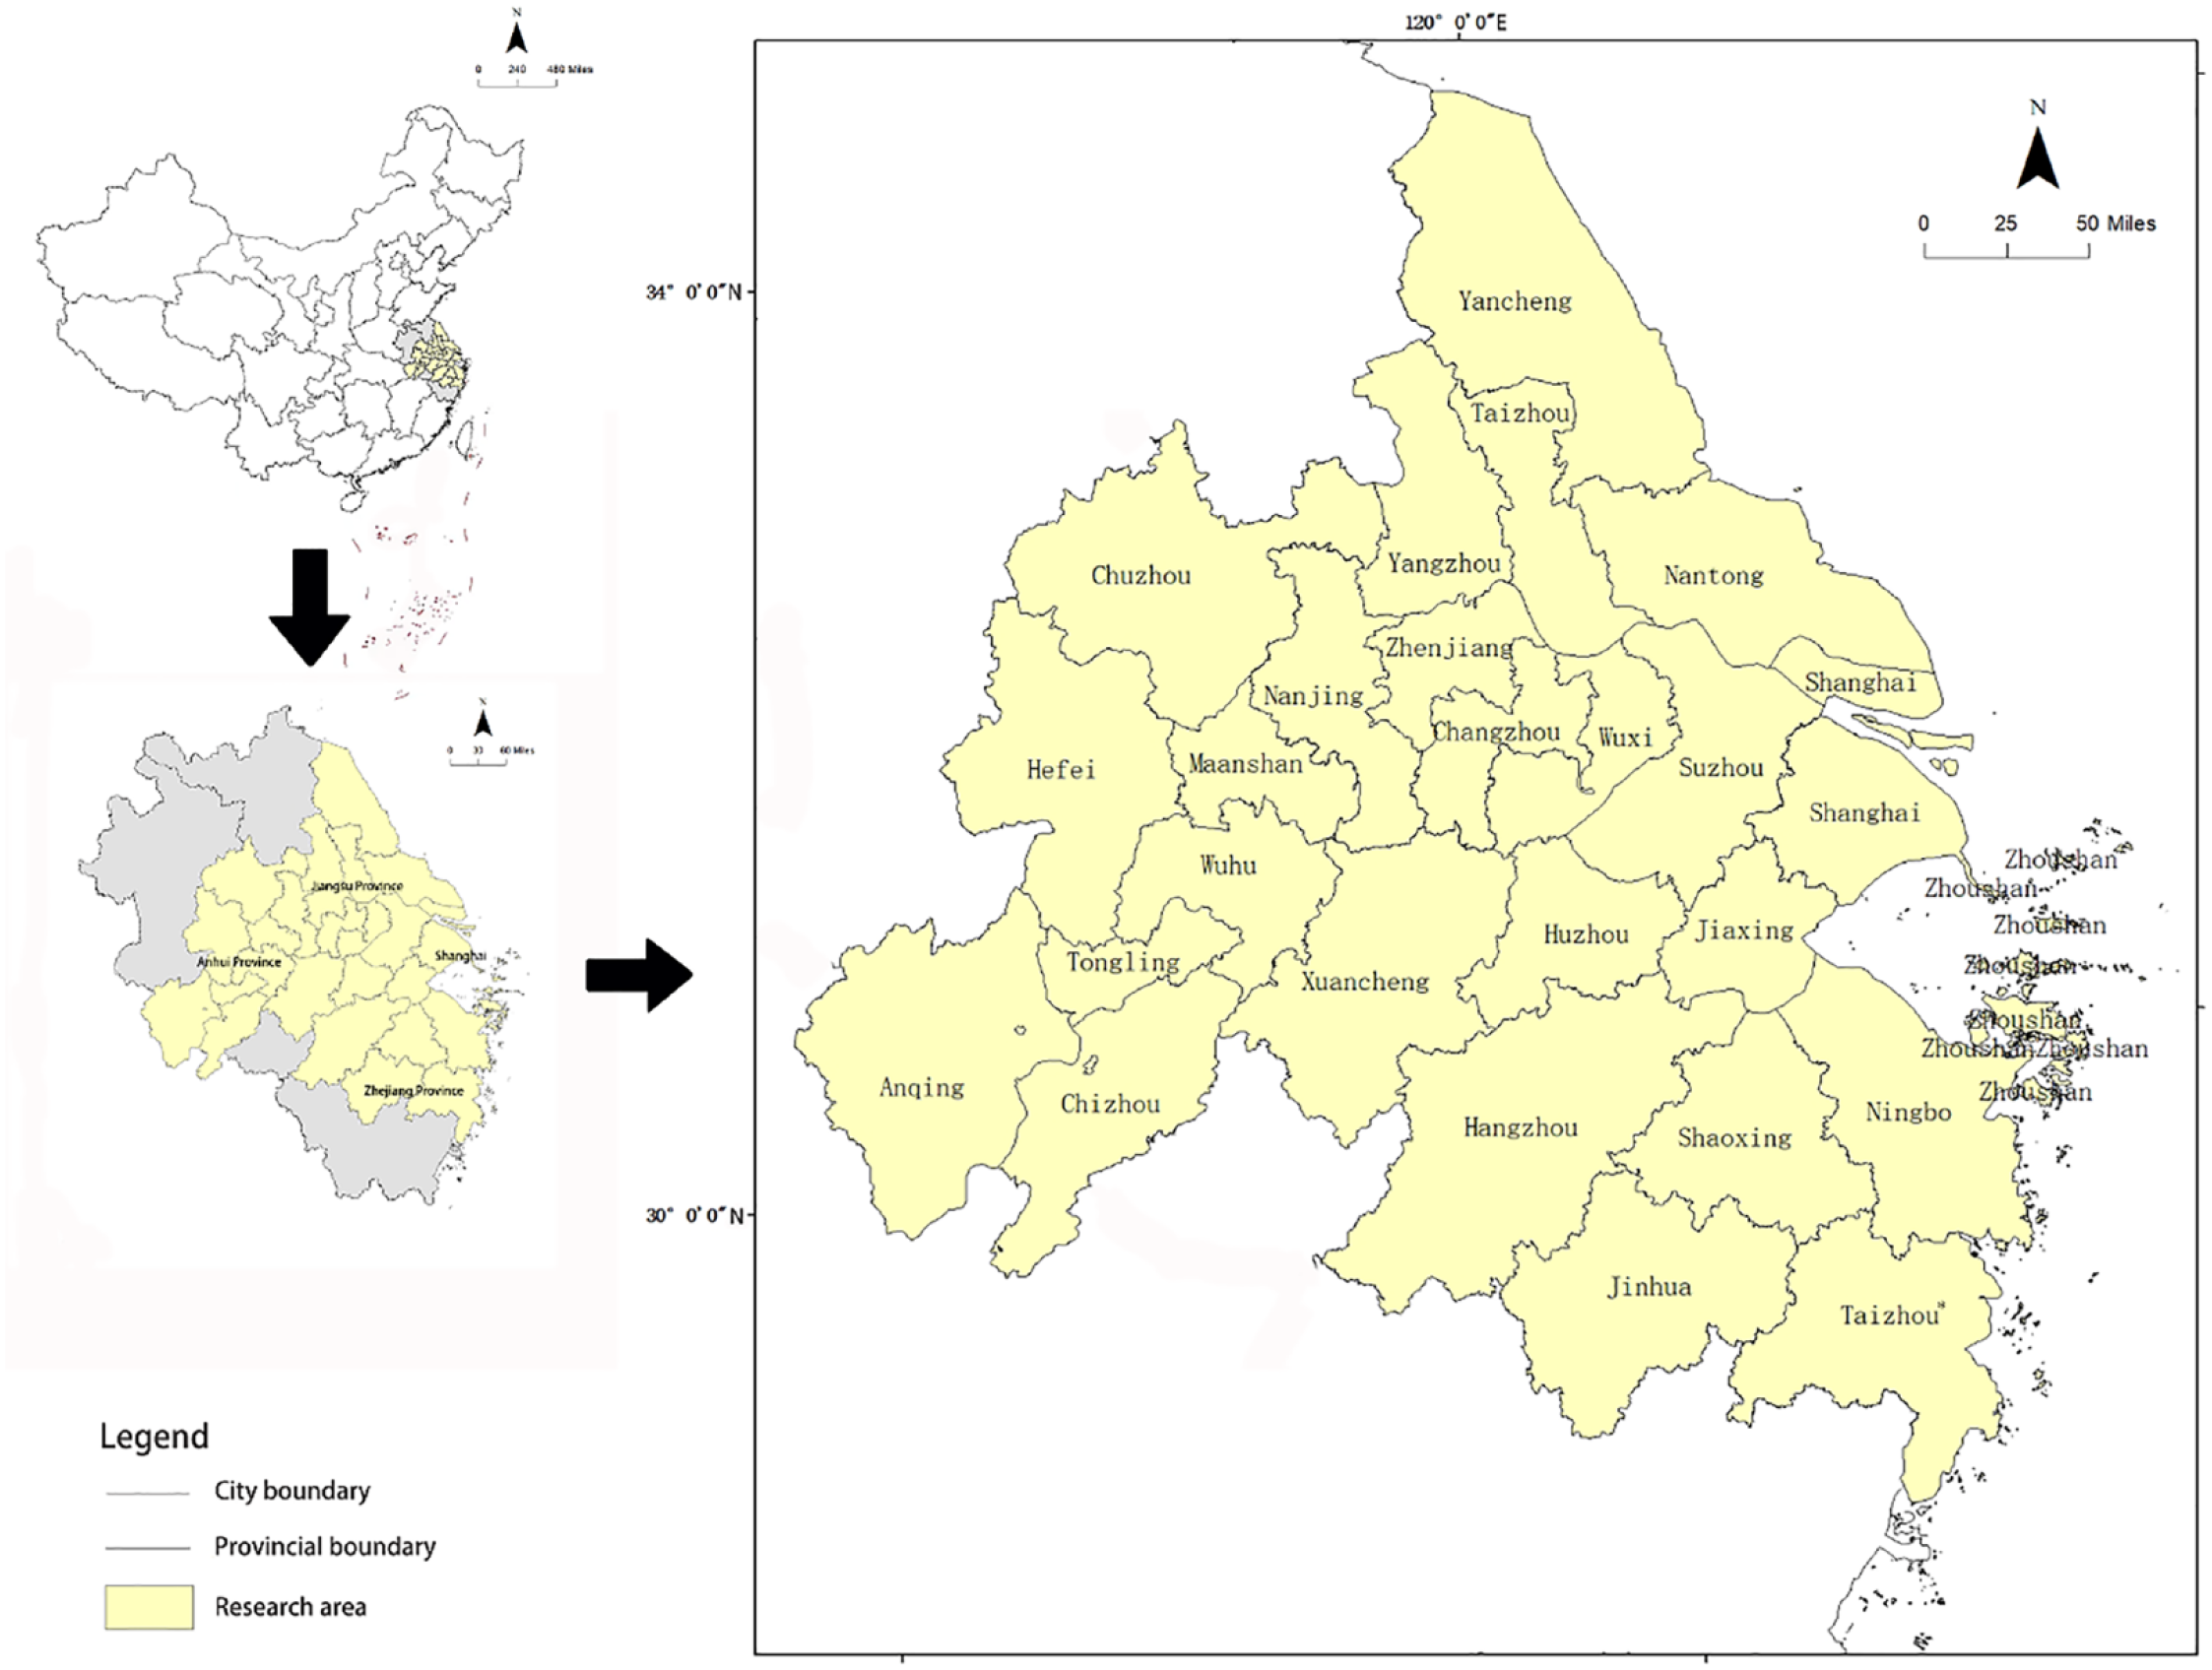
The location of the Yangtze River Delta urban agglomeration.
We collected 21-year panel data from multiple archival sources, combining tourism innovation data from an authoritative official website with relevant city-level social and economic statistics from various publicly available sources. Next, we use a modified gravity model to establish tourism innovation associations between cities, and use social network analysis, a method considered suitable for the analysis of tourism innovation network structure (Kofler et al., 2018), to characterize the positions and roles of different cities in the tourism innovation network. The evolution of the tourism innovation network of the region is examined through comparative analysis. Finally, the quadratic assignment procedure (QAP) method was used to explore the influence of relevant factors on the evolution of the network.
Our study offers distinctive contributions to the existing body of knowledge on tourism innovation networks in several notable ways. Primarily, we stand apart by adopting a macro perspective to investigate the characteristics and evolution of tourism innovation networks across diverse city destinations within a large urban agglomeration. This approach allows us to uncover insights that transcend the boundaries of individual destinations. Furthermore, we delve into the intriguing concept of a “low-end locking” phenomenon within the urban tourism innovation network. We investigate whether less developed city destinations can harness the benefits of this network and whether developed city destinations assume a radiating role, propelling innovation in other city destinations within the region. This aspect introduces a novel perspective to the literature on urban tourism innovation. Moreover, we embrace a dynamic evolutionary approach to our empirical study. Through this lens, we bring to light a holistic understanding of the driving and inhibiting factors that shape the formation of tourism innovation networks. This intricate analysis of the factors involved in network formation is an area that previous studies have not thoroughly addressed.
Literature Review
Innovation Network
Drawing on the social network theory, an innovation network can be conceptualized as a collection of multiple innovation actors, referred to as nodes, and their respective relationships, or ties, with one another (Kofler et al., 2018; Y. Liu et al., 2021). Participation in an innovation network provides actors with the opportunity to access valuable knowledge and ideas, potentially enhancing their ability to innovate, while simultaneously enabling them to swiftly identify appropriate innovation partners (Svare et al., 2020). As such, an innovation network can be regarded as a mechanism that facilitates technology transactions and supports learning and knowledge transfer, thereby minimizing the transaction costs that would otherwise arise from internalization (Wong, 2007).
Innovation networks are characterized by the interdependence of their actors, as their innovation behavior has external effects whose magnitude varies depending on their position in the network (Nepelski & De Prato, 2018). If an actor assumes the role of a hub node, it benefits from its well-connected position, allowing it to access superior resources and opportunities resulting from the high level of information and ideas interact with other actors (Nepelski & De Prato, 2018; Piazza et al., 2019). The hub actor’s connection strength and quality with other actors are typically critical factors influencing the stability and resilience of the entire network structure (Nepelski & De Prato, 2018). For instance, in an innovation network composed of companies, hub companies coordinate network activities to generate and extract value, eventually forming a loosely coupled system of autonomous firms (Dhanaraj & Parkhe, 2006). Similarly, in an innovation network made up of countries, a nation’s network position impacts the creation and strength of innovation linkages with other countries in the network (Nepelski & De Prato, 2018).
A tourism innovation network is formed by actors such as tourism organizations or tourism destinations. Tourism destinations are a prominent form of tourism and hospitality networks (Kofler et al., 2018). The theory of tourism districts highlights that the tourism industry is intricate and interdependent, comprised of numerous organizations that engage in both cooperative and competitive interactions (Marco-Lajara et al., 2022). This perspective characterizes the tourism industry as a “networked industry,” encompassing a web of organizations that collaborate and compete to deliver services, typically within a specific destination (Kofler et al., 2018; Marco-Lajara et al., 2022).
Scholars have conducted in-depth research to understand the structure, characteristics, and functions of the internal innovation network of tourism enterprises in a specific region. For example, Booyens and Rogerson (2017) conducted a study in the Western Cape Province of South Africa and found that the innovation network of tourism enterprises in the region had intensive but loose structural characteristics and that external and non-local knowledge was important for promoting innovation. Zach and Hill (2017) explored the position and role of tourism enterprises in the network and provided insights for tourism enterprises to choose innovation partners. However, there is a lack of comprehensive studies that address the dynamic evolution of tourism innovation networks across multiple destination cities.
Factor Influencing the Dynamics of Tourism Innovation Network
The theory of regional innovation systems posits that the development of innovation networks is influenced by various regional factors (Alberti et al., 2021; Blundel, 2006; Martin & Rypestøl, 2018), including the regional industrial structure and institutional and organizational environment (Plechero et al., 2021). The differences or proximity of economic, cognitive, organizational, social, institutional, scientific, cultural, and geographical factors also play a significant role in the evolution of innovation in regional innovation systems (Y. Li & Luo, 2021; Taalbi, 2020).
Scholars have found that certain proximities, such as those of institutions, individuals, society, and economic and scientific development levels, are conducive to knowledge exchange, cooperation, and communication in innovation networks (Y. Li & Luo, 2021). The importance of proximity varies depending on the stage of network formation, with institutional, individual, and social proximities being more critical in the early stages and temporal, geographical, and cognitive proximities becoming more important in the integration stage (Broekel et al., 2021). However, the relationship between regional factors and innovation networks is not always straightforward, and the impact of regional differences or proximity on the evolution of tourism innovation networks is a topic of ongoing debate among scholars (Favre-Bonte et al., 2019; Nepelski & De Prato, 2018).
Geographical Proximity
The first law of geography states that geographical distance is a significant factor that affects regional spatial association (Miller, 2004). Geographic proximity plays a role in promoting regional innovation cooperation and subsequently influencing the formation of innovation networks (Y. Li & Luo, 2021). The scope of geography also impacts the evolution of tourism innovation networks, with tourism actors more inclined to collaborate within their immediate geographical vicinity, leading to a cohesive innovation network within the targeted region (Kofler et al., 2018). However, several scholars argue against the importance of geographical proximity, citing the theory of the “death of distance” proposed by Cairncross (1997), which suggests that information technology has made geographical distance irrelevant to regional innovation cooperation. The development of modern transportation and communication technologies has reduced the cost of face-to-face communication, facilitated the sharing of tacit knowledge, and challenged the constraint of geographical distance on regional innovation cooperation (Sole & Edmondson, 2002; Yin et al., 2019).
Economic Differences
Economic proximity often serves as a catalyst for the establishment of partnerships, that is, when economic disparities are minimal, the formation of innovation partnerships is more likely to occur, whereas significant economic differences may hinder such collaborations (Y. Liu et al., 2021). Economic strength, as a critical factor in the formation of innovation networks, determines the position and influence of each actor in the network, thereby shaping different innovation environments and resource allocations. For instance, actors with robust economic strength may be situated at the core of the innovation network, while members with weaker economic power may occupy peripheral positions (Nepelski & De Prato, 2018). Consequently, economic differences among network members may influence interaction, cooperation, and the direction of the innovation network’s goals and actions (Y. Liu et al., 2021).
Differences in Scientific Inputs and Outputs
Science and innovation are closely intertwined (Hwang, 2023). According to the input-output theory, disparities in scientific inputs and outputs may influence the dynamics of innovation networks (Y. Li & Luo, 2021). Regarding scientific inputs, the number, geographical distribution, and size of research and development (R&D) institutions across various regions and industries can impact the density and frequency of innovation activities, thereby influencing the establishment and operation of innovation networks (D. Li et al., 2015). In addition, the difference in R&D investment is a crucial factor affecting the formation of innovation networks. High levels of R&D investment are likely to draw in more innovators and R&D institutions, providing innovation networks with a broad spectrum of resources, facilitating technological progress and swift dissemination and implementation of innovation outcomes, and strengthening the capacity and influence of innovation networks (Min et al., 2020).
In terms of scientific output, technology proximity or variability can also impact the formation of innovation networks. Low technological differentiation or high proximity implies that members of an innovation network possess a sufficiently similar knowledge base to identify opportunities for collaboration provided by other participants (Colombo, 2003). This can facilitate the sharing of technological experience and knowledge base, promote technological learning and anticipation of technological development (Knoben & Oerlemans, 2006), and apply to tourism innovation networks as well (Makkonen et al., 2018). However, innovation networks require a sufficient degree of knowledge differentiation to enable members to use new knowledge effectively and creatively (Colombo, 2003), avoid limiting learning opportunities, and encourage further innovation network changes (Makkonen et al., 2018). High differences in skill levels or low proximity may pose a barrier to collaboration, limiting the prospect of building synergies across borders and necessitating greater communication and coordination to facilitate the formation of innovation networks (Makkonen et al., 2018; Sole & Edmondson, 2002).
Differences in the Foundation of Tourism Development
Regional industrial development status and its resource differences can have an important impact on innovation networks. Firstly, the level of industrial development is closely linked to the level of industrial technology application, which has an effect on the intensity of industrial innovation activities and the pattern and degree of cooperation among innovation agents (E. Li et al., 2018). Specifically in the tourism industry, a high level of tourism development implies a high level of tourism mobility in the region, which can facilitate mutual imitation and diffusion of tourism innovations between regions (Weidenfeld, 2013), resulting in innovation network linkages. Secondly, human capital, like technological capabilities, is a crucial factor in facilitating cross-border knowledge and innovation transfer (R. Thomas & Wood, 2014, 2015). Destinations lacking a high level of technological capabilities and human capital have difficulty acquiring, transforming, and absorptive capacity, and are thus unable to form innovation network linkages with the outside world (Makkonen et al., 2018; Weidenfeld, 2013).
Furthermore, resource endowments may influence the economic structure and industrial composition of a region, which, in turn, impacts the composition and development of innovation networks (X. Wang et al., 2023). As an industry with pronounced geographical dependencies (Kofler et al., 2018), tourism patterns and innovations in tourism destinations rely heavily on tourism resource endowments. Differences or similarities in tourism resources between regions play a role in knowledge and innovation transfer, and similarities in tourism resources between adjacent border regions may enhance regional-level knowledge transfer (Weidenfeld, 2013). However, some tourism resources are distinctly regional and cultural, and cross-border knowledge transfer and innovation cooperation can be driven by cultural differences (Makkonen et al., 2018). Overall, the foundation for the tourism industry’s development, including elements like the local tourism economy, tourism education, and tourism resource endowment, may drive the exchange of innovations between destinations in the innovation network.
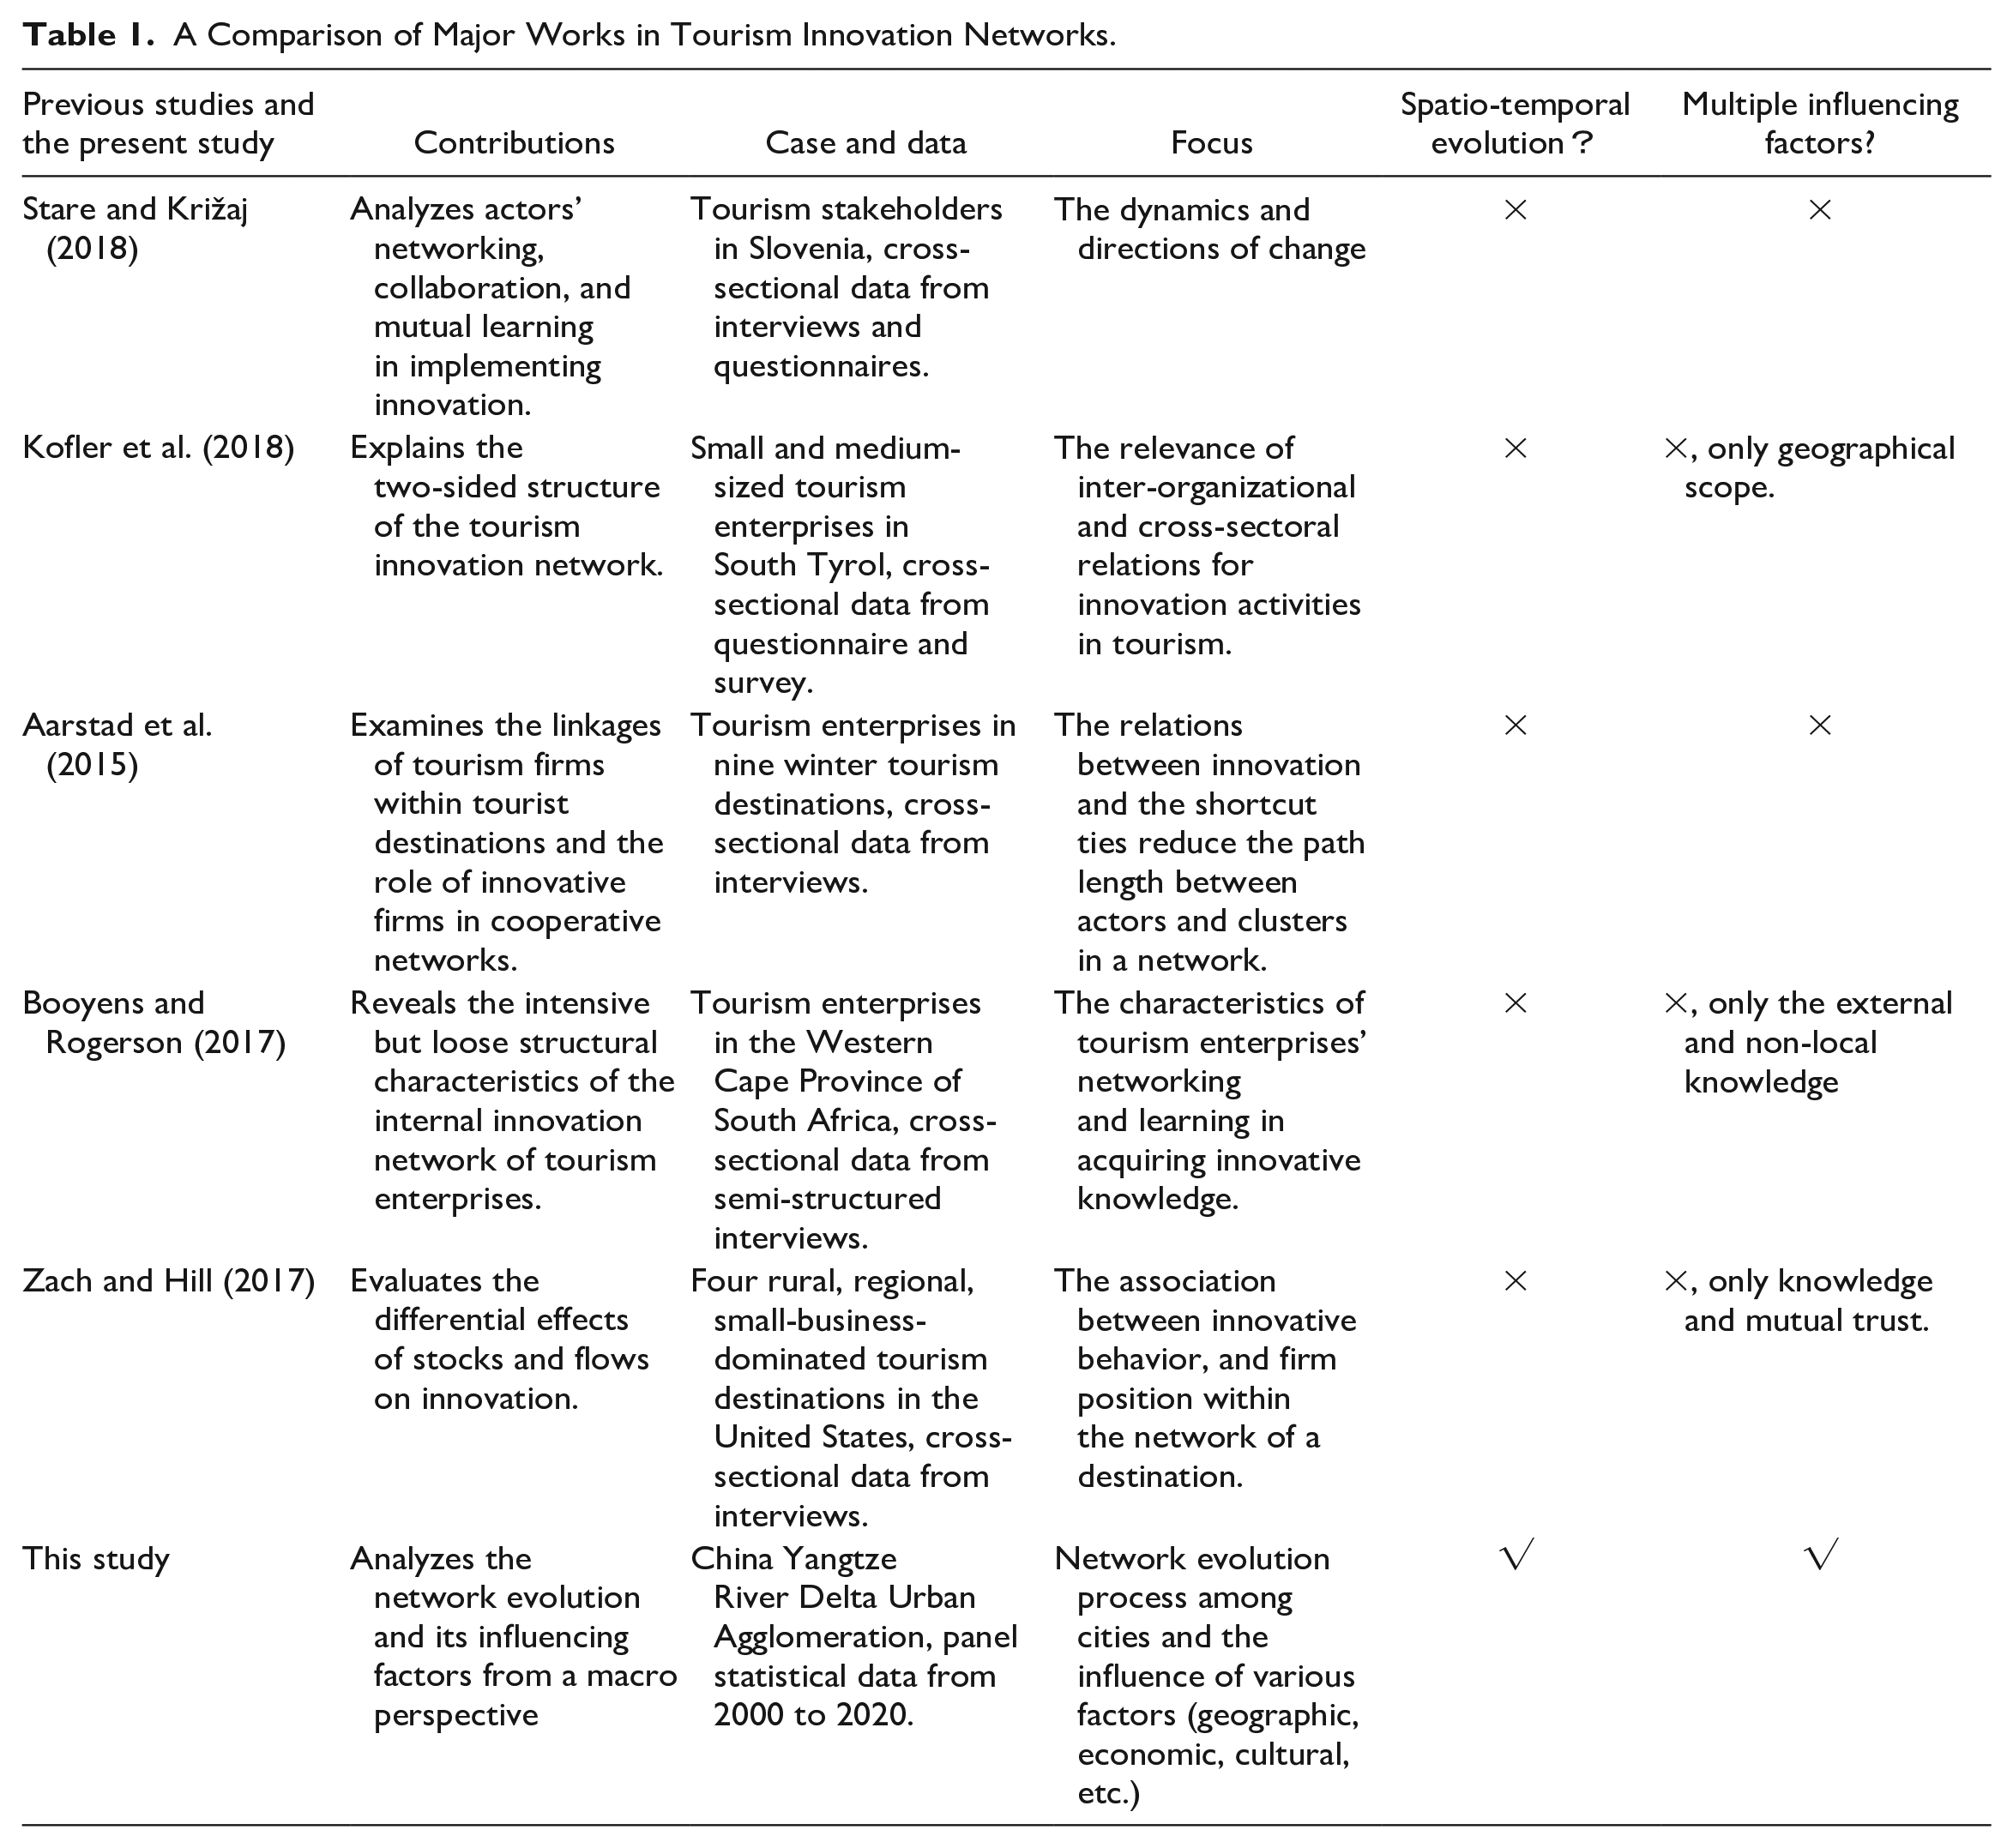
In summary, tourism innovation networks are driven by a complex set of factors. The existing literature has primarily focused on the development of tourism innovation, with only a few studies exploring the factors driving the evolution of tourism innovation networks (summarized in Table 1). Other studies have highlighted the importance of external knowledge (Booyens & Rogerson, 2017), knowledge redundancy and trust (Zach & Hill, 2017), and knowledge transfer between regions (Brandão et al., 2019). However, there appears to be a dearth of research into the dynamics and drivers of cross-destination tourism innovation networks.
A Comparison of Major Works in Tourism Innovation Networks.
Methodology
Measure of Tourism Innovation
This study measures tourism innovation by selecting the average number of tourism invention patents every 5 years from 2000 to 2020 in each city within the study region. Tourism invention patents are chosen as the measurement because they are widely accepted as a common indicator for innovation (Lelo de Larrea et al., 2021). Unlike complex multi-dimensional indicators, invention patent data offers simplicity, and strong year-to-year comparability, continuity, and completeness. Furthermore, tourism invention patents encompass various forms of innovation, including products, services, technology, management, and more, making it useful for understanding the influence and mechanisms of various factors on tourism innovation.
We divided the years 2000 to 2020 into four periods: 2000 to 2005, 2006 to 2010, 2011 to 2015, and 2016 to 2020. In these periods, we calculated the average tourism invention patent values for each city over 5 years (except for 2000–2005, which covered 6 years). This method helps address potential data anomalies due to missing tourism patents in earlier years, accounts for analytical biases from patent lag, and aligns with China’s five-year development plans (10th, 11th, 12th, and 13th). Calculating these five-year averages allows for a more comprehensive analysis of long-term tourism innovation trends.
Measures of Tourism Innovation Network
The universal gravitational formula of Newton’s classical mechanics in physics,
Within the framework of the gravity model, the careful selection of parameters—mass, distance, and gravitational coefficient—is critical. To enhance analytical accuracy, prior research has introduced various modifications to the gravity model. These adaptations encompass several key aspects. Firstly, adjustments to the mass parameter M have been employed. Researchers often transform Mi/Mj into the square root of the product of region-specific variables. For instance, in the study by M. Han et al. (2021), Mi×Mj is expressed as
Secondly, modifications have been made to the squared distance parameter Dij. Following Newton’s original gravity model, the strength of innovation associations between regions tends to diminish as spatial distance increases (M. Han et al., 2021). As research advances, scholars have suggested that beyond spatial distance, economic distance also influences the strength of affinity between regions (Zhao et al., 2021). Consequently, the squared Dij is often reformulated as
Thirdly, refinements have been applied to the gravitational parameter K. Traditionally treated as a constant in the model, K fails to account for the specificities and directionalities of information correlations between regions. Adjustments have introduced K as kij, treating it as the ratio of a region’s specific information to the sum of that information for two regions (e.g., Fan & Xiao, 2021; Z. Wang et al., 2020).
Building upon the foundational structure of the gravity model and the aforementioned modifications, we have adapted the traditional gravity model to align with the characteristics of tourism innovation and our research needs. The revised gravity model is as follows:
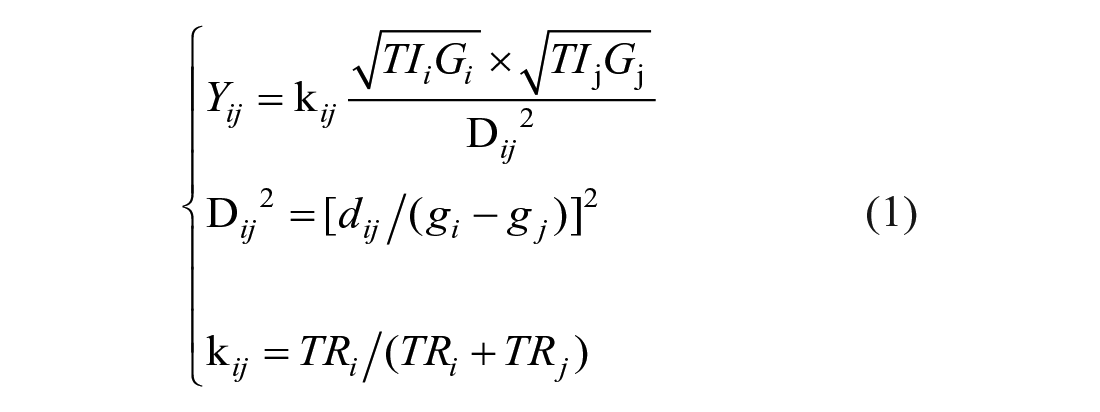
Where, Yij is the tourism innovation attraction between city i and city j. Inspired by the research of Fan and Xiao (2021), the tourism innovation levels of cities i and j, denoted as TIi and TIj, measured by the number of tourism invention patents, should serve as the primary indicators for gaging the “quality” of tourism innovation. Gi and Gj, representing the GDP of cities i and j, are commonly integrated into analyses of various city associations, representing the economic strength to support tourism innovation. Hence, we quantify M by taking the square root of the product of tourism innovation levels (TI) and GDP (G), resulting in Mi × Mj =
According to A. C. Thomas and Blitzstein (2011), binary classification is a widely used technique for analyzing connections between entities in a network. It offers advantages like easy data input, graphical visualization, and highlighting sparse network structures. However, selecting an appropriate threshold is crucial (Z. Wang et al., 2020). Prior studies have commonly used binary classification to convert attraction values into a relationship matrix (e.g., Fan & Xiao, 2021; S. Liu & Xiao, 2021; Z. Wang et al., 2020). To account for potential changes in the network structure, the average of each row is often used as the threshold. In line with this approach, we adopt binary classification and follow these steps to transform attraction values calculated using Formula (1) into a relationship matrix. First, create a gravitational value matrix of tourism innovation attraction between cities. Second, calculate the average value of each row of the gravitational value matrix, and use it as a benchmark. If the gravitational value in a row is higher than the benchmark, assign it a value of 1 to indicate a relationship between tourism innovation in the row (city i) and the column (city j). Otherwise, assign a value of 0 to indicate no relationship. Finally, form a “0-1” relationship matrix, which represents a complete spatial network of tourism innovation in the study region.
Measure of the Tourism Innovation Network’s Characteristics
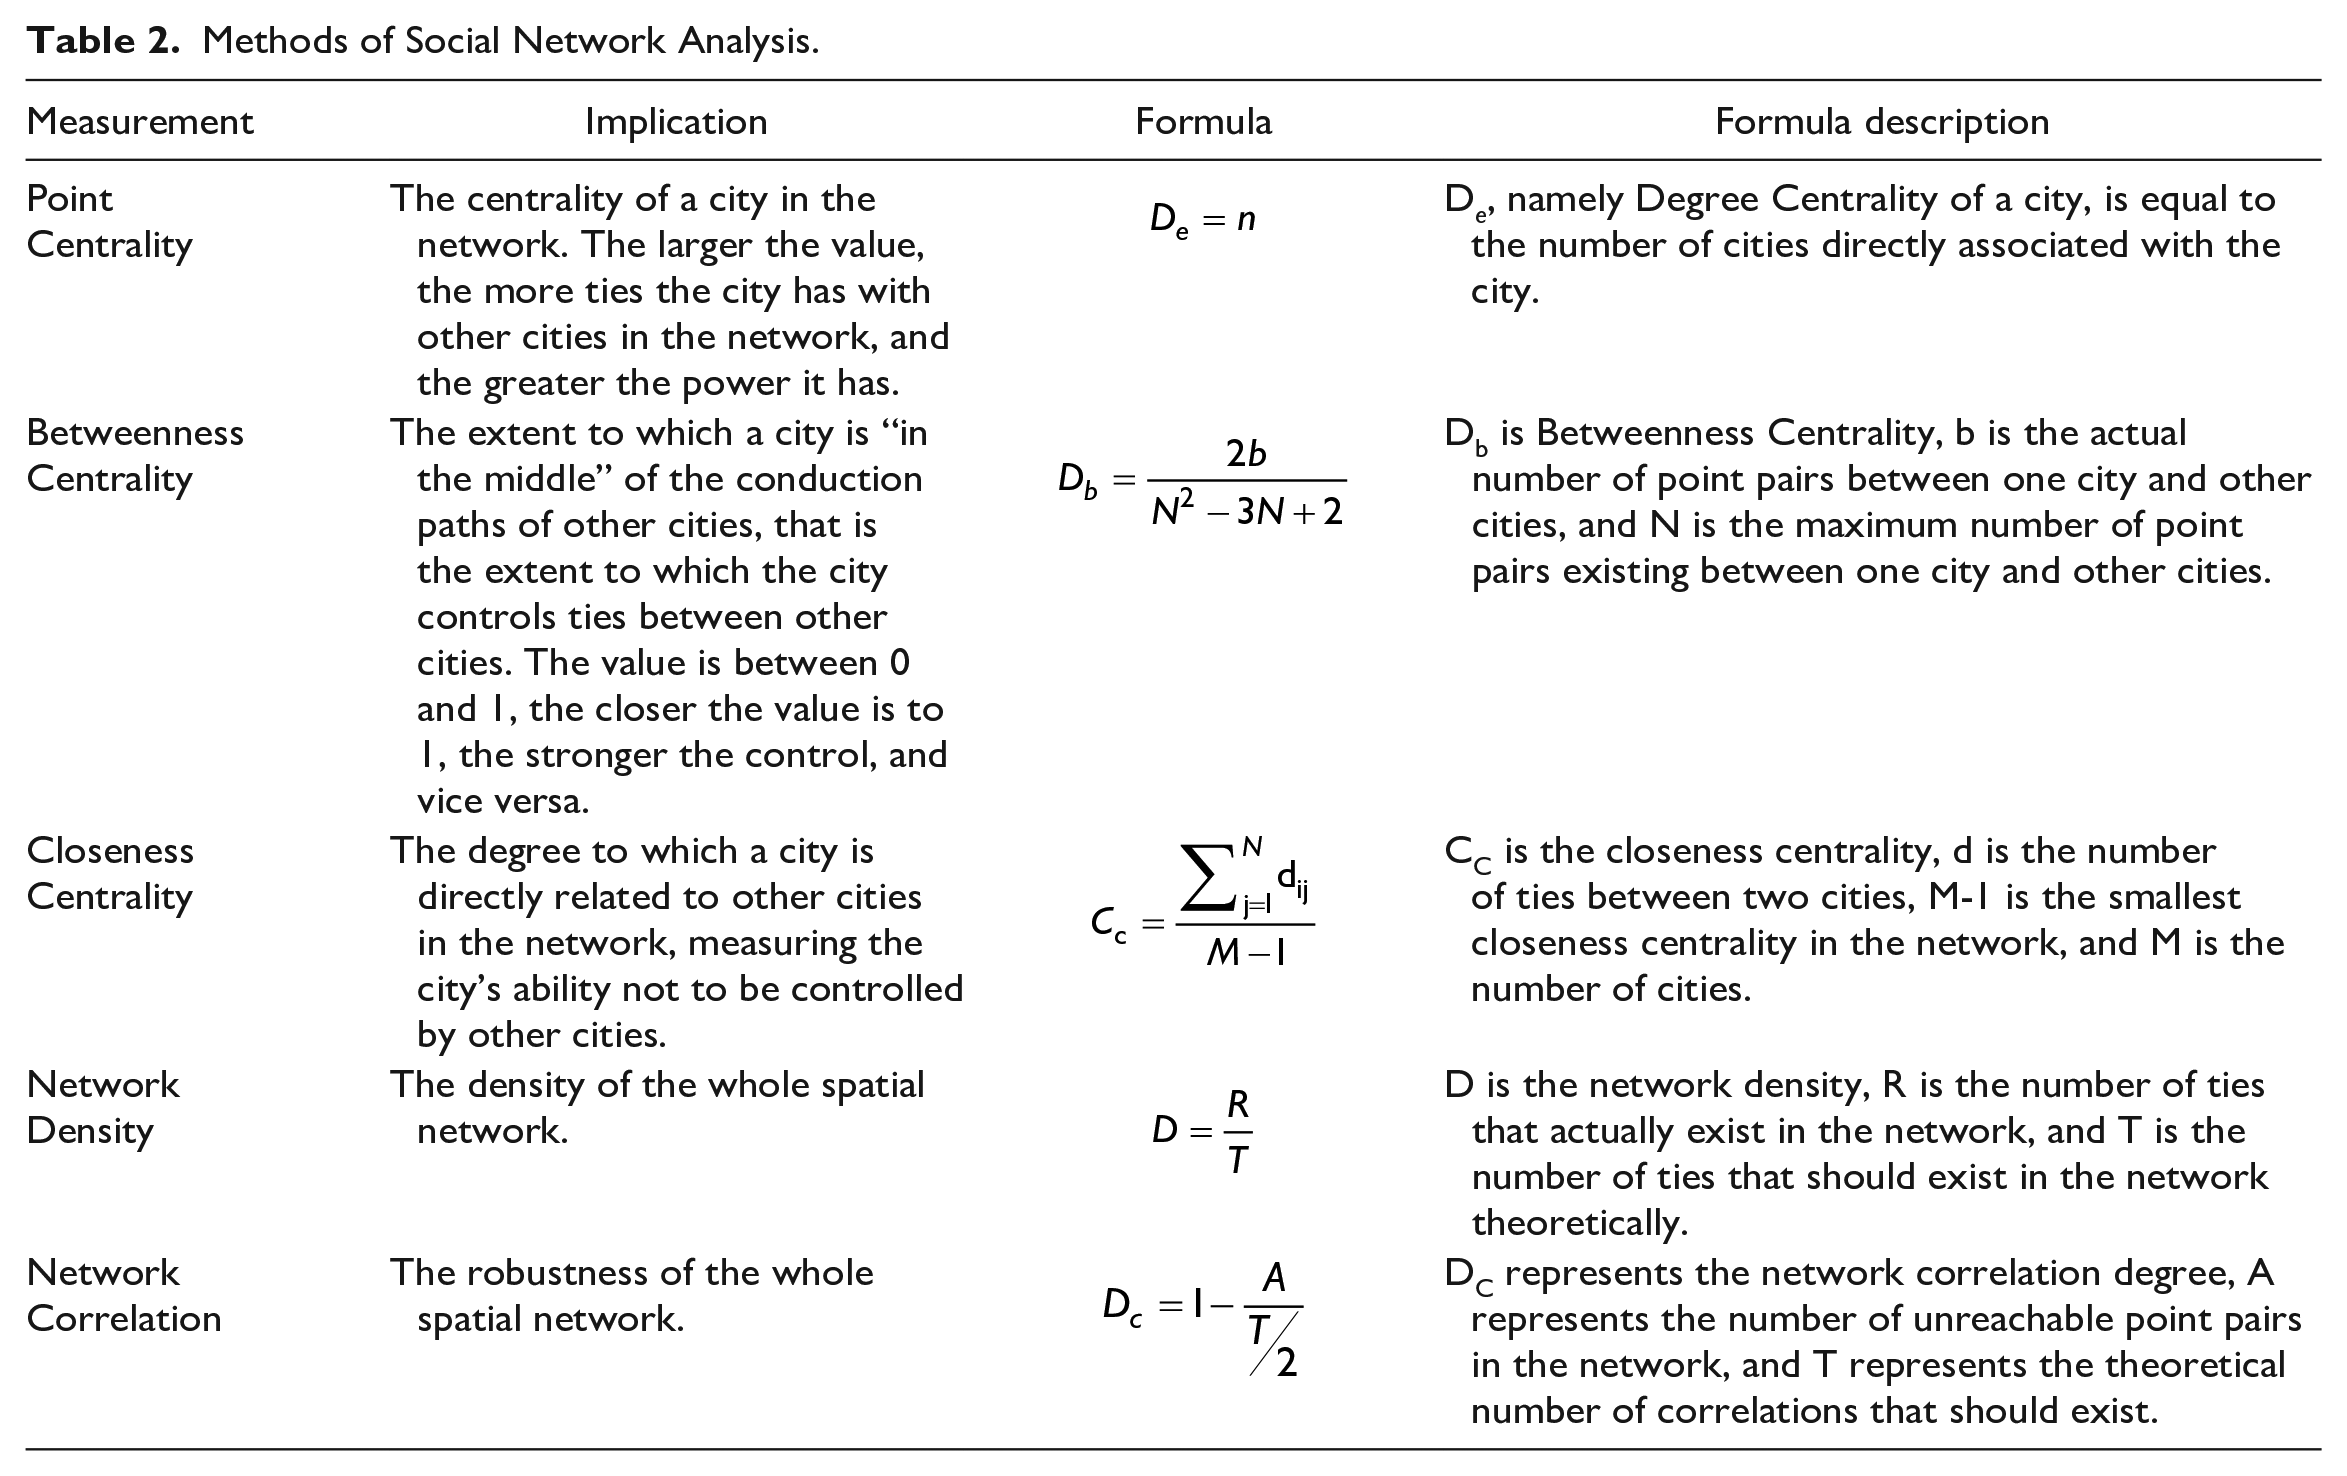
We applied social network analysis to the structural characteristics of ego-networks and whole networks of tourism innovation. Network Density and Network Correlation are used to measure the structural characteristics of the whole network. They can clarify the overall situation of the tourism innovation network. Point Centrality, Betweenness Centrality, and Closeness Centrality are used to measure the structural characteristics of the ego-networks. Centrality can quantify the position, power, and role of each city in the tourism innovation network. All formulas are listed in Table 2.
Methods of Social Network Analysis.
Factors Driving the Evolution of the Tourism Innovation Network
We adopted the QAP method to study the driving factors of the tourism innovation network and to further reveal the formation mechanism of the tourism innovation correlation between cities. The QAP has advantages in studying factors influencing a network. Because it takes relational data as the research object, has no strict requirements on the independence of variables, and can get more robust regression results than conventional methods (Simpson, 2001).
A tourism innovation network is influenced by various factors. This study focuses on specific factors (X1 and X2) outlined in Table 3, following insights from Teixeira and Ferreira (2018). They emphasize the importance of geographic proximity (X1) and economic divergence (X2) in innovation relationships. Kofler et al. (2018) support this, indicating that close geographic proximity fosters innovation exchange in tourism networks, but recent advances in transportation technologies may weaken the impact of geographic distance (Cairncross, 1997). While economic disparities can also hinder innovation network development (Y. Liu et al., 2021), urban clusters promoting collaboration may help reduce economic gaps and enhance tourism innovation network growth.
Factors Influencing the Evolution of an Innovation Network.
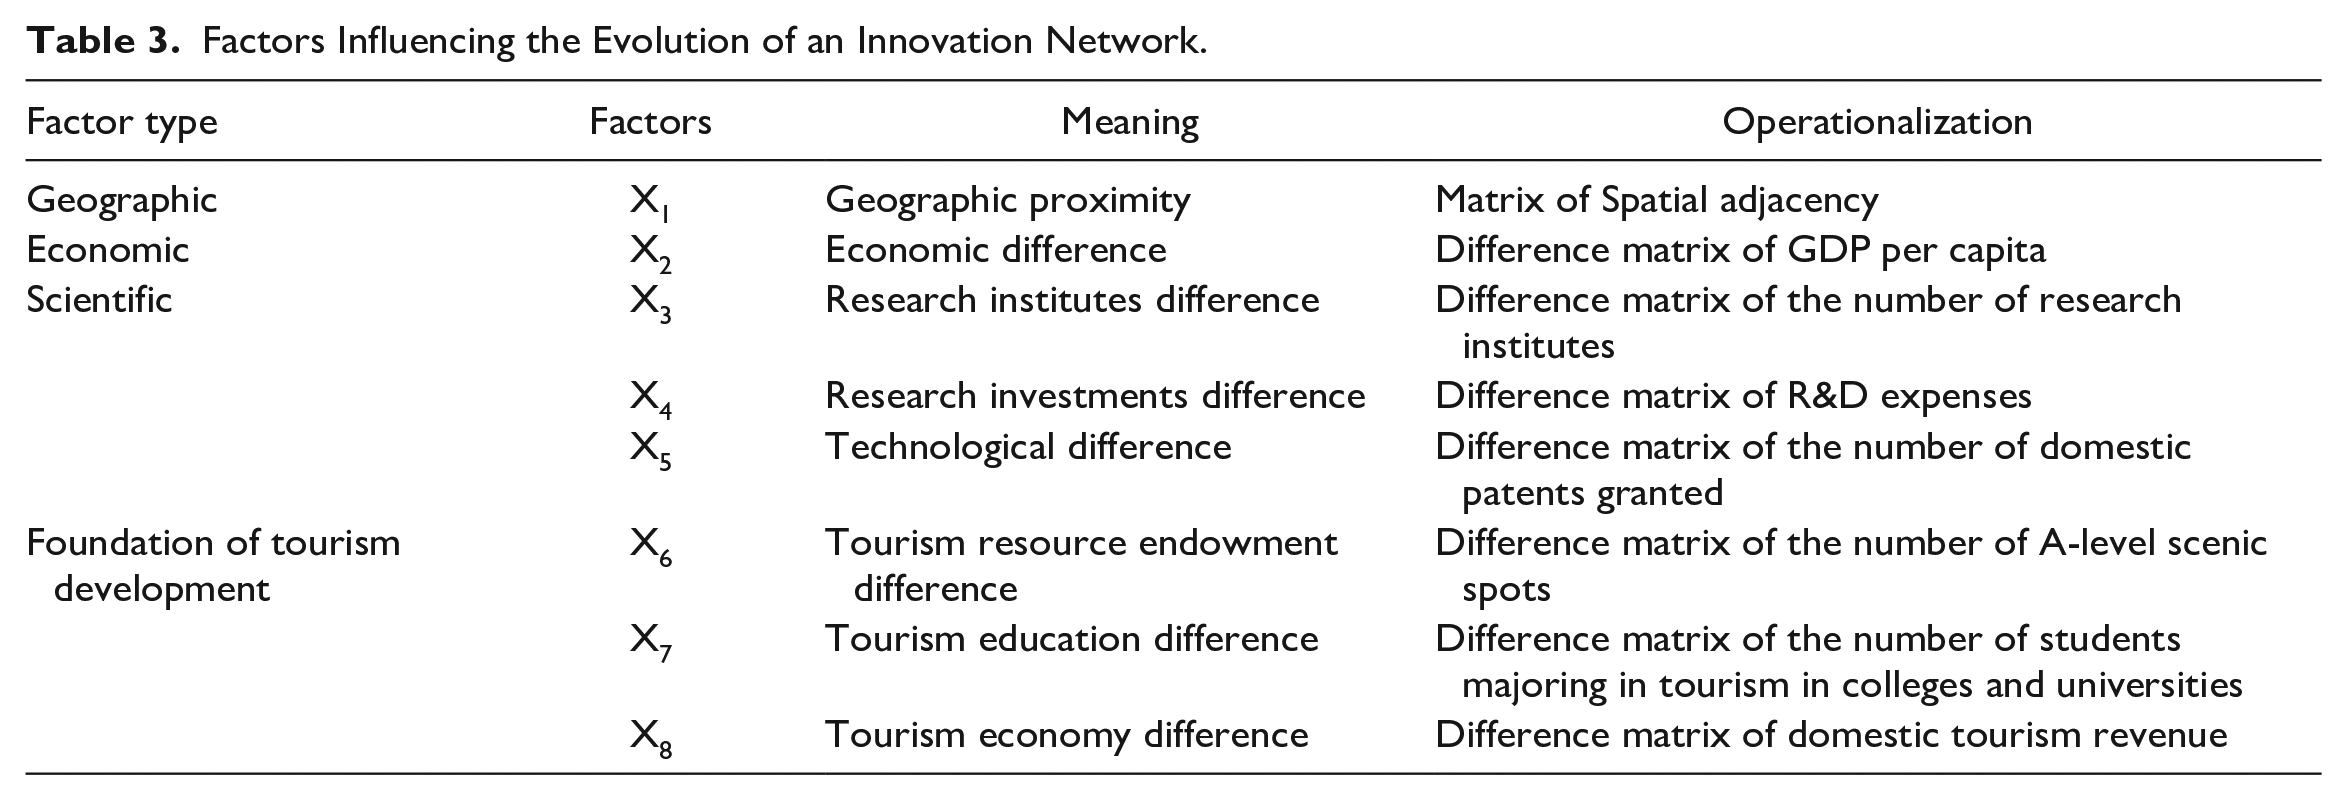
Based on Zhu et al. (2021), we incorporate scientific differences including research institute differences (X3), research investment differences (X4), and technical differences (X5), into our model. These aspects, essential to tourism technological innovation (Hwang, 2023; Y. Liu et al., 2021), generally foster innovation connections and network evolution. Nonetheless, the extent of their impact fluctuates based on developmental stages and governmental support.
Drawing insights from Zhu et al. (2021) and Gan et al. (2021), we propose that differences in the foundation of tourism development such as tourism resource endowment difference (X6), tourism education difference (X7), and tourism economic difference (X8) significantly influence the evolution of urban tourism innovation networks. These factors shape the dynamics of innovation connections and network evolution by impacting industry development, resource availability, culture, and human capital (E. Li et al., 2018; Makkonen et al., 2018; X. Wang et al., 2023; Weidenfeld, 2013). Regional disparities in spatial mobility and industry development often drive the formation of tourism innovation networks, with larger gaps in these factors promoting stronger connections. However, the extent of their impact varies depending on the stage of development. Therefore, the QAP model (Formula 2) of the tourism innovation network is as follows.

Where, S stands for the spatial network association matrix of tourism innovation, while X represents the matrix depicting variations in the diverse influencing factors, each of which is defined in Table 3. Then, the following QAP weighted network regression equation (Formula 3) is obtained:
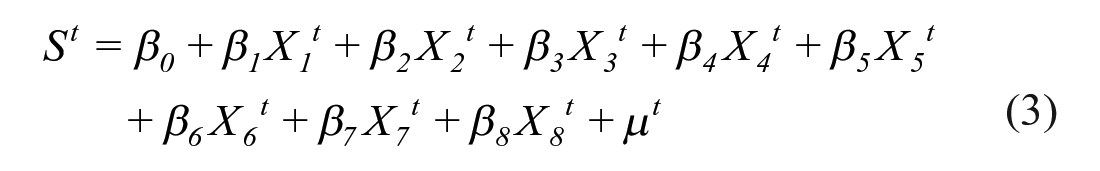
In this context, t denotes time; β stands for the regression coefficient, and when β is statistically significant, it indicates that the corresponding factor has an impact on the tourism innovation network, with its positive or negative sign indicating whether the effect is positive or negative; u represents the error term; the meanings of other variables are the same as in Formula 2.
Data
We collected tourism invention patent data from the “China Patent Publication Announcement” website (http://epub.cnipa.gov.cn/) on January 23, 2021, using keywords like “tourism,” “scenic spot,” “hotel,” and “travel.” With Python technology, we crawled 2,317 original tourism invention patents spanning from September 1, 1985, to January 23, 2021. After manually deduplicating the data, we retained 871 tourism invention patents from January 1, 2000, to December 2020, covering 26 cities in our study region. These patents encompass a wide range of types, including products, services, technology, management, and more. We then aggregated the tourism patent data for each city by year and calculated the average patent count for each city across four time periods. This data forms the foundation for measuring tourism innovation and constructing the tourism innovation network matrix.
As for the original data of the remaining variables in the tourism innovation gravity model the spatial distance (dij) between cities is calculated by Google Maps, the GDP (G) and per capita GDP (g), and the total tourism revenue (TR) data are from the 2001 to 2021 statistical yearbooks and their copies, and the tourism statistical bulletins. In line with the approach used for measuring tourism innovation, we adopted a five-year average to measure these variables.
In the QAP model, we create difference matrices for all factors, except for spatial adjacency matrices, by calculating the absolute differences in corresponding indicators. These differences are computed as averages over five-year intervals from 2000 to 2020. Geographic proximity is determined by the spatial adjacency of cities, extracted from administrative maps of the study region in the original data sources. Economic disparity data, based on per capita GDP, and technological disparity data, including the number of research institutions, R&D investment, and the number of domestic patents granted, are obtained from provincial statistical yearbooks covering the period from 2001 to 2021.
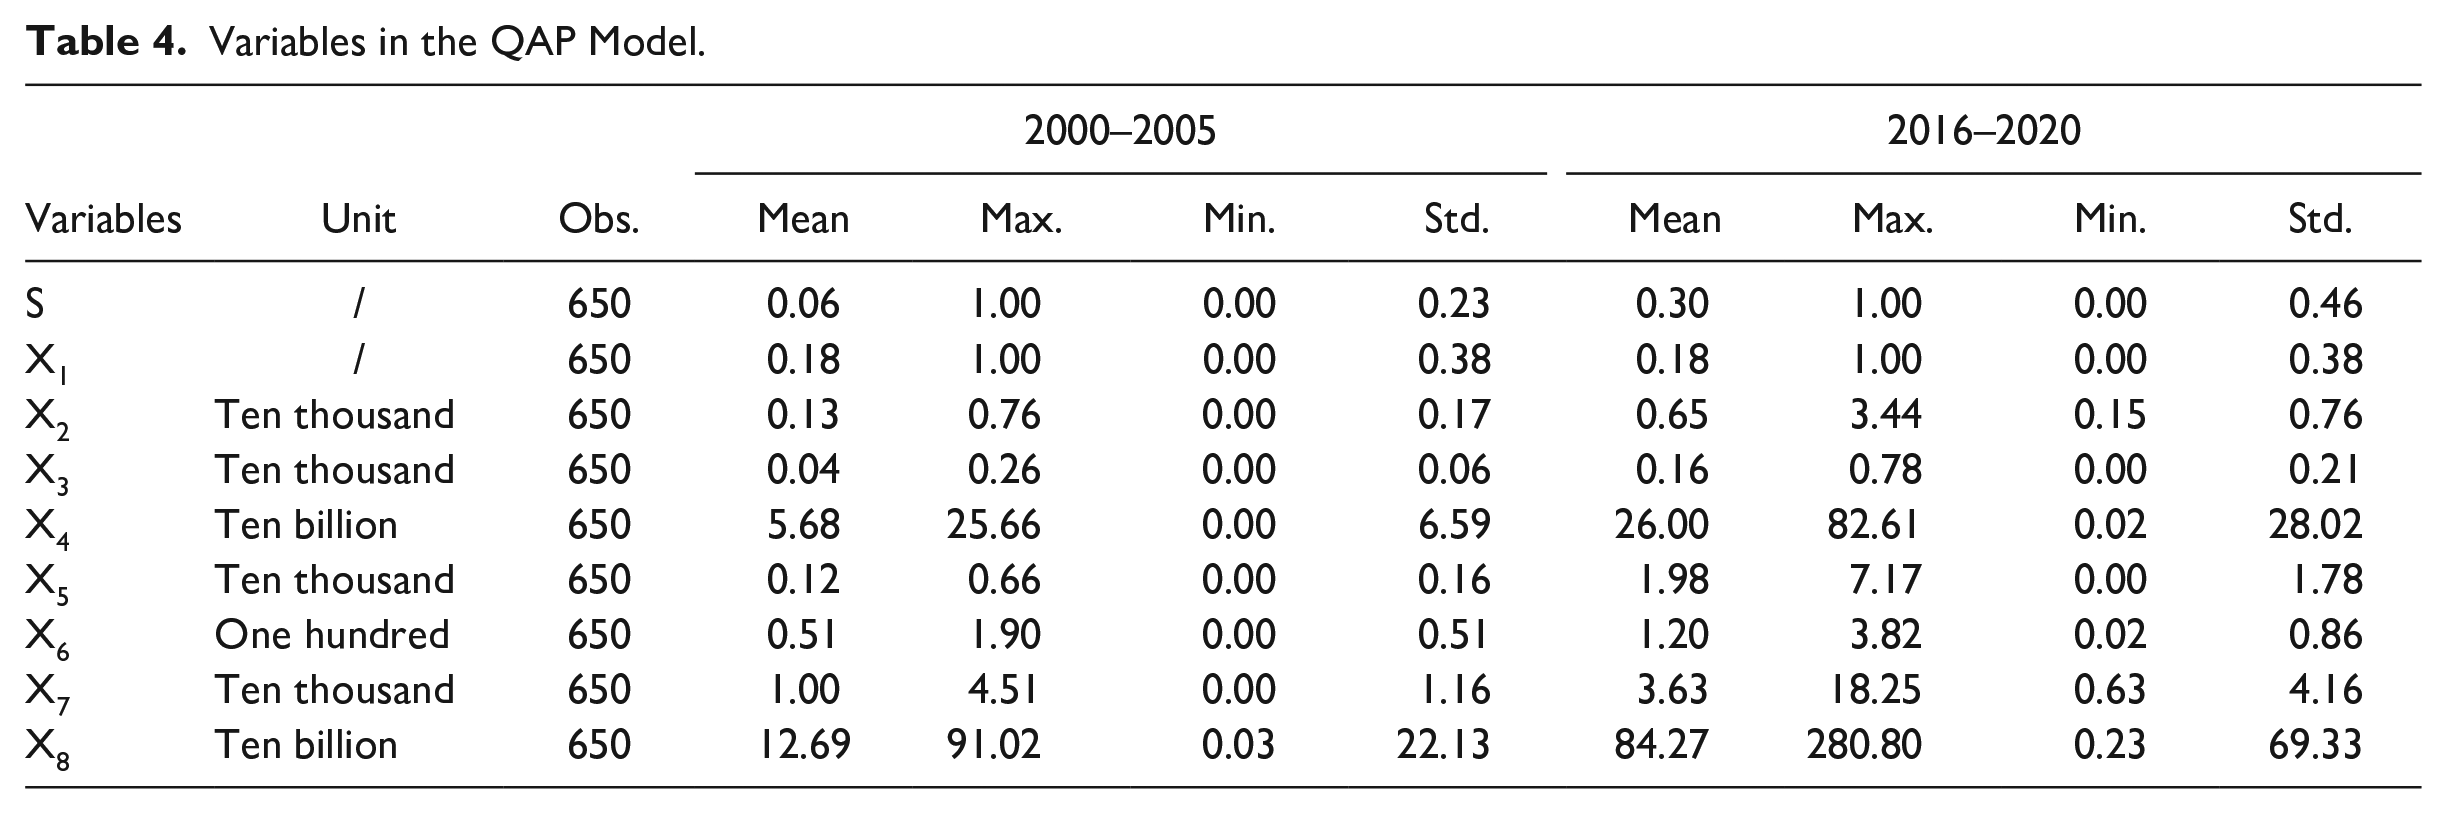
For tourism development foundation data, we determined the number of A-rated scenic spots using the “National A-level Scenic Spot List” from the Ministry of Culture and Tourism of China. The number of tourism students in colleges and universities, as well as domestic tourism revenue data, was sourced from tourism statistical bulletins. The QAP model’s final sample size is 650, excluding the 26 diagonal items from the total of 676 items in the tourism innovation network association matrix for the study region. Due to space limitations, we have included the statistical descriptions of variables in the QAP model for the years 2000 to 2005 and 2016 to 2020 in Table 4.
Variables in the QAP Model.
Results
The Spatiotemporal Differences and Evolution of Tourism Innovation
As the tourism industry in China experiences growth and development, accompanied by increasing attention from both national and local governments toward technological innovation in tourism, the overall capability for technological innovation within the Yangtze River Delta city cluster is steadily advancing. Data reveals a consistent upward trajectory in both the total and average number of tourism invention patents across four distinct time periods. The total count of patents has surged from 53 during the 2000 to 2005 period to 507 in the 2016 to 2020 period, while the average count has increased from 9 to 101 (see Figure 2).
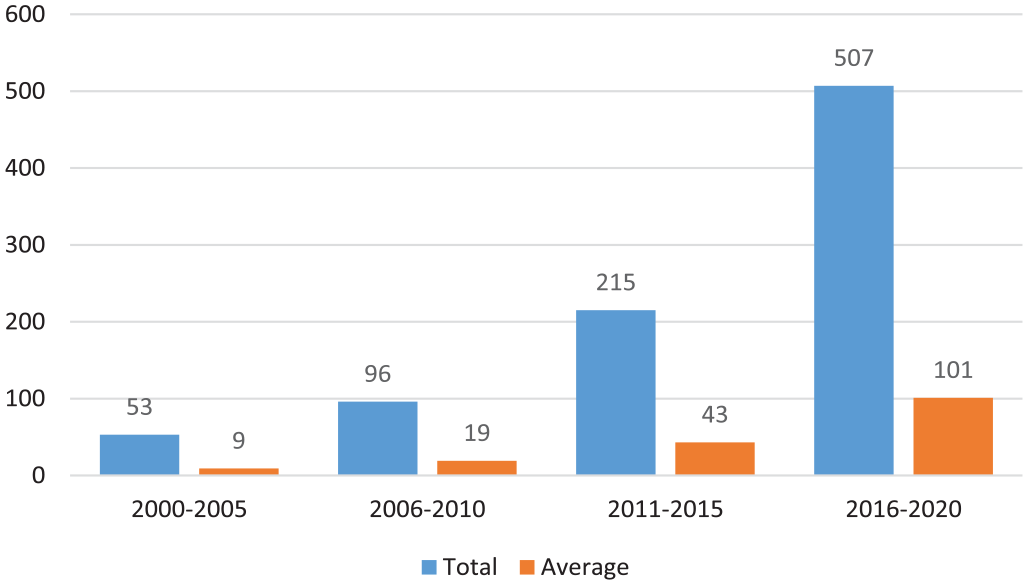
The total and average number of tourism invention patents of the Yangtze River Delta urban agglomeration.
Upon analyzing the data over four time segments, it’s clear that tourism technological innovation is strengthening across most cities (see Figure 3). Notably, Nanjing, Shanghai, Hangzhou, and Suzhou consistently lead in total and average tourism invention patents, with averages exceeding 10 patents from 2016 to 2020. In contrast, over 20 cities had averages of fewer than five patents during the same period. This analysis reveals a concentration of tourism technological innovation in the Yangtze River Delta, leading to an imbalance in innovation capability. This trend may be linked to a multi-core development pattern, shaping the region’s diverse innovation landscape.
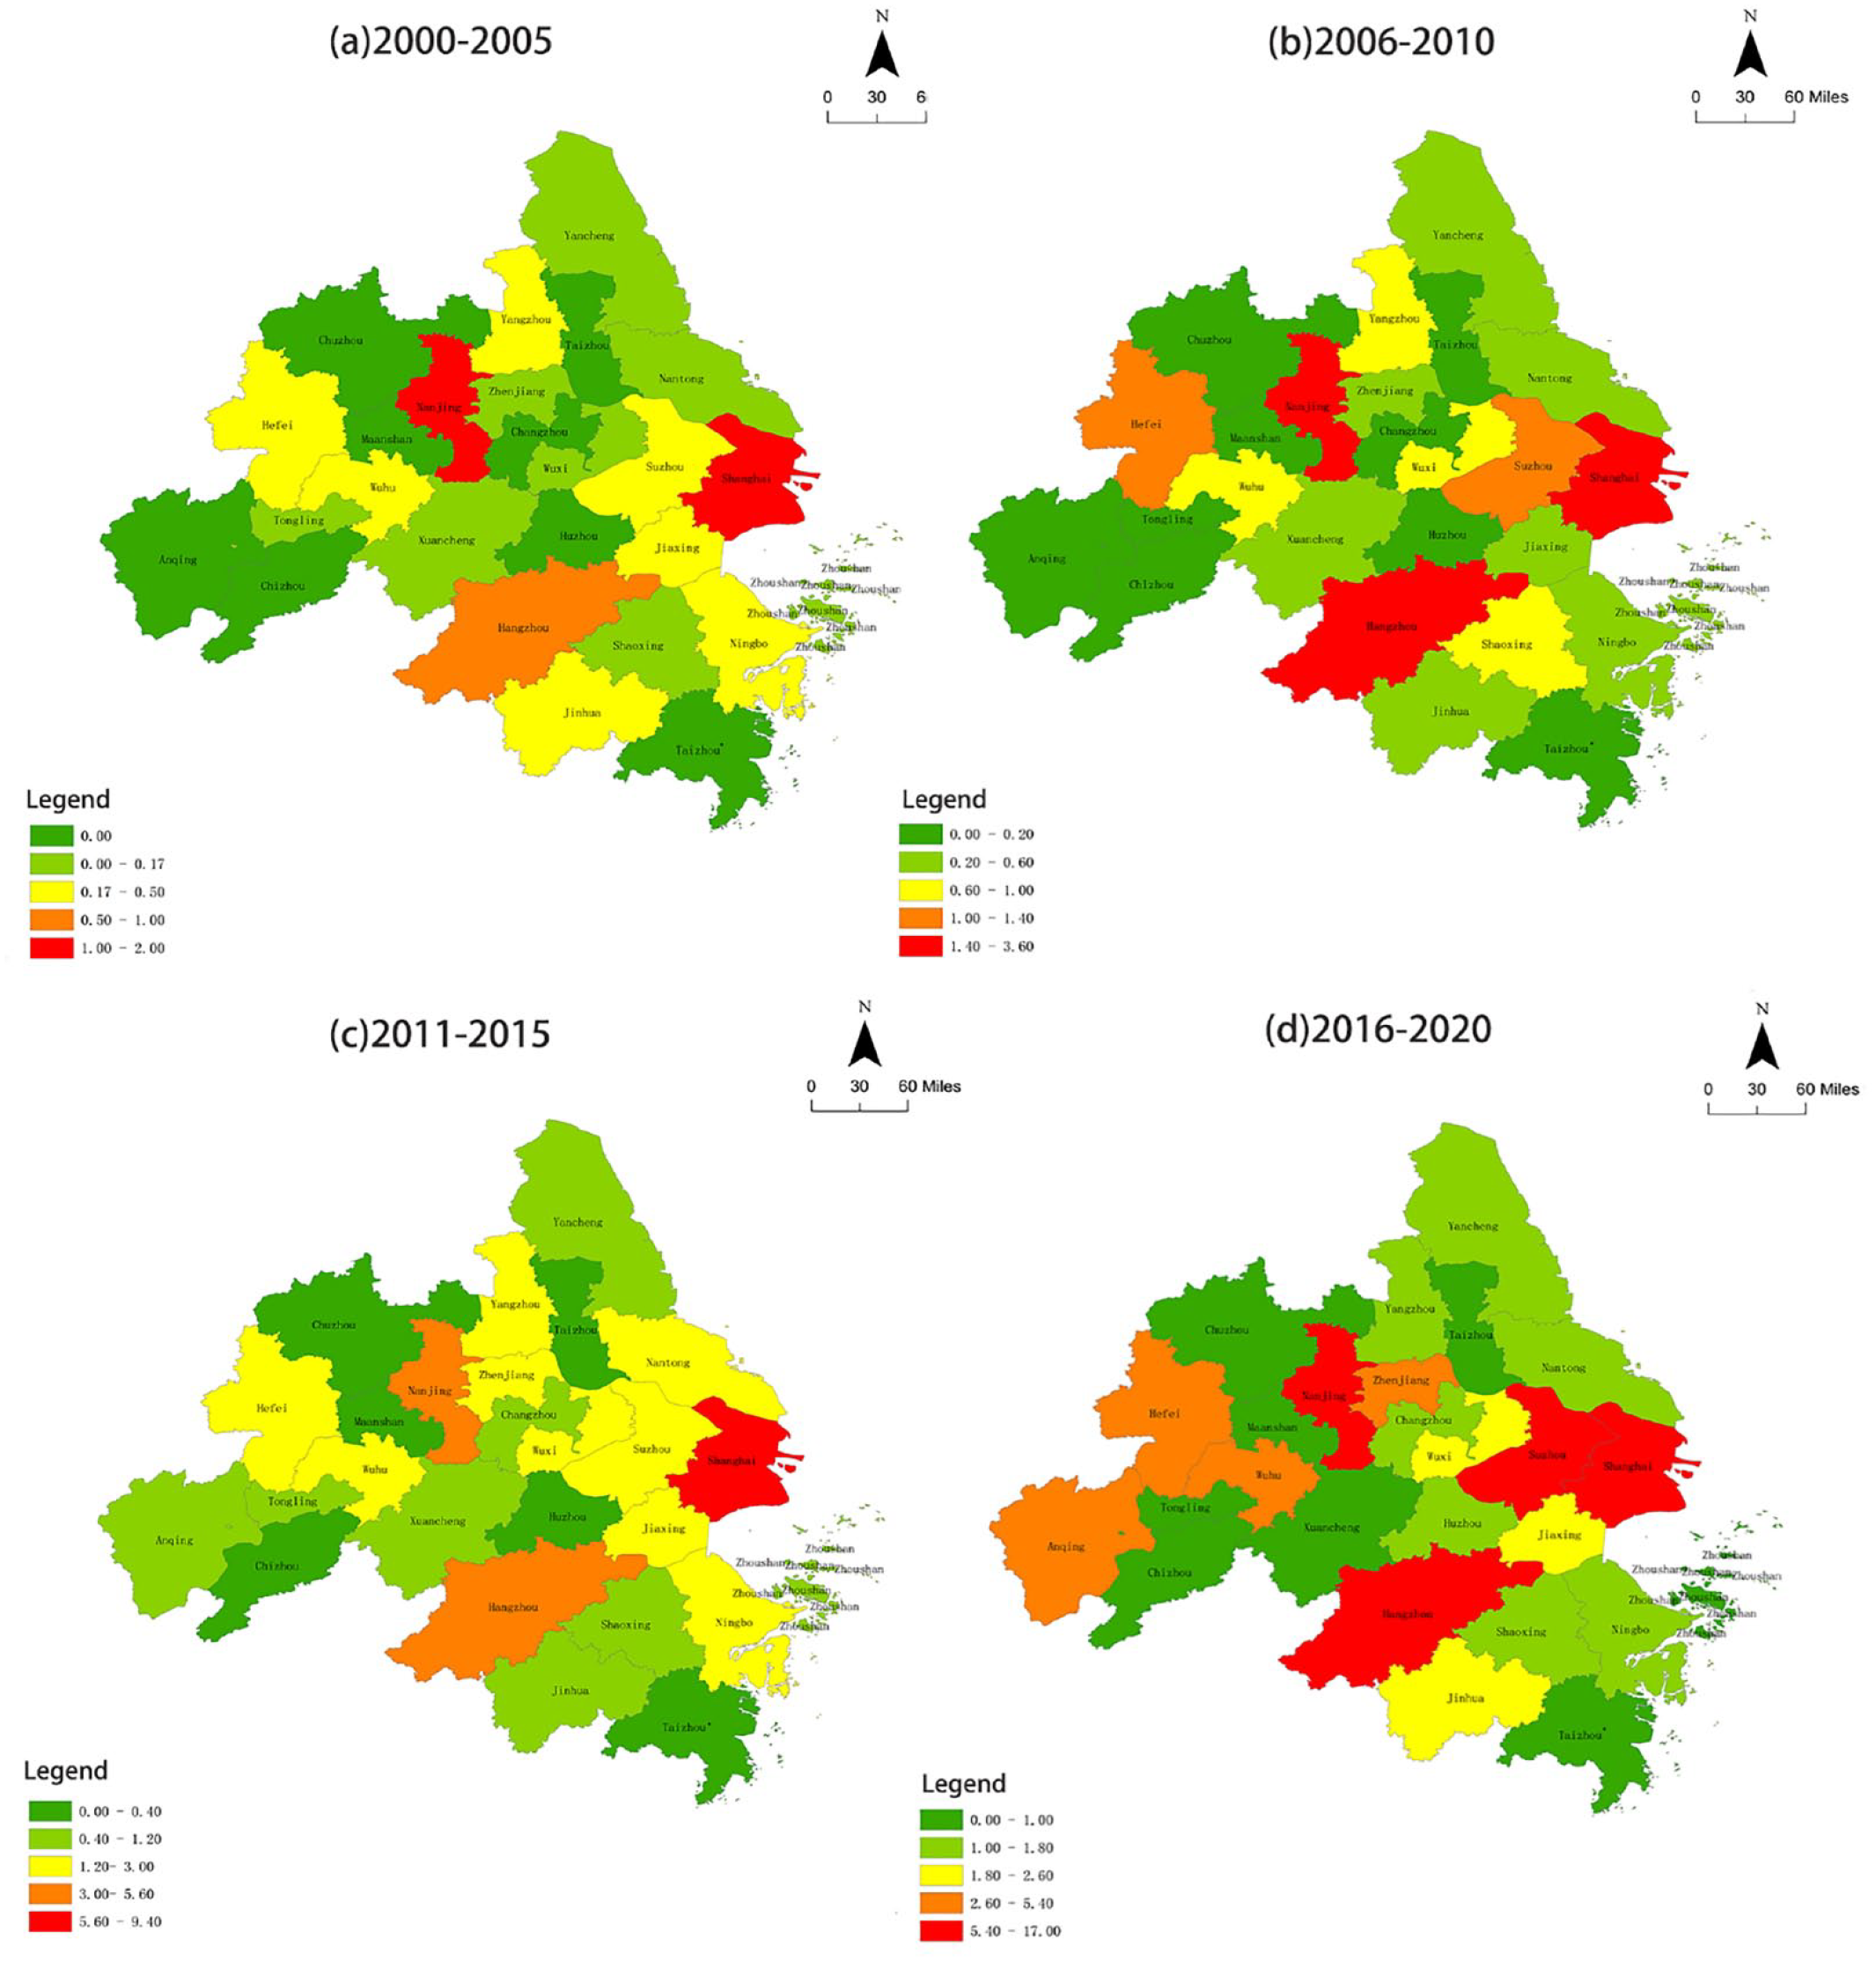
The spatio-temporal evolution of tourism innovation of study region.
The Overall Characteristics of the Tourism Innovation Network
Figure 4 illustrates the evolution of the tourism innovation network in the study region, revealing several key patterns. Firstly, the network has become increasingly interconnected and complex over time, with growing links among the 26 cities. Secondly, the central position has remained stable, with more secondary center cities emerging. Shanghai, Nanjing, and Hangzhou have consistently occupied the core position since 2000, while relatively developed cities like Suzhou, Hefei, and Yangzhou have seen improvements in their tourism innovation capabilities due to their connection to the core cities. Thirdly, the network structure has evolved from being loose and fragile to becoming more compact and stable. Additionally, the number of marginal cities in the tourism innovation network has significantly decreased over the past 21 years, resulting in a more balanced and reasonable development of the entire tourism innovation network in the region.
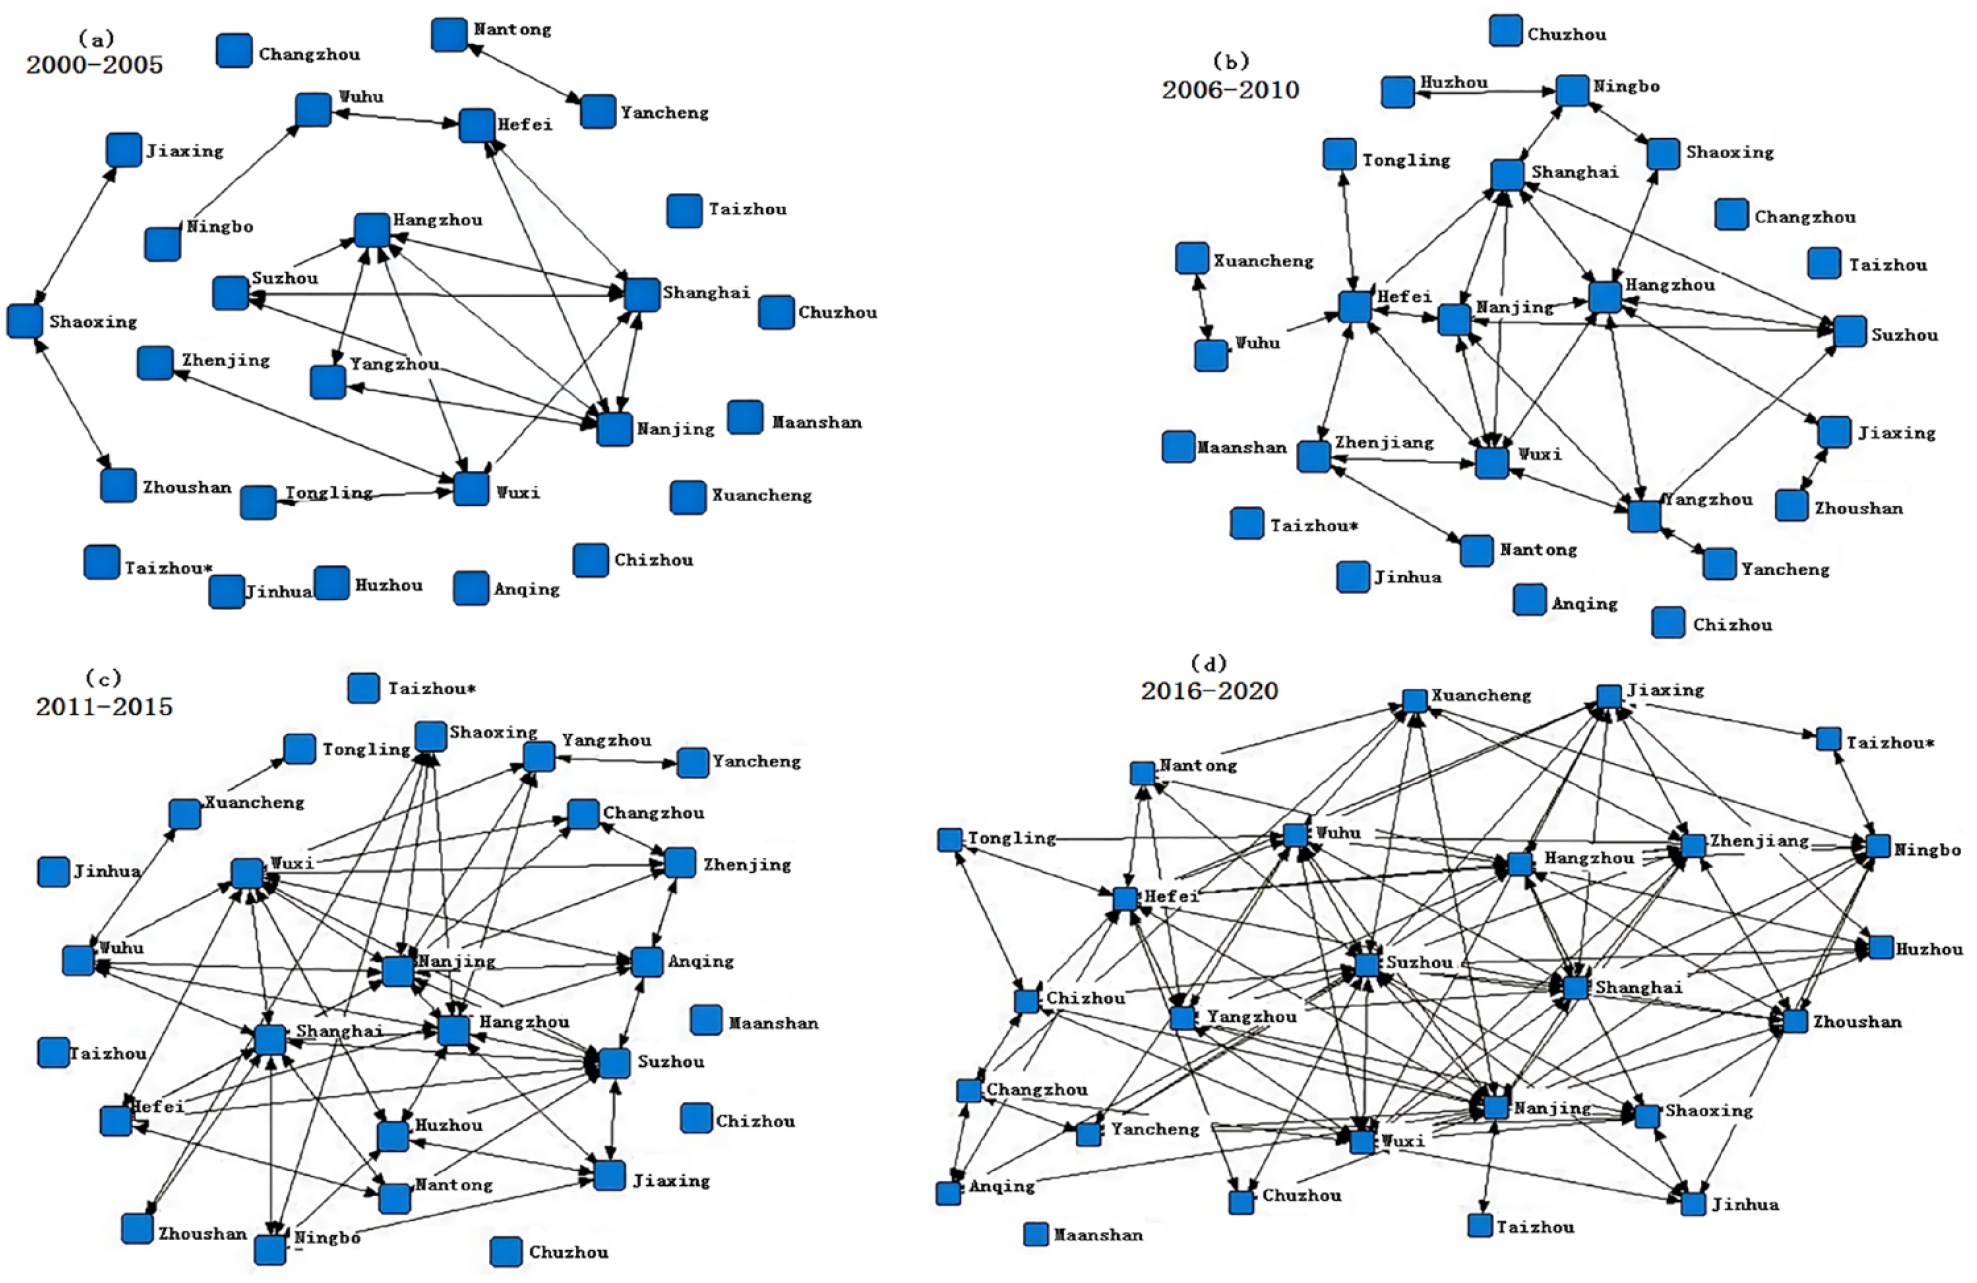
The tourism innovation network of the study region from 2000 to 2020.
The Structural Characteristics of the Whole Tourism Innovation Network
The density and correlation of the tourism innovation network of the study region appear a clear upward trend (Figure 5), that is, the network density rose from 0.058 in 2000 to 2005 to 0.298 in 2016 to 2020, and the network correlation increased from 0.1815 in 2000 to 2005 to 0.9231 in 2016 to 2020. These results further indicate that there are more and more ties in the tourism innovation network and a general and stable spatial spillover of tourism innovation occurring in the tourism innovation network. It is worth mentioning that although the network density has increased significantly, it is still at a low level far from saturation and has much room for improvement.
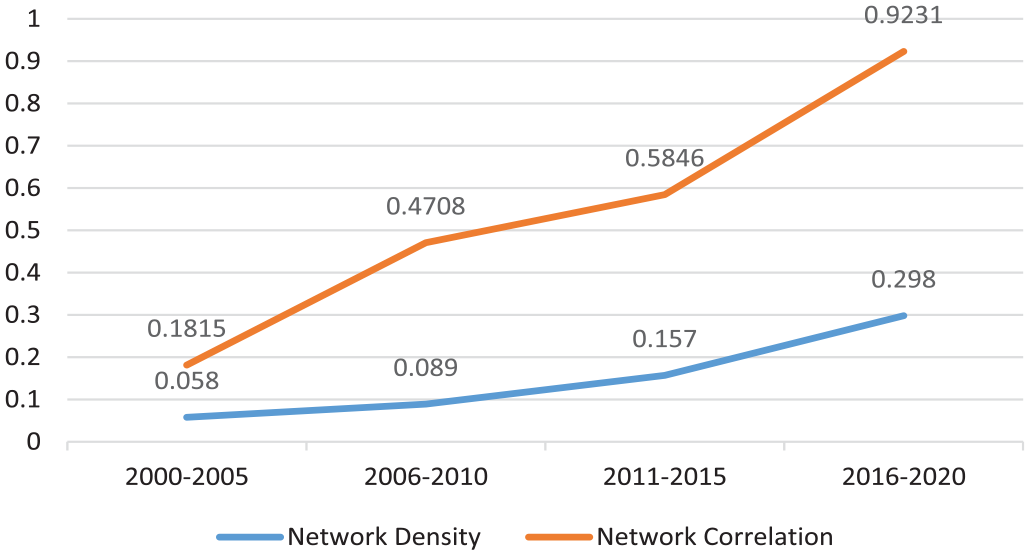
The density and correlation of the tourism innovation network of the study region from 2000 to 2020.
The Structural Characteristics of Tourism Innovation Ego-Networks
The three centralities calculated of the tourism innovation ego-networks nearly show an increasing trend year by year, from 1.5, 5.4, and 2.8 in 2000 to 2005 to 7.5, 36.8, 8.7 in 2015 to 2020. This indicates that the tourism innovation links between cities are increasingly closer, and the degree of cooperation has increased. The rapid development of high-speed rail in recent years has brought many cities within the network into the 2-hour economic life circle, with the leading cities of Shanghai, Nanjing, and Hangzhou as the core of the network.
As seen in Figure 6, key cities in the study region, including Nanjing, Shanghai, Hangzhou, and later Hefei, have consistently maintained high centrality over the past 21 years. This underscores their crucial roles within the tourism innovation network, as they wield substantial influence, serve as intermediaries, and facilitate information exchange and resource acquisition. Conversely, marginal cities like Taizhou, Chuzhou, and Ma’anshan occupy the network’s periphery due to limited economic foundations, underdeveloped tourism sectors, and geographic disadvantages. They rely on other cities for external connections. Two notable points emerge: first, the average point centrality remained low between 2000 and 2020, indicating the need for stronger city-to-city ties; second, some cities possess a betweenness centrality of 0, signifying their lack of participation or intermediary role in the tourism innovation network.
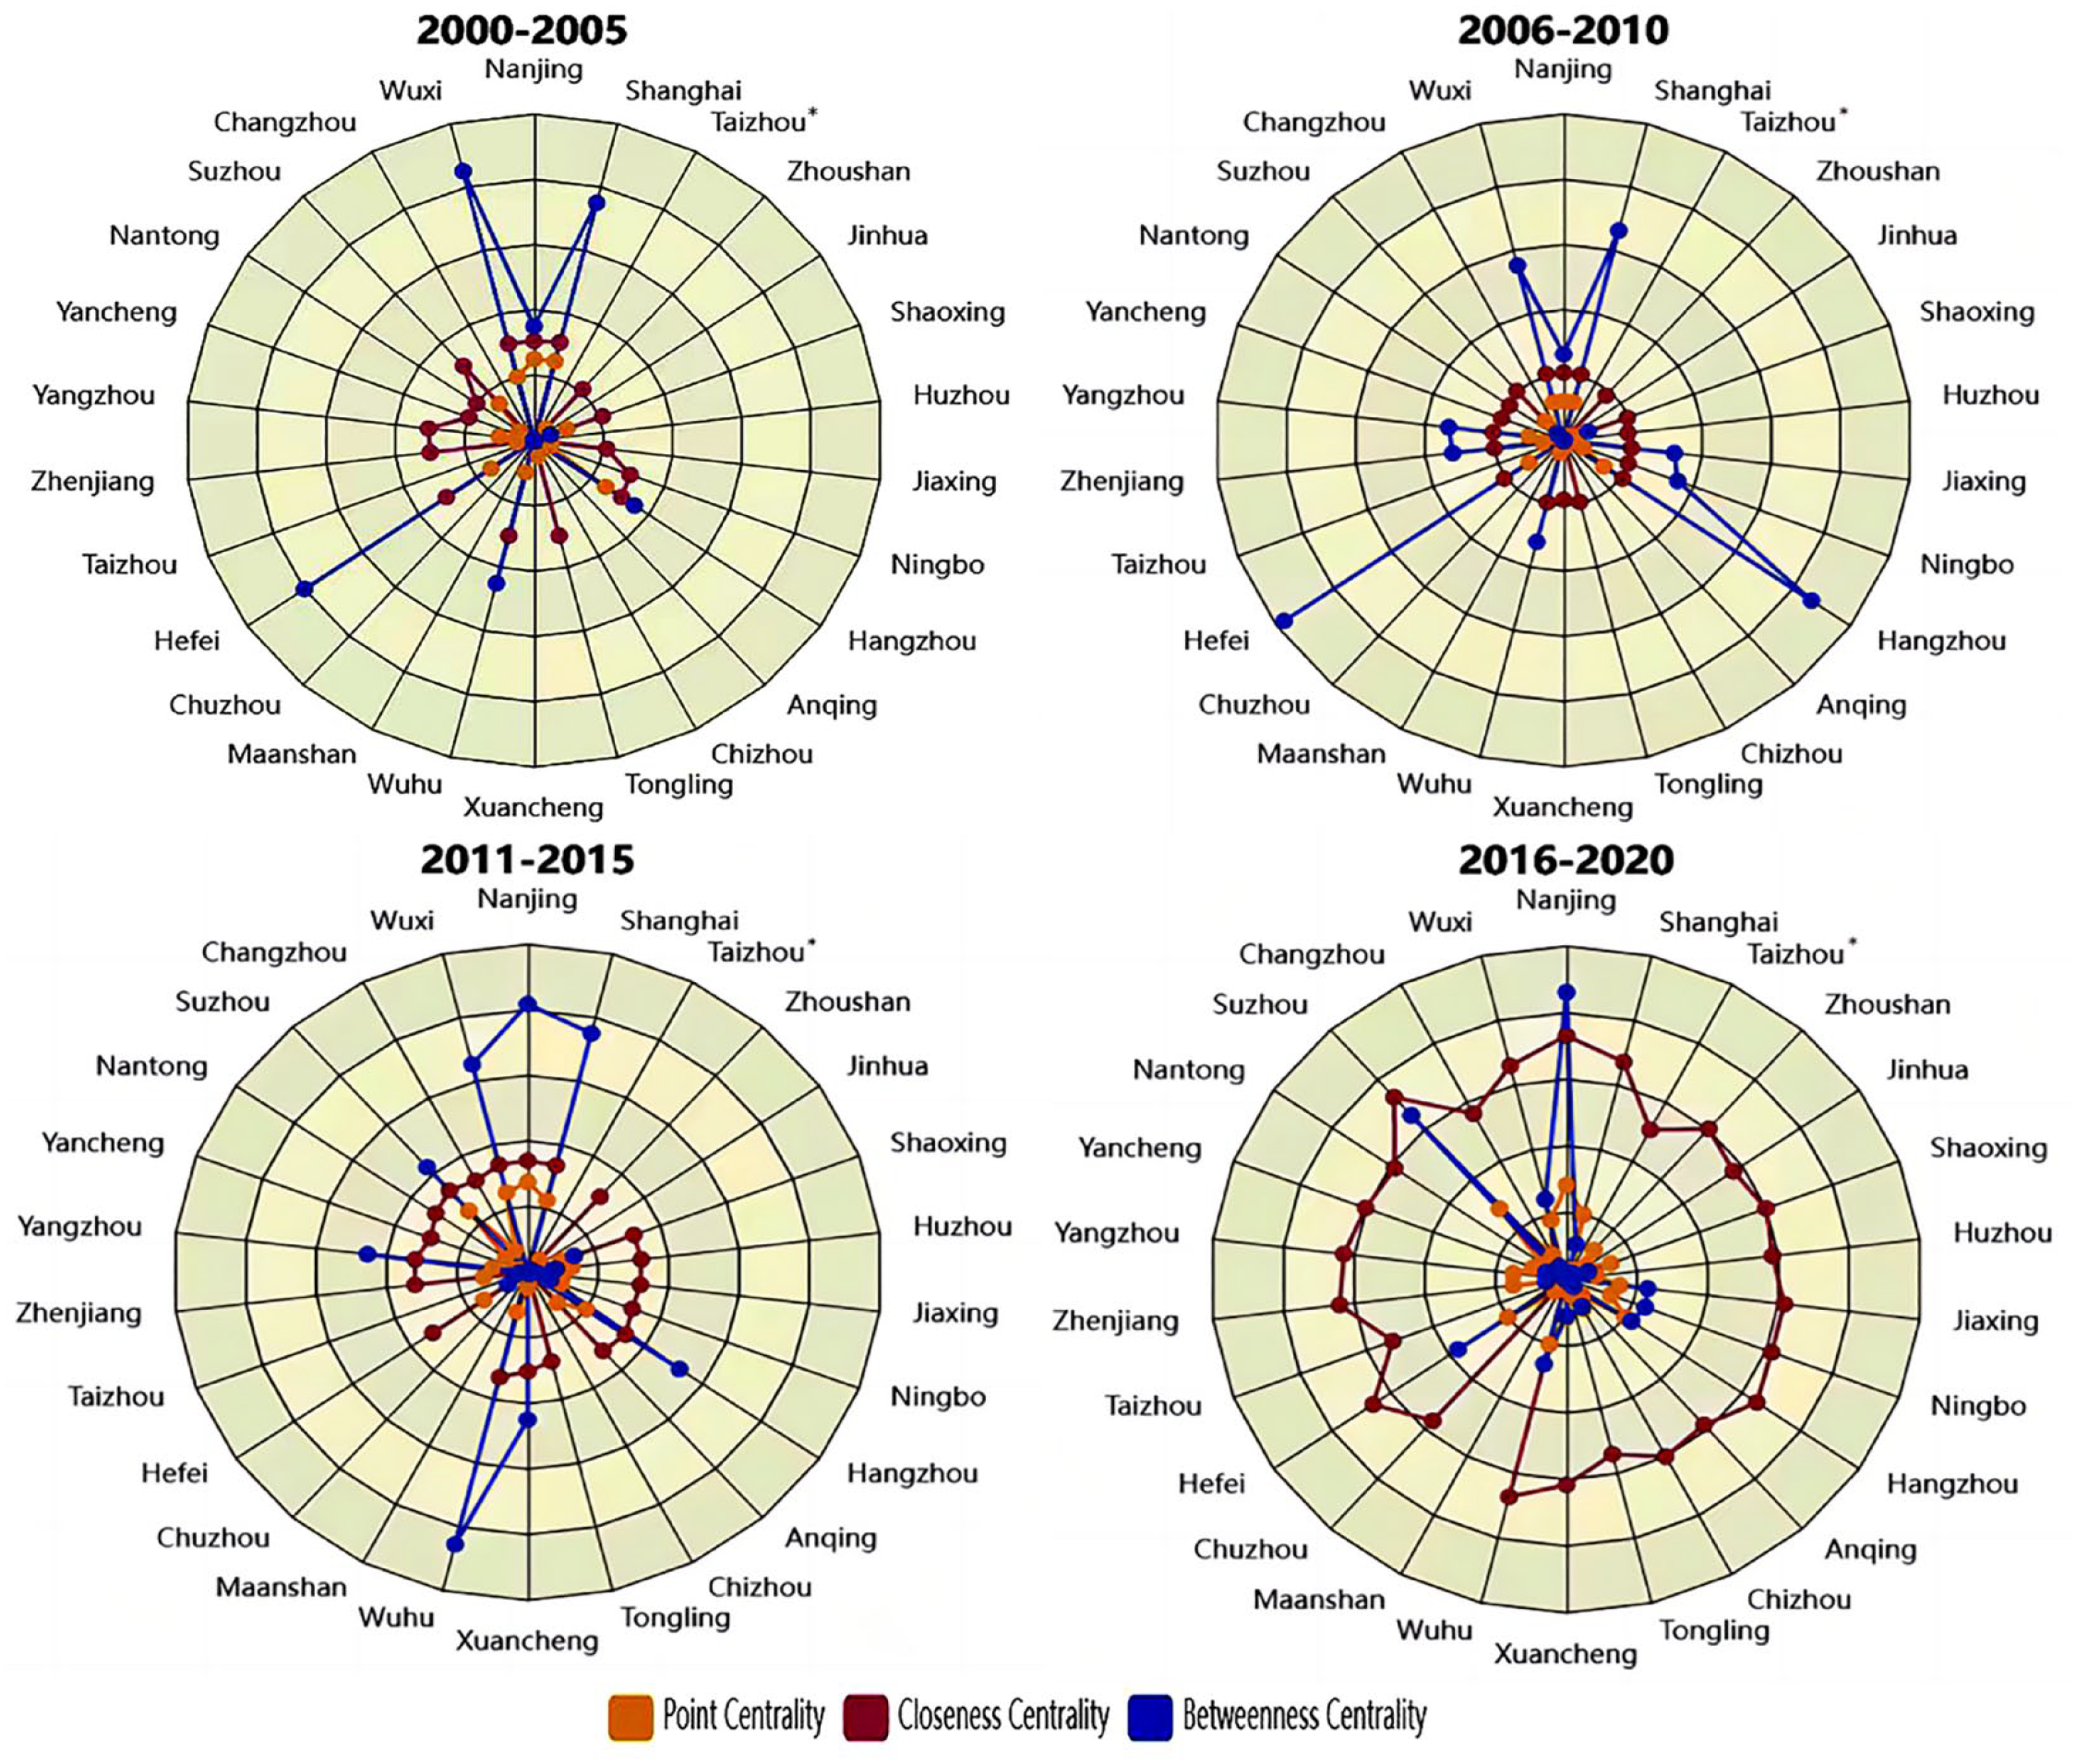
The centrality of tourism innovation network in the study region.
The Driving Factors of the Tourism Innovation Network
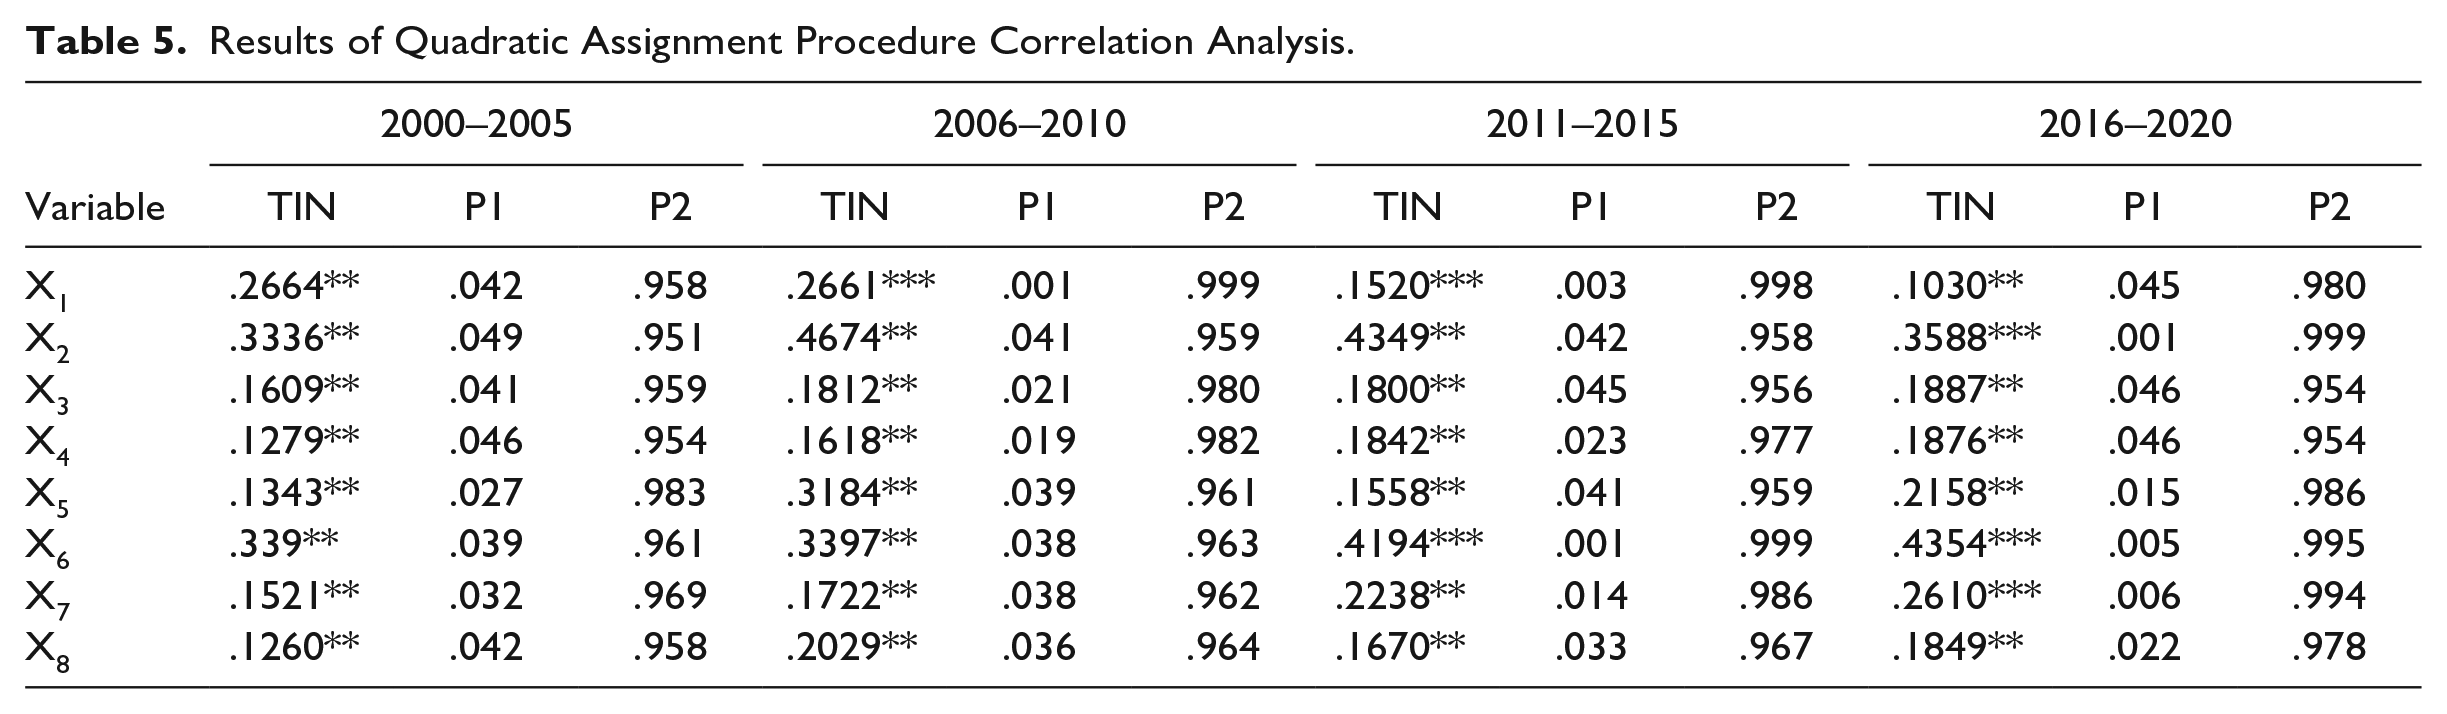
To verify the validity of the chosen driving factors in this study, we first analyzed the correlation between the network association matrixes of each factor and the tourism innovation network. The results in Table 5 show that all the correlation coefficients of the eight factors in the quadratic assignment procedure model in the four stages are greater than 0 with small variation and a p-value lower than 5%. This indicates that the chosen driving factors are appropriate for further analysis. Upon further comparison of the occurrence probability of correlation coefficients based on random permutation in the four stages, it was found that the occurrence probability of p ≥ 0 (p1) was close to 0 and the occurrence probability of p ≤ 0 (p2) was close to 1. This indicates that after 5,000 random permutations, the observed correlation coefficients of the eight factors approached the actual correlation coefficients, confirming the existence of a correlation between the explanatory variables and the explained variables. Therefore, the selection of factors in this study is deemed appropriate for the subsequent QAP regression analysis.
Results of Quadratic Assignment Procedure Correlation Analysis.
The results of QAP regression analysis in Table 6 after 5,000 random permutations show that all the adjusted coefficients of determination (R2) are statistically significant at the 0.01 significance level, despite the possibility of a decrease in the value of R2 due to fluctuations in variable data (as indicated in Table 4, the standard deviation of various variables expanded during the period 2016–2020 compared to 2000–2005, signifying increased data volatility, which in turn could result in a reduction in the model’s goodness of fit). Thus, the model has a high fit and good explanatory power.
Results of Quadratic Assignment Procedure Regression Analysis.
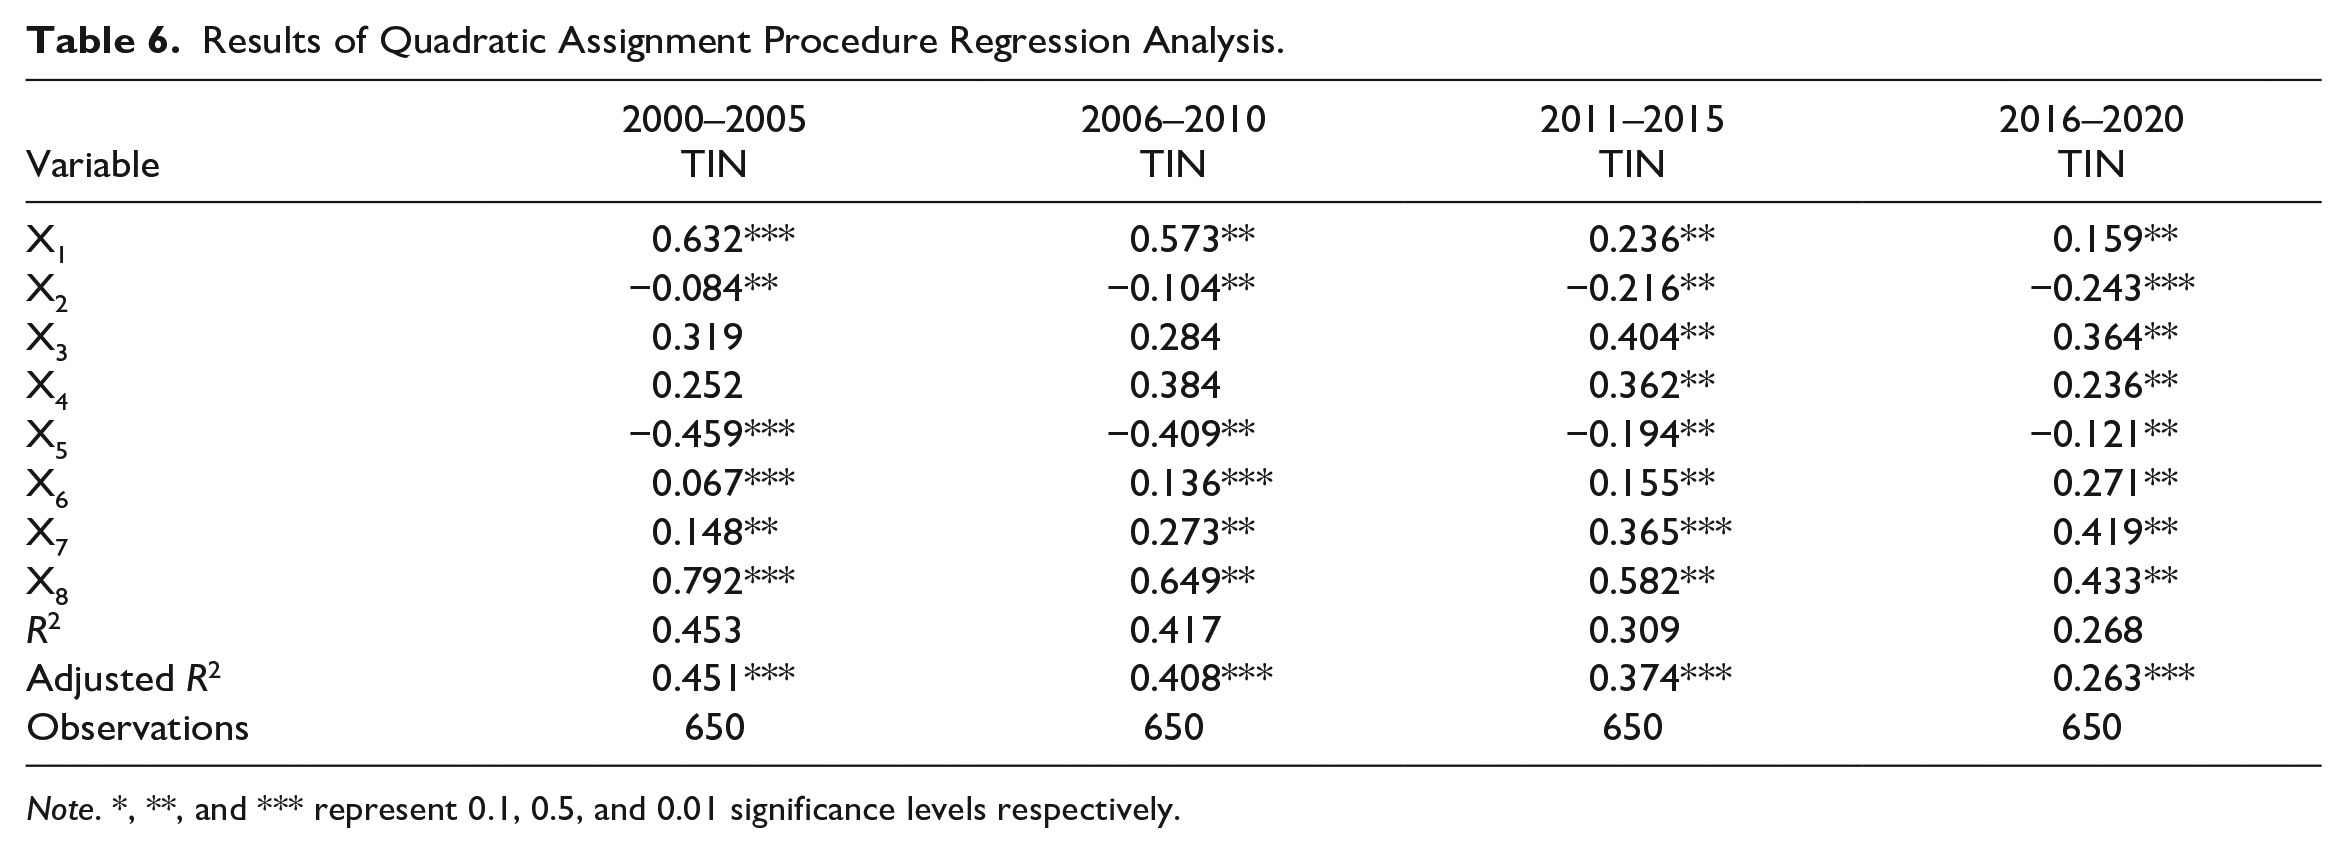
Note. *, **, and *** represent 0.1, 0.5, and 0.01 significance levels respectively.
The factors influencing the tourism innovation network of the study region can be summarized as follows. First, geographic proximity (X1) has a positive and significant impact on the network, with estimated coefficients consistently above 0 and statistically significant at the 5% level. This suggests that the closer the distance between cities, the stronger the tourism innovation connection. However, the estimated coefficients of geographic proximity decrease year by year from 0.632 to 0.159, indicating that the influence of geographic proximity is gradually weakening.
Second, the regression coefficients of the economic difference (X2) has negative and significant coefficients at the 5% or 1% level, indicating that cities with similar economic level are more likely to establish tourism innovation links. However, the absolute value of the coefficient increases over time, suggesting that the negative impact of economic differences on the links in the tourism innovation network is increasing.
Third, all the regression coefficients of the research institute difference (X3) and research investments difference (X4) are positive but change from being insignificant in the early stage to being significant in the later stage at the 5% statistical level. These results illustrate that the bigger the research institute difference and research investments difference are, the stronger the tourism innovation connections between the cities. Moreover, we have observed a consistently significant negative regression coefficient for technological difference (X5), exhibiting a gradual declining trend over the years. This indicates that a greater technological disparity is associated with a less favorable environment for the establishment of the tourism innovation network. With the coordinated advancement of technology, the magnitude of technological disparity has decreased, leading to a notable reduction in the detrimental impact on the tourism innovation network.
Fourth, the regression coefficients of tourism resource endowment difference (X6) and tourism education difference (X7) in the past 20 years are both significantly positive at the 5% level and expand from 0.067 and 0.148 to 0.217 and 0.419 respectively year by year, indicating that the bigger the differences in urban tourism resources endowment and tourism education, the more tourism innovation links in the region.
Finally, the regression coefficients of the tourism economic difference (X8) are all positive during 2000 to 2020 and significant at the 5% level. This implies that a greater disparity in tourism economies positively influences connections in the tourism innovation network. When combined with the positive effects of differences in tourism resources and education, it suggests that tourism economic disparities contribute to intercity tourism innovation links. However, the coefficient declined over time, indicating that the economic gaps between cities in the study region have been narrowing, leading to a reduced positive impact on tourism innovation connections.
Selecting the right threshold is crucial when using the binary method to determine spatial relationships (Z. Wang et al., 2020). We used average attraction values as the benchmark for intercity tourism innovation relationships, which could potentially reduce the number of such associations. This choice may introduce bias into the QAP regression results.
To further assess the robustness of our findings, we utilized an approach using average attraction values between cities as a benchmark and adjusted the threshold to range from 80% to 120% of this value. This adjustment created new spatial association matrices for tourism innovation between cities, enabling us to perform another QAP regression analysis.
The robustness tests, shown in Tables 7 and 8, confirm the stability of regression coefficients’ direction and the minimal changes in their magnitude and significance under both threshold scenarios. This suggests that the variables’ impact on the spatial tourism innovation network between cities remains consistent across various thresholds, reinforcing the reliability of the empirical findings in this study.
Robustness Test Results (Breakpoint value = 80% of the average gravitational value).
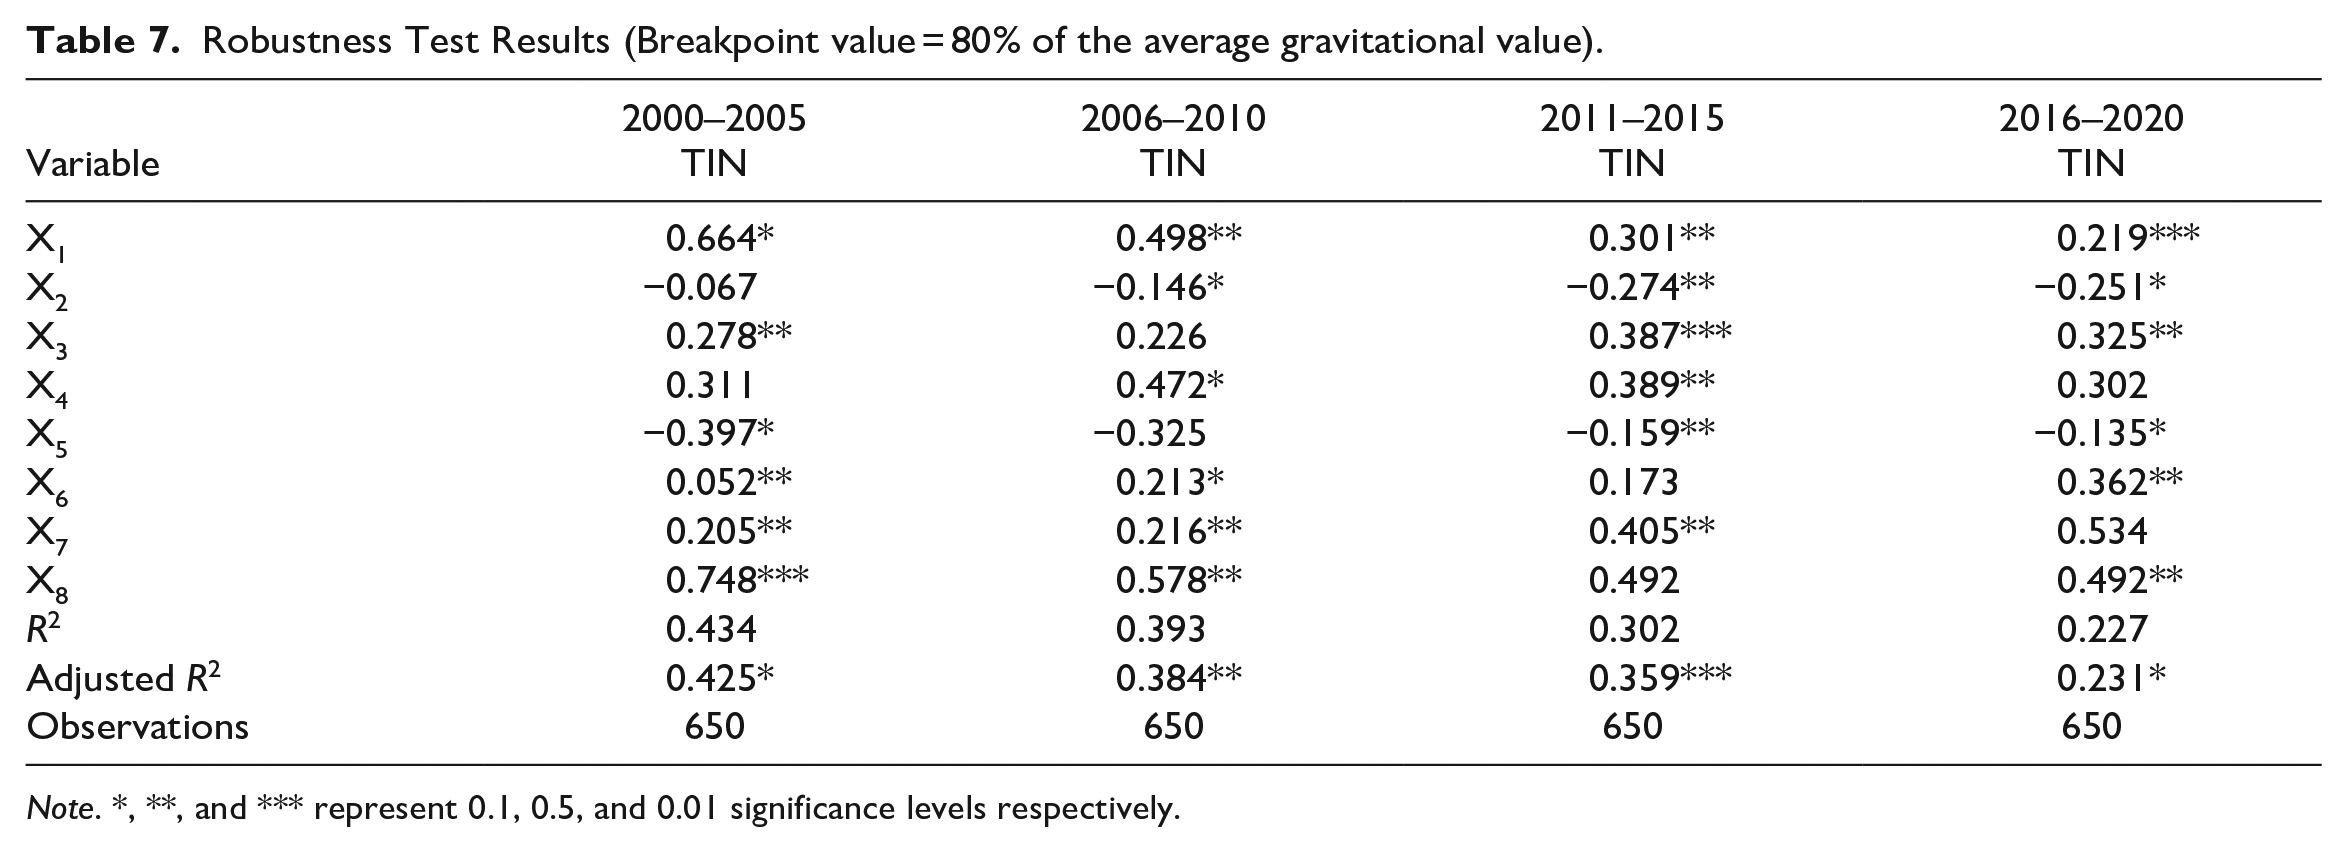
Note. *, **, and *** represent 0.1, 0.5, and 0.01 significance levels respectively.
Robustness Test Results(Breakpoint value = 120% of the average gravitational value).
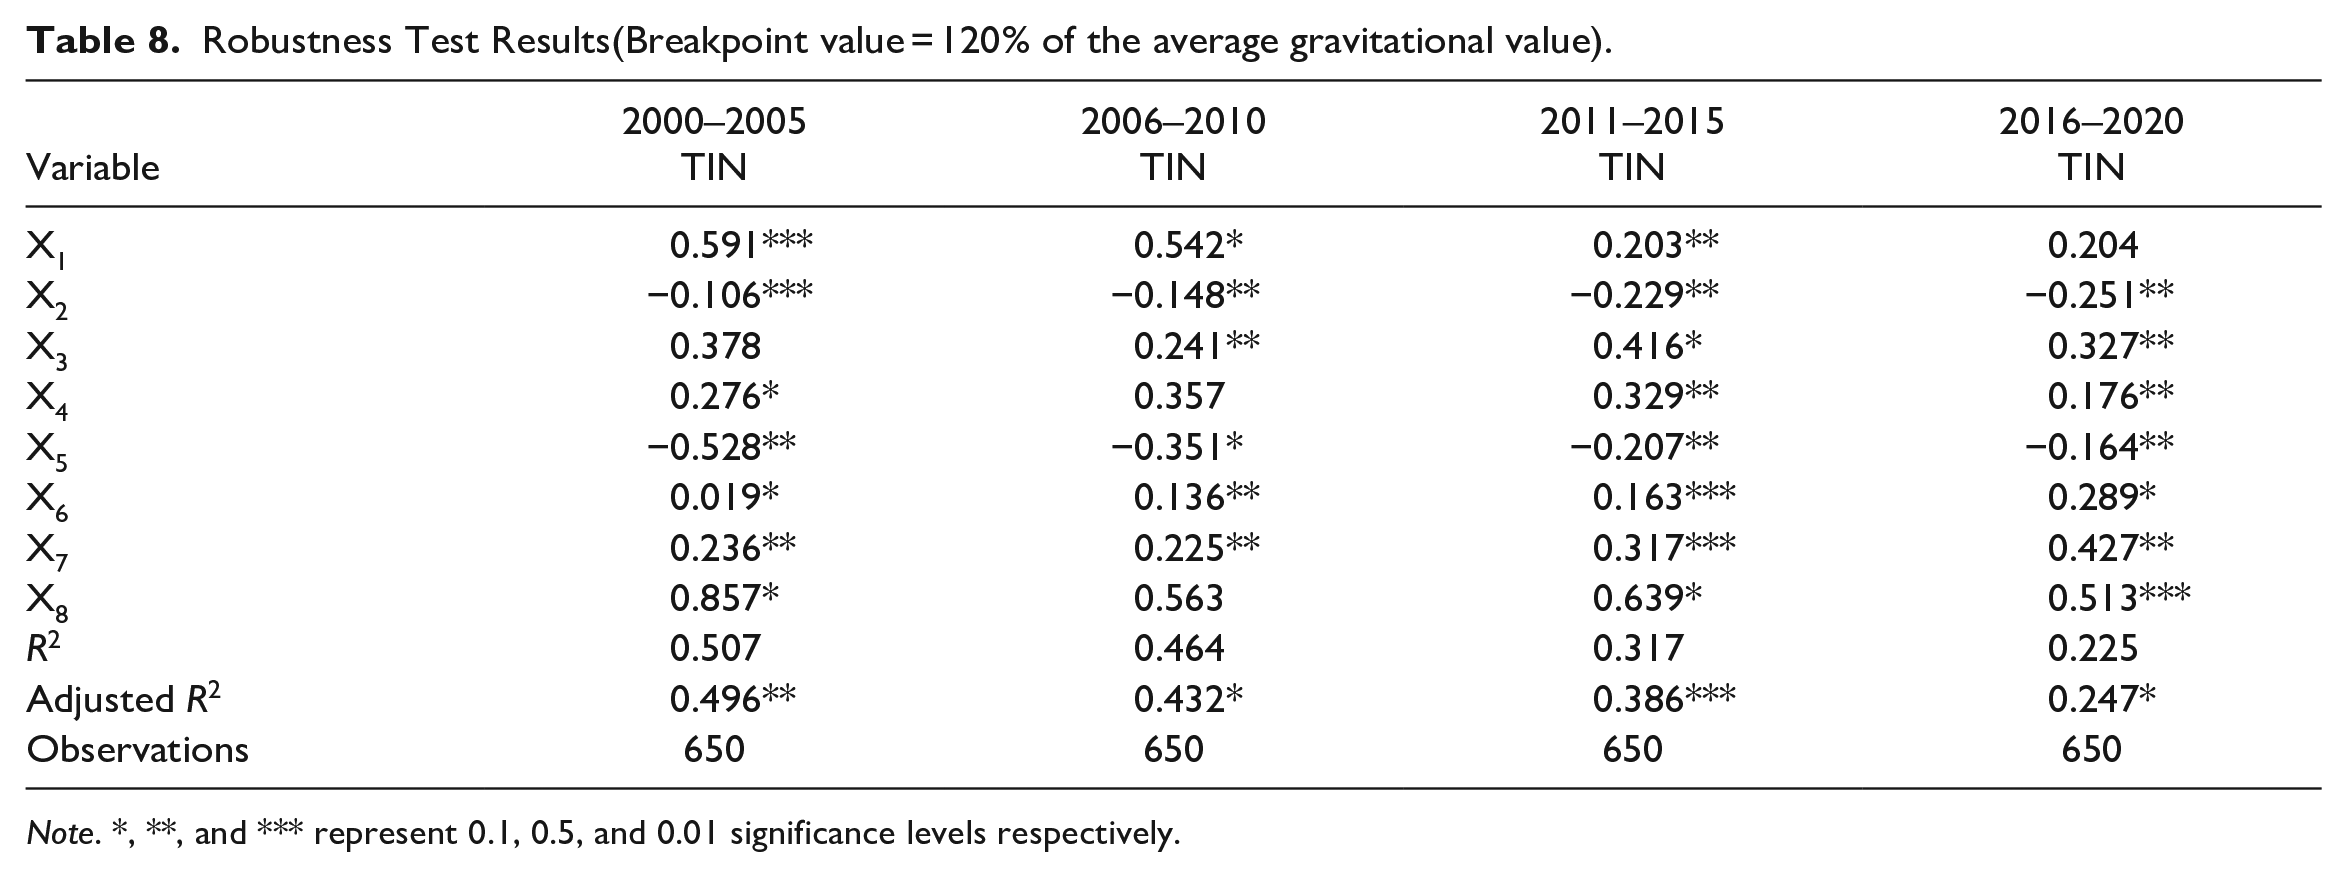
Note. *, **, and *** represent 0.1, 0.5, and 0.01 significance levels respectively.
Discussion and Conclusions
This study attempts to advance the understanding of the complex and dynamic nature of the multi-destination tourism innovation network. By exploring the tourism innovation relationships between city destinations in a large urban agglomeration and analyzing the network’s dynamic evolution over time and space, the study sheds light on the factors that shape the evolution of the network, and ways to break free from the “low-end locking” effect, and cross-destination innovation transfer.
Theoretical Implications
This study has several theoretical implications. First, this study broadens the scope of tourism innovation research and deepens our understanding of the tourism innovation network from a macro perspective. Unlike the previous research that focuses on the micro-level organizational innovation network or the studies on the regional tourism innovation network (Lyu et al., 2019), this study is among the first to examine the tourism innovation network with the city destination as the unit of analysis. We observe increasing integration among network destinations, a rise in innovation links, and a shift from a loose to a more intricate network structure. This suggests the study region’s innovation network has effectively achieved its goals (Alberti et al., 2021; Blundel, 2006; Y. Liu et al., 2021; Nepelski & De Prato, 2018). There was a diffusion of tourism innovation in the study region, similar to the micro-level networks (Brandão et al., 2019; Makkonen et al., 2018). Geographically proximate destinations benefit from spatial agglomeration, fostering collective learning in tourism technologies, products, services, and best practices (Knippschild & Vock, 2017; Kofler et al., 2018; Makkonen et al., 2018). Leading destinations like Shanghai, Hangzhou, and Nanjing have long served as network centers with abundant resources and the ability to influence others (Brandão et al., 2019), driving integration (Piazza et al., 2019; Taalbi, 2020; Tsouri & Pegoretti, 2021) and shaping the innovation network (Alberti et al., 2021).
Second, our study uncovers key drivers of a multi-destination tourism innovation network, including geographic proximity, the disparities in economic, scientific variations, and tourism development foundation, thus addressing the gap in the existing literature on such networks. Our findings confirm that geographic proximity positively influences the tourism innovation network by facilitating knowledge, technology, and resource exchange, as well as promoting innovation connections (Kofler et al., 2018; Y. Li & Luo, 2021; Plechero et al., 2021). However, as transportation and communication infrastructure advance, the impact of geographic distance on innovation cooperation diminishes, resulting in the “death of distance” (Cairncross, 1997). The impact of geographic distance on the urban tourism innovation network is diminishing (Sole & Edmondson, 2002).
Third, our study contributes to tourism literature by investigating the impact of economic development gaps on the evolution of tourism innovation networks, an aspect often overlooked in prior research. Our findings highlight that regional economic convergence plays a pivotal role in driving tourism innovation network connections. Smaller disparities in economic development between regions foster a stronger impetus for tourism innovation network evolution. This pattern aligns with observations in China’s green innovation network, where economic differences significantly influence network formation and development (Y. Liu et al., 2021). As cities progress economically and the gaps in their growth narrow, it becomes easier for city destinations within the regional innovation network to collaborate on tourism innovation efforts.
Fourth, our study reveals that differences in research institutes and research investments initially have no impact on the tourism innovation network’s evolution but become positively influential in later stages, challenging the common belief that scientific input proximity fosters innovation network formation (Y. Liu et al., 2021). This could be attributed to smaller early-stage research investments, which primarily focused on unrelated sectors, hindering tourism innovation collaboration (J. Han et al., 2022; Min et al., 2020). Moreover, a significant technology gap in the early stage may have led to prioritized connections with central actors, reducing collaboration among peripheral ones (Nepelski & De Prato, 2018; Piazza et al., 2019). However, post-2010, increased research investments, driven by economic development, contributed to enhanced tourism innovation connections among cities with substantial scientific inputs (Min et al., 2020). Furthermore, we observed diminishing negative effects of technological differences on the innovation network’s evolution, aligning with findings regarding technological proximity in micro-level tourism organization networks (Makkonen et al., 2018). This reduction is due to the substantial early-stage technology gap, which impeded tourism innovation diffusion and collaboration among cities.
Finally, the study further uncovers the impacts of the differences in the foundation of tourism development, including tourism resource endowments, tourism economic development, and tourism education on the evolution of the multi-destination tourism innovation network, which has not been addressed in previous studies. It shows that tourism innovation to some extent is dependent on the differences between cities in tourism resources, tourism education, and tourism development (Broekel et al., 2021; Taalbi, 2020). In contrast to previous research that only focused on the impact of individual factors such as geographical proximity and knowledge transfer on innovation networks, our study shows that the evolution of the tourism innovation network is influenced by a combination of factors, including geography, economics, science, and industry. This is because much of the innovation in tourism comes from external sources (Hjalager, 2015) and the interdependence of regional knowledge, technology, economy, and other factors also play a role in driving the evolution of the tourism innovation network (Taalbi, 2020).
Policy Implications
The results of this study have important practical implications.
First, the study reveals a clear hierarchical structure of the multi-destination tourism innovation network, with a few developed cities (Shanghai, Nanjing, and Hangzhou) serving as the innovation hubs at the center of the network, driving the improvement of tourism innovation level and network status of other cities. Therefore, the developed cities should focus on playing the role of network leaders and use their strong innovation radiation capacity to effectively drive tourism innovation in the entire region (Piazza et al., 2019; Taalbi, 2020; Tsouri & Pegoretti, 2021). In addition, measures should also be taken to prevent the network structure from becoming overly isolated and self-sufficient, such as organizing activities to foster a culture of openness and collaboration, and knowledge sharing, encouraging participation from less-developed cities, and diversifying the actors and resources within the network.
Second, despite the increasing density of the tourism innovation network, the study findings indicate that some peripheral areas still exhibit inadequate participation in tourism innovation activities, relying heavily on spillover effects from central cities for their development. Therefore, we suggest that cities jointly build a “tourism innovation corridor” (Broekel et al., 2021; Taalbi, 2020) to coordinate tourism innovation resources and accelerate inter-city tourism innovation collaboration. Regional tourism innovation capability should be more than just the sum of destination-level innovation capabilities in an urban agglomeration (Wong, 2007), it should include the innovation links between destinations.
Third, this study reveals that, apart from economic development and innovation output gaps, all other factors exert positive and relatively stable impacts on the tourism innovation network, unaffected by changes over time. Consequently, local governments should proactively embrace coordinated development, enhance intercity transportation infrastructure, invest in tourism professional training and education, and enhance tourism resources. These steps strengthen the promotion of positive factors in the tourism innovation network. To counteract the negative effects of economic development and innovation output gaps, it is crucial to implement gap-reducing measures such as infrastructure investment, tax incentives, financial support for innovation, and educational programs.
Limitations and Future Research
This study’s findings pertain specifically to the study region, highlighting the need for future research examining regional tourism innovation networks at various spatial scales, such as “country-region-province-city-county.” While our modified gravity model offers valuable insights into spatial correlations of tourism innovation, it cannot account for complex and unquantifiable factors like policy influences due to the dynamic nature of social phenomena. Subsequent research can enhance the measurement of spatial correlations in tourism innovation. Additionally, the evolution of tourism innovation networks may be influenced by ongoing COVID-19 impacts. Future studies could investigate the pandemic’s long-term effects on the tourism innovation network, considering potential future pandemics and strategies for industry resilience and preparedness.
Footnotes
Declaration of Conflicting Interests
The author(s) declared no potential conflicts of interest with respect to the research, authorship, and/or publication of this article.
Funding
The author(s) disclosed receipt of the following financial support for the research, authorship, and/or publication of this article: This study is partly funded by Fujian Province Innovation Strategy Research Plan Project in China (Grant No.: 2023R0041).