
Abstract
Service scholars seem to have empirically overlooked the impact of service robots in the overall customer evaluation of tourism services. This study addresses this gap by leveraging three-factor theory and electronic Word-Of-Mouth data to assess human-robot interaction’ influence on customer satisfaction. Text analytics are deployed alongside a penalty-reward contrast technique on almost 70,000 online reviews spanning 44 hotels worldwide that incorporated service robots into their operations. Customer satisfaction with hospitality services is significantly increased by positive service robots’ performance, while no significant effect is associated with negative service robots’ performance. The traveler type does not moderate the relationship between service robots’ performance and customer satisfaction. These findings, confirmed through Propensity Score Matching, reveal that service robots constitute an “excitement factor” in hospitality service offerings, thus providing a strong incentive for their integration into the workforce. Policymakers are urged to proactively facilitate the transition to a more automated service economy.
Keywords
Introduction
The fourth Industrial Revolution is expected to profoundly change the contemporaneous society (Schwab, 2016). Innovative business models mainly relying on the fusion and interaction of digital technologies are expected to emerge (Geissbauer et al., 2016; M. Mariani & Borghi, 2019). Cyber-physical systems, as a novel general-purpose technology, will generate unprecedented value, coupling digital and physical processes (Tuomi et al., 2021). This phenomenon can be observed also in the service industries and more specifically the tourism domain (Stankov & Gretzel, 2020). Within the service realm, artificial intelligence and robotics are perceived as the main driving forces of the digital transformation of services (Huang & Rust, 2021). Indeed, these technologies not only allow businesses to increasingly automate their processes, but they do also have the potential to redefine the interaction with service customers (Song & Kim, 2022).
The global market for professional service robots is rising at an exceptional pace. As reported by the International Federation of Robotics (2018, 2019), from the 59,269 units sold for professional use to businesses in 2016, the figures in 2018 went up to more than 271,000 units, reflecting a stunning 475% increase. As from the latest forecasts, sales are supposed to ultimately hit a seven digits figure in 2022, reaching an estimated amount of 1,019,300 units (International Federation of Robotics, 2019) while prices are expected to drop at a 5% annual rate (Financial Times, 2020). In the tourism and hospitality domain, international hotel brands such as Hilton, Marriott, and YOTEL are leading the digital transformation of services (Business Traveller, 2017), and are predicted to be soon followed by several other companies (ASD Report, 2019). Besides, the COVID-19 pandemic seems to be able to boost the adoption of service robots that meet social distancing regulations worldwide (Zeng et al., 2020). To date, service robots in the hotel setting have been deployed in a wide range of roles, acting as concierge, porter, room assistant, butler, housekeeper, and even as a front-line employee (Ivanov et al., 2017).
This remarkable growth in the demand for service robots worldwide did not go unnoticed in academic literature, where a sharp increase in interest has been recorded especially in the last 5 years (Ivanov et al., 2019). Scholars have started to question the role of service robots, exploring consumers’ perceptions in terms of trust (I. P. Tussyadiah et al., 2020), intention to use (de Kervenoael et al., 2020), adoption (Lee et al., 2021), and human-like morphology (Jia et al., 2021). Yet, this blooming research field is rather fragmented (V. N. Lu et al., 2020) and dominated by conceptual contributions (Ivanov et al., 2019; I. Tussyadiah, 2020). As such, service researchers have started to call for empirical investigations, and tourism and hospitality scholars are trying to pay particular attention to the influence of service robots on “the tourist” experience (Tung & Law, 2017). Indeed, as frontline employees in a wide range of roles in the tourism domain (Ivanov et al., 2017), service robots may be one of the service features able to alter tourists’ judgments of the service experience (I. Tussyadiah, 2020). Besides, understanding whether service robots are an effective substitute for human employees from a customer perspective is made even more compelling by the difficulties that historically hospitality managers have experienced to efficiently innovate, in a labor-intensive, cost-driven and largely seasonal industry (Martin-Rios & Ciobanu, 2019). Therefore, as stressed by V. N. Lu et al. (2020), further investigation is needed in the post-service consumption phase, to shed light on the influence of service robots on perceived overall customer satisfaction. This is a remarkable research gap in light of the perennial tourism and hospitality scholars’ quest for unveiling which attributes of the service offering are more appreciated by service customers (Dolnicar & Otter, 2003). Indeed, being able to satisfy the customer is seen as “the key to the success of every organization in the hospitality field” (Bi et al., 2020, p. 1). Moreover, in a post-pandemic world, this is made even more compelling due to the expected increase in global demand for service robots (Financial Times, 2020). This is due to service robots being able to offer a straightforward solution to comply with social distancing measures in service interactions in the tourism and hospitality industry (Zeng et al., 2020).
With the objective of filling the abovementioned research gap, we build on extant theorization of customer satisfaction and research revolving around human-robot interaction, to answer the following research question: To what extent do service robots influence perceived customer satisfaction in the hotel industry?
To address the research question, due to its great explanatory power (Bi et al., 2020), the three-factor theory of customer satisfaction represents the main theoretical model of the study. As suggested by the seminal study of Cadotte and Turgeon (1988), the three-factor theory claims that satisfaction and dissatisfaction are the extremes of two distinctive continua with service attributes able to act in both continua. To this aim, the theory provides an effective multi-factor structure that allows to map out the effect of service attributes on customer satisfaction (in the tourism and hospitality domain) into three specific dimensions: basic, performance and excitement factors. Based on this theoretical underpinning, distinctively from other studies, our work examines self-reported comments in the post-service consumption phase (online reviews) spanning 44 hotels worldwide that had included service robots in their workforce. Through a Penalty-Reward contrast analysis, innovatively conceived by deploying text analytics metrics, the impact of service robots’ evaluation pertaining to overall customer satisfaction is explored at different levels of performance (i.e., positive or negative). Moreover, due to the apparent importance of the traveler type in service robots’ judgments (e.g., Fuentes-Moraleda et al., 2020; Orea-Giner et al., 2022), we evaluate the potential moderating effect of travel type on the relationship between service robots’ performance and overall perceived satisfaction. Finally, to further assess the validity of the results, the study leverages a quasi-experimental contrast analysis, namely propensity score matching. Employing this technique, a more balanced sample is obtained, which—to a certain extent—simulates a randomized controlled trial to reduce the biases related to the estimates’ results.
As such, the study uniquely adds to extant literature at the intersection of the evaluation of the service experience, human-robot interaction and electronic Word-Of-Mouth in several ways. First, to the best of our knowledge, this is the first attempt to categorize and conjointly assess the impact of both positive and negative performance stemming from human-robot interactions on overall perceived customer satisfaction. Second, we go a step further to understand the relationship between service robots’ performance (either positive or negative) and overall perceived satisfaction, evaluating the moderating effect of the traveler type dimension on the latter. Third, this study showcases not only the importance of online robotic discourse (i.e., only reviews mentioning service robots) but also how metrics can be effectively extracted from it and used to test hypothesized relationships stemming from the analysis of extant literature. Fourth, distinctively from other studies (e.g., Orea-Giner et al., 2022), we leverage a theory-consistent framework of customer satisfaction, namely the three-factor theory, and include a wide set of control variables in our empirical models. Fifth, this is the first attempt to combine a Penalty-Reward Contrast Analysis conceived using text analytics metrics with a semi-experimental research design obtained by leveraging Propensity Score Matching in the context of human-robot interactions to ensure the robustness of the manuscript’s findings.
The study unfolds as follows. Section 2 revolves around extant human-robot interaction literature and delves deeper into the literature related to customer satisfaction showcasing the main study’s hypotheses. The data collected and the research design are reported in Section 3, while the study’s findings as well as the robustness checks conducted are presented in Section 4. In Section 5 theoretical contributions and practical implications are discussed. Lastly, Section 6 illustrates the conclusions and limitations of this work, suggesting avenues for future research.
Related Literature: Service Robots and Customer Satisfaction
Human-Robot Interaction
Stemming from robotic engineering literature, Human-Robot Interaction (HRI) can be defined as “a field of study dedicated to understanding, designing, and evaluating robotic systems for use by or with humans” (Goodrich & Schultz, 2007, p. 204). In the last few years, research in HRI has witnessed a sharp increase in interest by social science scholars (Pillai et al., 2022), due to robots being able to effectively interact with service customers (V. N. Lu et al., 2020). In addition, consumers are increasingly seeking innovative experiences through interaction with novel technological artifacts, such as service robots (Borghi & Mariani, 2022; Chuah & Yu, 2021). Thus, developing effective HRI can aid businesses in better meeting consumers’ needs (Song & Kim, 2022). Conceptually, based on scholarly definitions of service robots (see Jörling et al., 2019; Wirtz et al., 2018), it appears that the latter integrate sensory, movement, and thinking elements in a physical embodiment (I. Tussyadiah, 2020). Therefore, they can be perceived as social entities more than simple machines embedded in companies’ operations (van Doorn et al., 2017).
Yet, only recently tourism and hospitality scholars have tried to explore the novel area of HRI (Ivanov et al., 2019). Indeed, digging in-depth into the HRI framework, especially on the dimensions of presence and embodiment, Tung and Law (2017) suggested that future researchers should pay particular attention to the influence of service robots on the tourist experience. The authors’ results have been corroborated by the latest call for research on artificial intelligence and robotics in tourism conceived by I. Tussyadiah (2020) where “Assessing the Impacts of Intelligent Automation in Tourism” is seen as a fruitful avenue for future research aiming to unpack the impact of service robots on society.
Thus, to gain more knowledge about HRI in services, scholars in service and tourism research have recently started to generate empirical investigations. For instance, de Kervenoael et al. (2020) investigate consumers’ acceptance of human-robot interactions in hospitality services, combining managerial interviews with data collected from consumers of five Singaporean hospitality businesses. The authors demonstrate that the intention of using service robots in the hospitality context is not solely related to technology acceptance factors (e.g., Davis, 1989; Venkatesh et al., 2003) and service quality elements, but it is also associated with empathy and information sharing within HRIs. Their findings highlight how service robots effectively provide a differentiated experience that should be considered among the sustainable value creation activities by hospitality providers. de Kervenoael et al.’s (2020) results have been confirmed and extended by Lee et al. (2021) by leveraging a sample of potential users of robot assistants exclusively in the hotel setting. The authors categorized potential customers’ perceptions into functional and emotional aspects and based on different combinations of the latter, conceived four groups of adopters, namely “the ordinary,” “enthusiastic adopter,” “tech laggard,” and “value seeker.” Nonetheless, as portrayed by Chuah et al. (2021), adopting a more holistic approach by using complexity theory and fuzzy set qualitative comparative analysis, a high level of adoption intentions for service robots can be equally achieved with different combinations of human-likeness, technology-likeness and consumer features. Indeed, robot characteristics should be tailored to specific consumer personalities. Therefore, as suggested by Xiao and Kumar (2021) it can be argued that both firm (including employees and robots) and customer characteristics play a role in defining the degree of robotics adoption, namely “the extent of the robotics adoption that a firm employs to automate the tasks that were previously performed by human employees” (Xiao & Kumar, 2021, p. 13).
Yet, empirical research on service robotics has also focused on negative consumers’ responses stemming from the interaction with service robots (Pitardi et al., 2022). In this regard, Kim et al. (2019) argue that consumers are likely to attribute human traits to service robots. As suggested by their empirical results, a higher level of anthropomorphism of service robots boosts psychological warmth, but in turn, diminishes attitudes. This is due to the well-known phenomenon of the “uncanny valley” (Mori et al., 2012). In the same vein, Mende et al. (2019) assess how the human-like morphology of service robots can elicit discomfort and thus intensify compensatory responses in consumers. The authors found that exposure to humanoid service robots rather than a human employee can trigger negative responses (e.g., increase food consumption) as service robots are perceived as a threat to human identity. Focusing solely on the hotel industry, Jia et al. (2021) suggest that consumers are more likely to accept service robots associated with a medium-human likeness. Therefore, arguments related to service robots being able to add value to the hospitality industry might be significantly undermined by the emergence of negative consumer responses.
Yet, all the aforementioned studies leveraged survey data, observational experiments, and laboratory experiments, not taking into account self-reported human-robot interactions with services and disregarding—de facto—the service robot in the context of the overall service experience. Thus, as stressed by V. N. Lu et al. (2020) further investigation is needed in the post-service consumption phase in order to shed light on the influence of service robots on perceived overall customer satisfaction. This is a remarkable research gap, and we aim to bridge it using electronic Word-Of-Mouth (eWOM). Indeed, within the academic literature related to service robots, there is a nascent stream of research that uses online conversations to understand HRIs (Borghi & Mariani, 2021; Chuah & Yu, 2021; Fuentes-Moraleda et al., 2020; Gretzel & Murphy, 2019; M. Mariani & Borghi, 2021; Orea-Giner et al., 2022; Tung & Au, 2018). In particular, Borghi and Mariani (2021), in their quantitative examination using online reviews to understand more about service robots in tourism, found significant differences comparing the samples of online reviews mentioning the robots vis-à-vis reviews not reporting this aspect. The authors also introduced the concept of online robotic discourse defined as “eWOM in online reviews mentioning explicitly service robots deployed in hospitality services” (Borghi & Mariani, 2021, p. 2). As suggested by the authors online robotic discourse can aid scholars to understand the impact of service robots in companies’ operations. Also, Fuentes-Moraleda et al. (2020) used self-reported online conversations to understand the principal dimensions and features referred to by guests after HRI in the hotel industry. The authors’ findings highlight how comments are mainly related to the functional dimension (adherence to social norms, ease of use and usefulness) of this new kind of service interaction and that different traveler type (e.g., couple, family, business and solo) seems to have a rather consistently positive response to HRIs. Borghi and Mariani’s findings have been confirmed and extended by Orea-Giner et al. (2022) that also suggest that positive and negative emotions stemming from HRI in the hotel industry affect guests’ overall perceived customer satisfaction. The latter holds for different robot typologies as well as different traveler types. Nonetheless, there is no comprehensive study taking into account the post-service consumption phase that uses a theory consistent framework of customer satisfaction and includes in the analysis a wide range of control variables to ensure the robustness of the estimate results. Besides, despite being considered by all means as a potential moderator (Fuentes-Moraleda et al., 2020; Orea-Giner et al., 2022; Tung & Au, 2018), the traveler type dimension has been analyzed in isolation and not included as a moderator in a more comprehensive empirical model. As such, we build on online robotic discourse to empirically analyze a large sample of self-reported service interactions, by leveraging the three-factor theory of customer satisfaction (Cadotte & Turgeon, 1988), trying to discern to what extent service robots influence customers’ overall satisfaction with the entire service offering and whether this effect is moderated by the traveler type.
Customer Satisfaction With Services
In academic literature, over time, the nature of the concept of customer satisfaction has unfolded in a rather complex manner (Anderson et al., 2004). Overall, it can be perceived as a psychological concept revolving around the feeling of pleasure and well-being stemming from the consumption activities of a product and/or service (World Tourism Organization, 1985). Several literature streams have tried to provide an explanation of the origin of the concept. For instance, Oliver (1980) in the broad field of marketing research, proposed the expectation-disconfirmation paradigm whereby individuals compare their expectations with the real product or service experience to originate satisfaction. Therefore, the latter has a unidimensional nature. Yet, over time, scholars in quality management research have challenged the theory suggested by Oliver (1980). In particular, the main critique can be associated with the seminal work of Herzberg et al. (1959) who devised the motivation-hygiene theory also labeled as the two-factor theory. The authors suggested that satisfaction and dissatisfaction are two separate concepts and, in turn, part of two different continua. However, elements included in the product or service offering could have acted only in one of the two continua. More recently, Kano et al. (1984) extended the model proposed by Herzberg et al. (1959), arguing that a multi-factor structure is needed to understand how service attributes contribute to originate consumer satisfaction. Therefore, differently from the two-factor theory, the authors suggest individual elements able to act either in the dissatisfaction or in the satisfaction continua simultaneously. The model proposed by Kano et al. (1984)’s allows researchers to classify service attributes into five distinctive categories. Yet, a simplified and refined version, which leverages three factors, has been usually embraced by scholars in customer satisfaction research (Gregory & Parsa, 2013).
Over the last two decades, the three-factor model has been widely acknowledged as a relevant research framework able to effectively capture the nature of customer satisfaction (Bi et al., 2020; Pizam et al., 2016). In the tourism and hospitality research domain, after the seminal contribution of Cadotte and Turgeon (1988) who suggested the existence of an asymmetrical influence of service attributes on customer satisfaction, there has not been enough support to further verify the validity of their results, using the novel three-factor theory of customer satisfaction (Pizam et al., 2016). Nonetheless, the study by Alegre and Garau (2010) confirmed the view of Cadotte and Turgeon (1988) testing different models of customer satisfaction. Based on Alegre and Garau (2010) findings, other researchers have gradually started exploring the impact of several service features on overall customer satisfaction, deploying the three-factor theory of customer satisfaction as their reference conceptual model (e.g., Alegre & Garau, 2011; Bi et al., 2020; Gerdt et al., 2019; W. Lu & Stepchenkova, 2012).
Delving deeper into its structure, as asserted by Cadotte and Turgeon (1988), the three-factor theory encompasses three distinctive sets of dimensions. First, we have basic factors, which comprise the core elements of the offering which are essential in the consumer experience. Yet, their fulfilment does not automatically guarantee satisfaction. Indeed, the association between satisfaction and basic factors’ performance is asymmetrical. This is because high performance entails lower benefits toward satisfaction when compared with low performance. An example of this dimension is the bill’s accuracy (Cadotte & Turgeon, 1988). Indeed, hotel guests would expect a flawless experience regarding this attribute (e.g., also in presence of a billing mistake—low performance—this should be amended quickly). Yet, displaying high performance (e.g., trying to avoid billing mistakes at any cost) would not necessarily translate into customer satisfaction. Second, we have performance factors. They represent attributes which can act either in the dissatisfaction or satisfaction continua in the presence of low or high performance respectively. Therefore, there is a symmetric and linear association between these attributes’ performance and satisfaction. For instance, establishment cleanliness is considered a performance factor (Cadotte & Turgeon, 1988). Therefore, a high level of cleanliness will result in satisfaction while a lower level of cleanliness will bring dissatisfaction. Third, those elements of the product/service offering whose absence does not dissatisfy the consumer, but whose presence can generate satisfaction are labeled as excitement factors. In this case, the association between satisfaction and attribute performance is asymmetrical. Interestingly, high performance related to excitement factors consistently outweighs the effect on satisfaction compared to low performance. As per Cadotte and Turgeon’s (1988) results, employees’ helpful attitude is perceived by the guest as an excitement factor.
However, despite its great explanatory power (Bi et al., 2020), three-factor theory (Cadotte & Turgeon, 1988) has not been used to assess the impact of HRI on perceived customer satisfaction.
Human-Robot Interaction and Customer Satisfaction
Positive Human-Robot Interaction
This section tries to assess the impact of positive performance stemming from HRI in services by leveraging service innovation literature and its application to HRI. In the broad landscape of service innovation, scholars argue that competitive advantage is usually achieved as a result of the technological novelty related to the new service added to the company offering (Evangelista & Vezzani, 2010). As highlighted by Hjalager (2010) this expectation holds also in the tourism and hospitality industry. In particular, as depicted in the comprehensive literature review performed by Gomezelj (2016), innovation activities and behaviors seem to be positively correlated with firm performance, productivity, quality standards and firm value. However, the recent study by Martin-Rios and Ciobanu (2019) suggested that for tourism firms only complex innovations, embedding technological and non-technological forms of innovation, are able to increase company performance. As argued by de Kervenoael et al. (2020) HRI in services conceptually represents a complex innovation. This is because the introduction of service robots is associated with (1) a technological element related to the provision of a novel (or enhanced) delivery method and (2) a non-technological element since they alter companies’ promotional activities and the internal division of work. Thus, since customer satisfaction is considered a non-financial performance metric, we can argue that service robots can positively impact customer satisfaction. Extant HRI studies seem to support this line of thought whereby the perceptions of uniqueness and novelty can result in the co-creation of innovative experiences (Tung & Au, 2018). This can not only go beyond customer expectations (Stock & Merkle, 2018) but ultimately generate customer delight (Oliver et al., 1997). As claimed by Ivanov and Webster (2020) service robots should make the delivery process more “funny and entertaining.” Tung and Au’s (2018) empirical findings align with this view, suggesting positive and pleasant surprises related to HRI. Adding to this, Fuentes-Moraleda et al. (2020) found that the majority of travelers concur service robots perform an efficient and useful function, while Orea-Giner et al. (2022) assess how “joy” is the most relevant emotion arising from HRIs. Moreover, Stock and Merkle (2018) suggest HRI is able to consistently exceed consumer expectations and be rated higher than interactions with service employees. This aligns with Borghi and Mariani’s (2021) exploratory results whereby higher ratings are attributed to the sample of self-reported HRIs vis-à-vis online reviews not taking into account HRIs. Thus, this might reasonably imply that a positive performance stemming from HRI can arouse a higher sense of pleasure for the service customers that, in turn, can exceed tourists’ expectations. Therefore, leveraging the innovation literature (Evangelista & Vezzani, 2010; Gomezelj, 2016; Hjalager, 2010; M. M Mariani et al., 2023; Martin-Rios & Ciobanu, 2019), and the empirical evidence of its application in the HRI literature (Borghi & Mariani, 2021; Fuentes-Moraleda et al., 2020; Orea-Giner et al., 2022; Stock & Merkle, 2018; Tung & Au, 2018) we argue that:
Negative Human-Robot Interactions
The interaction with service robots is not prone to failure and can elicit negative emotions (Fuentes-Moraleda et al., 2020; Orea-Giner et al., 2022; Tung & Au, 2018). In this respect, attribution theory has been extensively leveraged to understand the influence of performance valence, investigating to whom the service customer attributes the responsibility for the performance (Miller & Ross, 1975; Moon, 2003). In this context, Miller and Ross (1975) have highlighted the existence of a self-serving bias, conceptualized as the tendency of the service customers to attribute positive performance to themselves (internally) and associate negative performance with the entity which is delivering the service (externally). As suggested by Moon (2003) empirical evidence supports the existence of self-service bias in a wide range of contexts. In other terms, when a failure happens in HRI, the responsibility for the negative performance is more likely to be attributed to the robot by the customer, hence originating dissatisfaction. This is confirmed by recent empirical studies on HRIs. Indeed, Kim et al. (2019) suggest that robots can provoke negative attitudes, while Mende et al. (2019) assess how they can elicit discomfort and thus intensify compensatory responses in consumers. Moreover, robotic failures in the hospitality sector (e.g., long waiting times for room service delivery or misunderstanding in conversation and language comprehension) generate a sense of frustration, anger and insecurity in the service customer (Fuentes-Moraleda et al., 2020). As portrayed by Orea-Giner et al. (2022) negative emotions (mainly disgust) are significantly associated with the rating of different types of service robots in the hotel setting, such as cloakroom, concierge and room service robots. The authors also extend their results to different traveler’s typologies. Despite the expression of “joy” from HRI being the most relevant emotion in the explanation of a given review rating, negative emotions not only exist but significantly impact the score assigned by all considered traveler types. Therefore, we might argue that the self-service bias extends to HRI in the hotel setting. Thus, building on the attribution theory literature (Miller & Ross, 1975; Moon, 2003) and the empirical evidence related to negative consumer responses to HRI in services (Fuentes-Moraleda et al., 2020; Kim et al., 2019; Mende et al., 2019; Orea-Giner et al., 2022) we hypothesize that:
The Moderating Effect of Travel Type on the Relationship Between Service Robots’ Performance and Overall Perceived Satisfaction
Socio-demographic indicators, such as gender, age and culture can influence service customer online ratings (M.M. Mariani, Borghi, & Kazakov, 2019; M. M. Mariani et al., 2020) and service customers’ acceptance of technologies—especially robotics (Fuentes-Moraleda et al., 2020). However, scholars examining HRI in services argue that also the travel type dimension plays a critical role to determine customers’ perceptions (Rodriguez-Lizundia et al., 2015). This association has been investigated by recent exploratory empirical studies on service robotics. For example, Fuentes-Moraleda et al. (2020) used the travel type to assess the research question “Which specific factors influence robots’ interaction with different types of hotel users?.” The authors’ results conclude that: “Most travellers agree that robots perform a useful, efficient function. The different types of travellers express their emotion about robots in different ways, albeit mostly in a positive sense (happy, super, fantastic and fabulous). The segment of families with children is particularly noteworthy due to their special liking for robots. Business travellers establish relationships through the robot’s conversation and ability to translate, while other travellers engage in conversations to obtain information or to talk to the robot.” (Fuentes-Moraleda et al., 2020, p. 9). Therefore, it seems that the positive effect is homogeneous across the different traveler type dimensions which have been individually analyzed. Yet, different traveler types focus on different aspects of their HRI when posting the evaluation of their stay. Fuentes-Moraleda et al.’s (2020) findings are—to a certain extent—confirmed by Orea-Giner et al. (2022). Indeed, the authors answering the research question “Is there a relationship between the overall rating of hotels (TripAdvisor) and the emotions and sentiments derived from HRI terms expressed by traveler type?” found that there is a relevant impact on the ratings given by couple, family, solo or business travelers as the “joy” emotion arises when dealing with a robot, especially for family travelers with children (Orea-Giner et al., 2022, pp. 7 and 8). The latter result is in line with Tung and Au’s (2018) qualitative findings. However, despite some differences in the significance levels of some emotions (e.g., surprise and trust), the regression coefficients of the estimates presented in Tables 5 and 6, taking into account only a specific traveler type, seem rather homogeneous (see Orea-Giner et al., 2022, p. 7).
Yet, the abovementioned studies have evaluated the traveler type dimensions in a rather exploratory manner and answered research questions using different samples of traveler types in isolation, not combining them into a single regression model. Adding to this, their findings do not seem to highlight significant differences/patterns that would imply the association of a higher or lower rating score with a specific traveler category. Only families seem to particularly like service robots; however, there is no empirical evidence that this will prove significant when considering general reviewing behavior associated with families (e.g., the direct effect of families on overall perceived satisfaction). Therefore, based on the empirical results stemming from the studies of Fuentes-Moraleda et al. (2020) and Orea-Giner et al. (2022), we argue that the traveler type is not likely to moderate significantly the positive (negative) influence of the positive (negative) performance of service robots on the overall perceived satisfaction. Since it is not statistically appropriate to conceive a hypothesis that cannot be rejected, namely a null hypothesis, we do not formulate one for the moderating effect of traveler type. Yet, we display the effect in our empirical analysis and results.
Data and Methods
In terms of the empirical sample, we decided to use online reviews (ORs) for hotels that have embedded service robots in their operations. This choice was guided by the fact that OR data are considered more abundant and objective since they “are posted spontaneously without laboratory effects unlike traditional questionnaires” (Schuckert et al., 2015, p. 143). To test our hypotheses, we deploy Penalty-Reward Contrast Analysis through an ordered logit estimation technique. Lastly, to reduce potential endogeneity issues and assess the robustness of our main findings we re-run all the analyses using a sample obtained through Propensity Score Matching (see Section 4.2).
Empirical Context and Data Collection
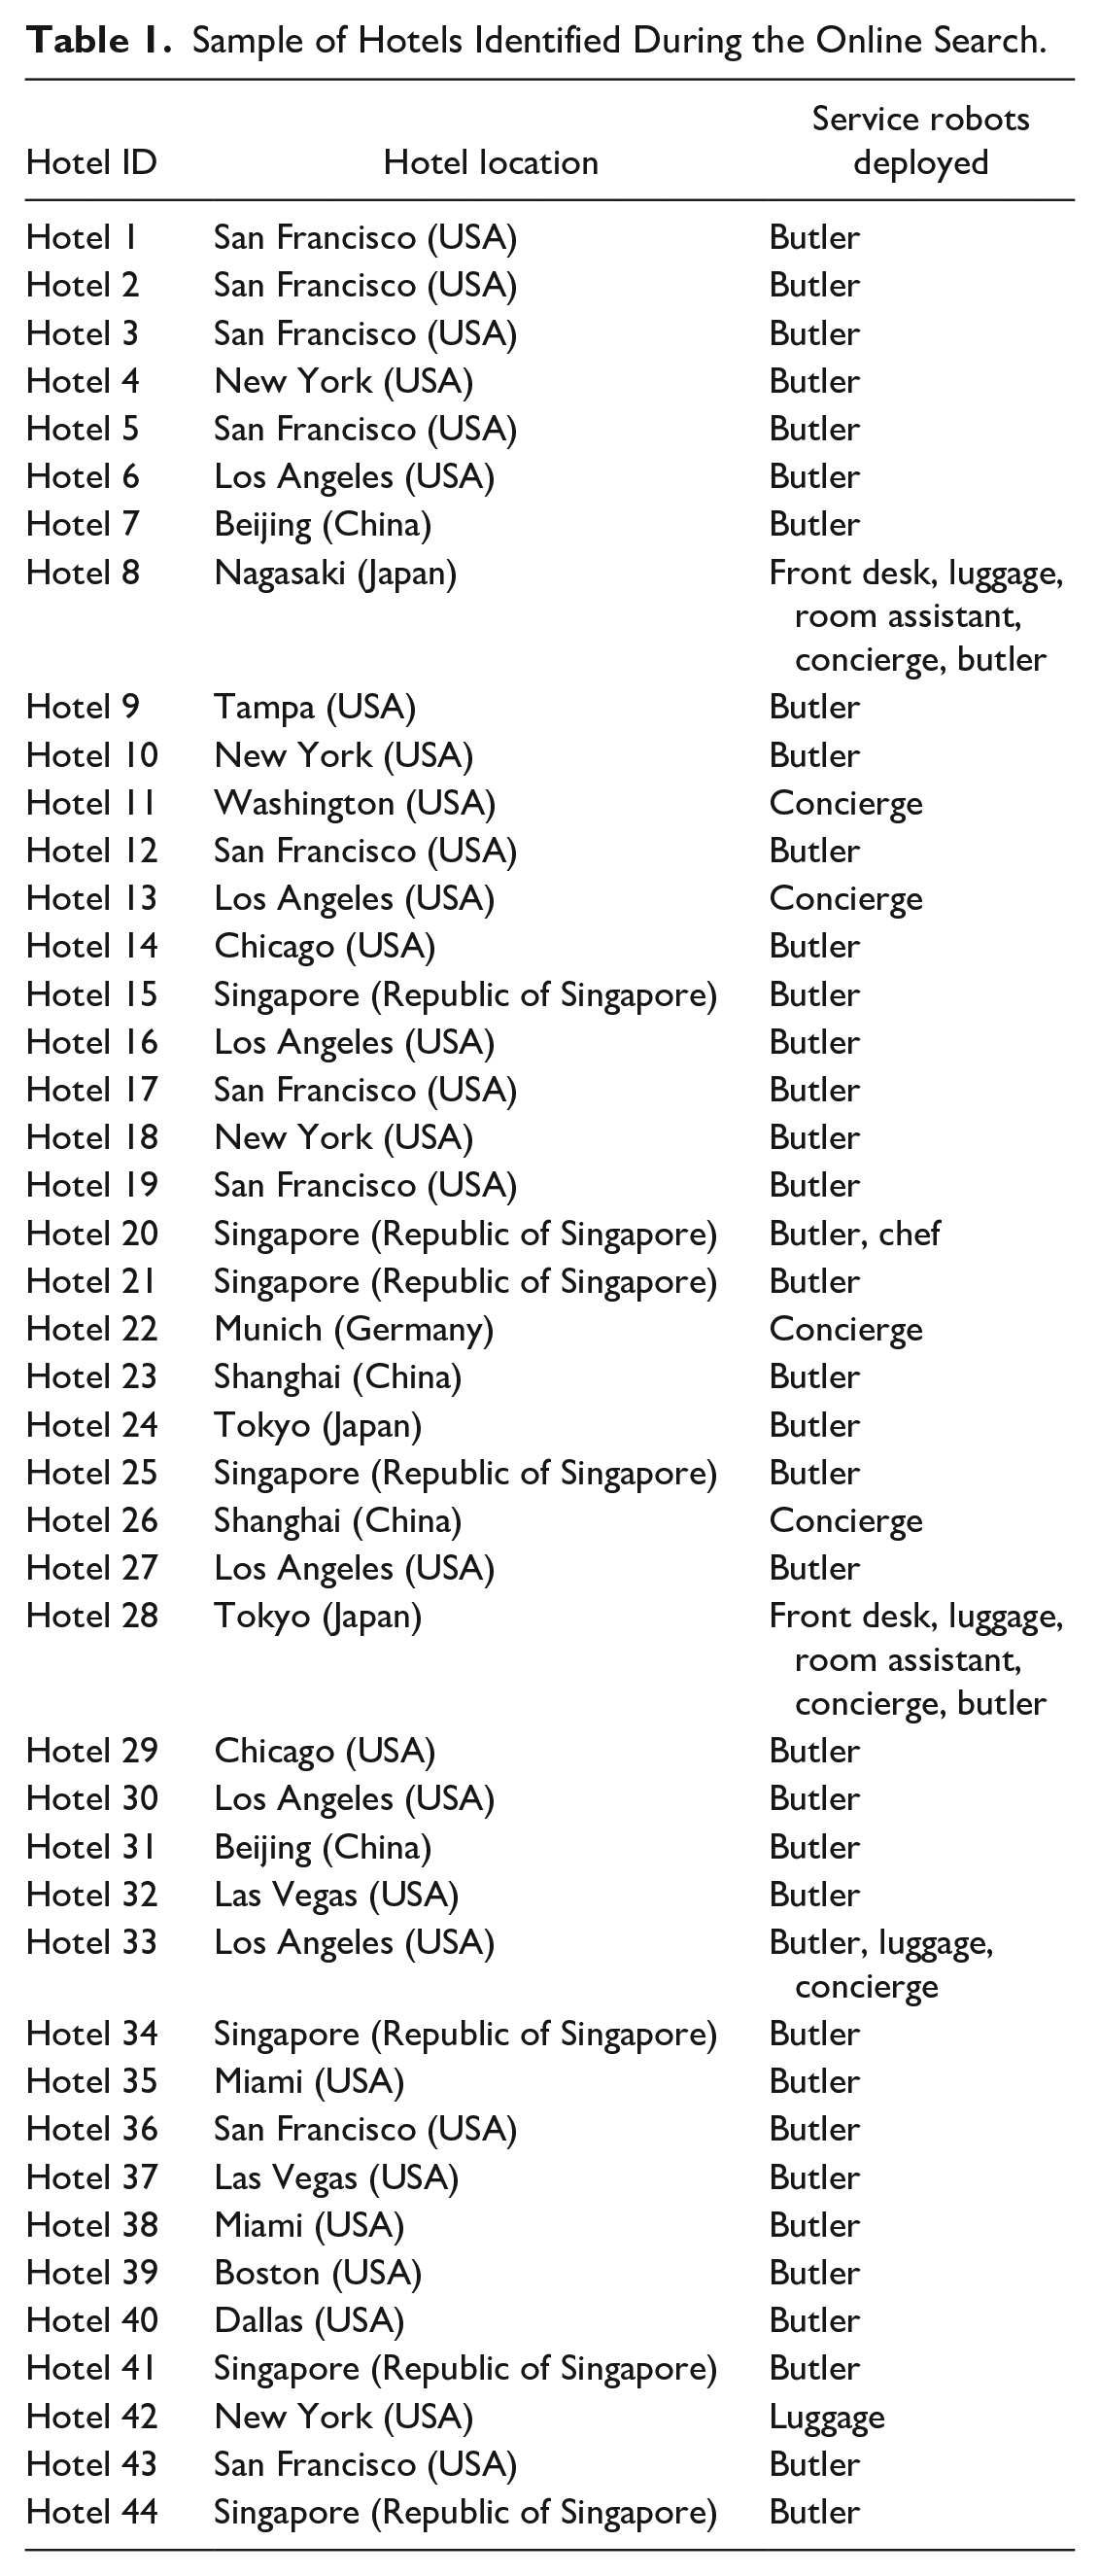
To find hotels that have deployed service robots worldwide we conducted an extensive online research combining keywords associated with service robots in the hotel domain (see Ivanov et al., 2017) with the search term “hotel,” on the leading worldwide search engine Google. This led to identify 44 international hotels embedding service robots in their operations that were used as the overall sample for this study (see Table 1). Secondly, in order to collect further information about the service robots deployed (such as introduction date and robots’ names), we performed a second research for each hotel identified in the first step. To this aim, we triangulated material available in the company reports, website and social media profiles and news about the company. Based on the aforementioned sample of 44 hotels, we collected the entire population of ORs made publicly available on TripAdvisor. The latter was selected as it is the largest community-based OR platform and because ORs hosted on the platform influence company performance (Yang et al., 2018). Moreover, during the data collection process, we simulated the interaction of an English user on TripAdvisor to collect—through the automatic translation function made available on the OR platform—the English translation of ORs not written in English. This step of data collection was carried out in November 2019. Therefore, for the purposes of the project, only ORs published in the reviewing platform before October 2019 (included) were retained for the empirical analyses. In terms of volume, we collected 69,497 ORs representing the entire population of ORs on TripAdvisor for the 44 international hotels identified in the first search step. Yet, for the final empirical sample, we decided to select solely user-generated content created after the hotel’s adoption of service robots. This choice was made to ensure that the service robot was part of the hotel’s operations during the guest’s stay. Besides, due to the importance of the travel type dimension during HRI (i.e., Tung & Au, 2018) and its impact on customer satisfaction (Bi et al., 2020), we retained only ORs that reported the travel type. These sampling criteria led us to leverage a sample of 32,985 ORs for the econometric analyses. Furthermore, a series of metadata available on TripAdvisor for each OR and hotel profile has been collected to devise the control variables used in the study.
Sample of Hotels Identified During the Online Search.
Operationalization of the Focal and Control Variables
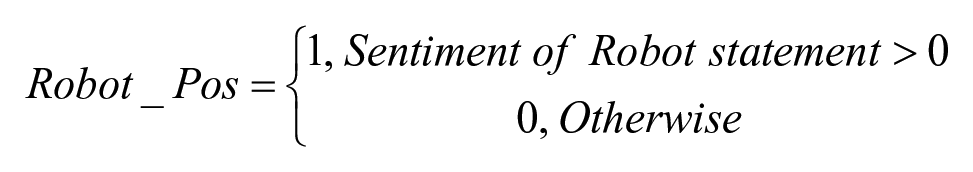
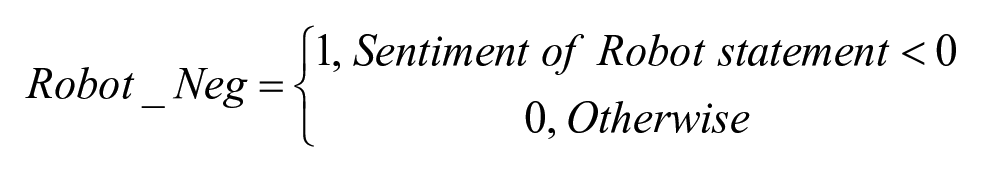
In order to test the main hypotheses, put forward by the study we leveraged the Penalty-Reward Contrast Analysis (PRCA) introduced by Brandt (1987). This technique has been found to provide reliable results in a wide range of application fields (Albayrak & Caber, 2013) and it has been recently adopted in the context of ORs (Bi et al., 2020). Essentially, the purpose underlying the adoption of PRCA is to assess the impact of service attributes at different levels of performance (i.e., positive or negative) through the introduction of dummy variables in a regression analysis (Albayrak & Caber, 2013). As such, for the focal service attribute under investigation, namely service robots, two dummy variables were conceived. On the one hand, as the penalty variable, Robot_Neg identifies situations where unfavorable performances related to the performance of a service robot’s interaction occurred. On the other hand, Robot_Pos, under the guise of the reward variable, refers to situations where a favorable performance materialized.
To operationalize the aforementioned measures, following an automated process, we leveraged recent progress in the literature encompassing big data analytics and eWOM (Alaei et al., 2019; Bi et al., 2019; M. Mariani & Wirtz, 2023). Thus, we measured the performance associated with the focal service attribute (i.e., service robot) through the overall sentiment polarity score (i.e., sentiment strength) extracted from the fragments of text related to the analyzed aspect. In particular, we followed the methodology highlighted by Bi et al. (2019) for selecting the portions of texts mentioning service robots and the recommendations of Alaei et al. (2019) on which sentiment analyzer to apply. Thus, based on the punctuations, we first divided each OR into a set of sentences, then we aggregated all the sentences containing at least a keyword related to the focal service attribute (i.e., service robots) into one sentence (Bi et al., 2019). We considered the latter as the portion of text directly related to the evaluation of service robots. In line with Tung and Au (2018), we used the word “robot” and the name of the robot as robot-related keywords. To ensure reliability, three researchers manually examined a random sample of 800 ORs each (a total of 2,400 ORs) evaluating whether they referred to service robots. For the random sample, the three researchers’ evaluations were consistent with the results of the computer-based algorithm deployed to extract the sentences related to service robots in 98.8% of the cases.
At this stage, in order to obtain the sentiment polarity score for a specific piece of text we had to select the most suitable sentiment analysis technique. Accordingly, on the ground provided by one of the latest studies by Alaei et al. (2019) —who compared and assessed a wide range of sentiment analysis techniques in the tourism and hospitality domain—we exploited the Valence Aware Dictionary for sEntiment Reasoning (VADER) method (Hutto & Gilbert, 2014) which achieved the highest performance results in the multiclass classification scenario.
Thus, the two dummy variables related to HRI performance were operationalized as follows for each single OR retrieved:
Based on the realizations, in terms of econometric coefficients, of the abovementioned two dummy variables, scholars adopting PRCA have developed classification schemes able to effectively allocate attributes in the three-factor theory of customer satisfaction. In this study, we use the classification method proposed by Lin et al. (2010) based on the statistical significance of the econometric coefficients. Therefore, service robots will be classified as basic factor if the dummy related to negative performances (e.g., Robot_Neg in this case) is significant and the dummy related to positive performances (e.g., Robot_Pos in this case) is not statistically significant. Otherwise, they will be categorized as performance factors if the dummy related to positive performances and the dummy related to negative performances are significant. Lastly, service robot will be referred to as an excitement factor if the dummy related to positive performances is significant and the dummy related to negative performances is not significant. In the literature review about PRCA performed by Albayrak and Caber (2013), this method is considered among the classification techniques that scholars can choose to effectively map attributes in the three-factor theory of customer satisfaction.
According to extant eWOM literature, a wide range of metrics have been found to significantly impact the overall rating provided by an online reviewer. Therefore, in our model specification, we embedded a set of control variables related to the reviewer, platform, content, company and temporal dimensions. More specifically, at the platform-level, since reviewers have been found to be socially influenced by previous online ratings posted on the OR platform (Sridhar & Srinivasan, 2012), we included the average rating observed by the reviewer prior to submitting her own judgment of the hotel experience (Observed average Rating). As far as the reviewer-level is concerned, in line with Gao et al. (2018), we embedded in the econometric model the effect of reviewer experience (Reviewer Contribution), using the number of contributions in terms of the number of posts on the OR platform. This is due to the fact that a novice judges a service differently from an expert (Bendapudi & Berry, 1997). Moreover, according to Forman et al. (2008), the level of information disclosed by online reviewers can have an effect on their online rating behaviors. Therefore, we developed a dummy variable (No Identity Disclosure) as a control, assuming the value of 1 when the reviewer had not disclosed either gender or age (Gao et al., 2018).
Furthermore, following extant research referring to the impact of textual OR cues on customer satisfaction, we capture the effect of the overall polarity of the reviewer text (Overall Sentiment Polarity) and the length of the review text (Review Length). The underlying reason is that there seems to be a positive correlation between review sentiment and the OR ratings (Geetha et al., 2017), and longer reviews are more likely to be associated with negative ratings (Poncheri et al., 2008). Sentiment analysis is “an automated process of examining semantic relationships and meaning in reviews” (Alaei et al., 2019, p. 175) whereby a polarity score is obtained by inferring the semantic orientation related to a target entity (Bi et al., 2019). In our case, controlling for the Overall Sentiment Polarity allows to set the correct reference point in terms of overall content polarity for every analyzed review. This is of paramount importance when assessing the impact of service robots since it helps to effectively discern whether the focal service attribute analyzed stands out from the evaluation of the service offer. Moreover, we control for the purpose of the trip (Travel Type) and the year (Year) (Bi et al., 2020; Godes & Silva, 2012). Finally, we capture potential heterogeneity at the hotel level, controlling for the hotel star rating (Star Rating), the fact that the hotel belongs to a chain (Chain) and further, including an individual hotel identifier (Hotel ID).
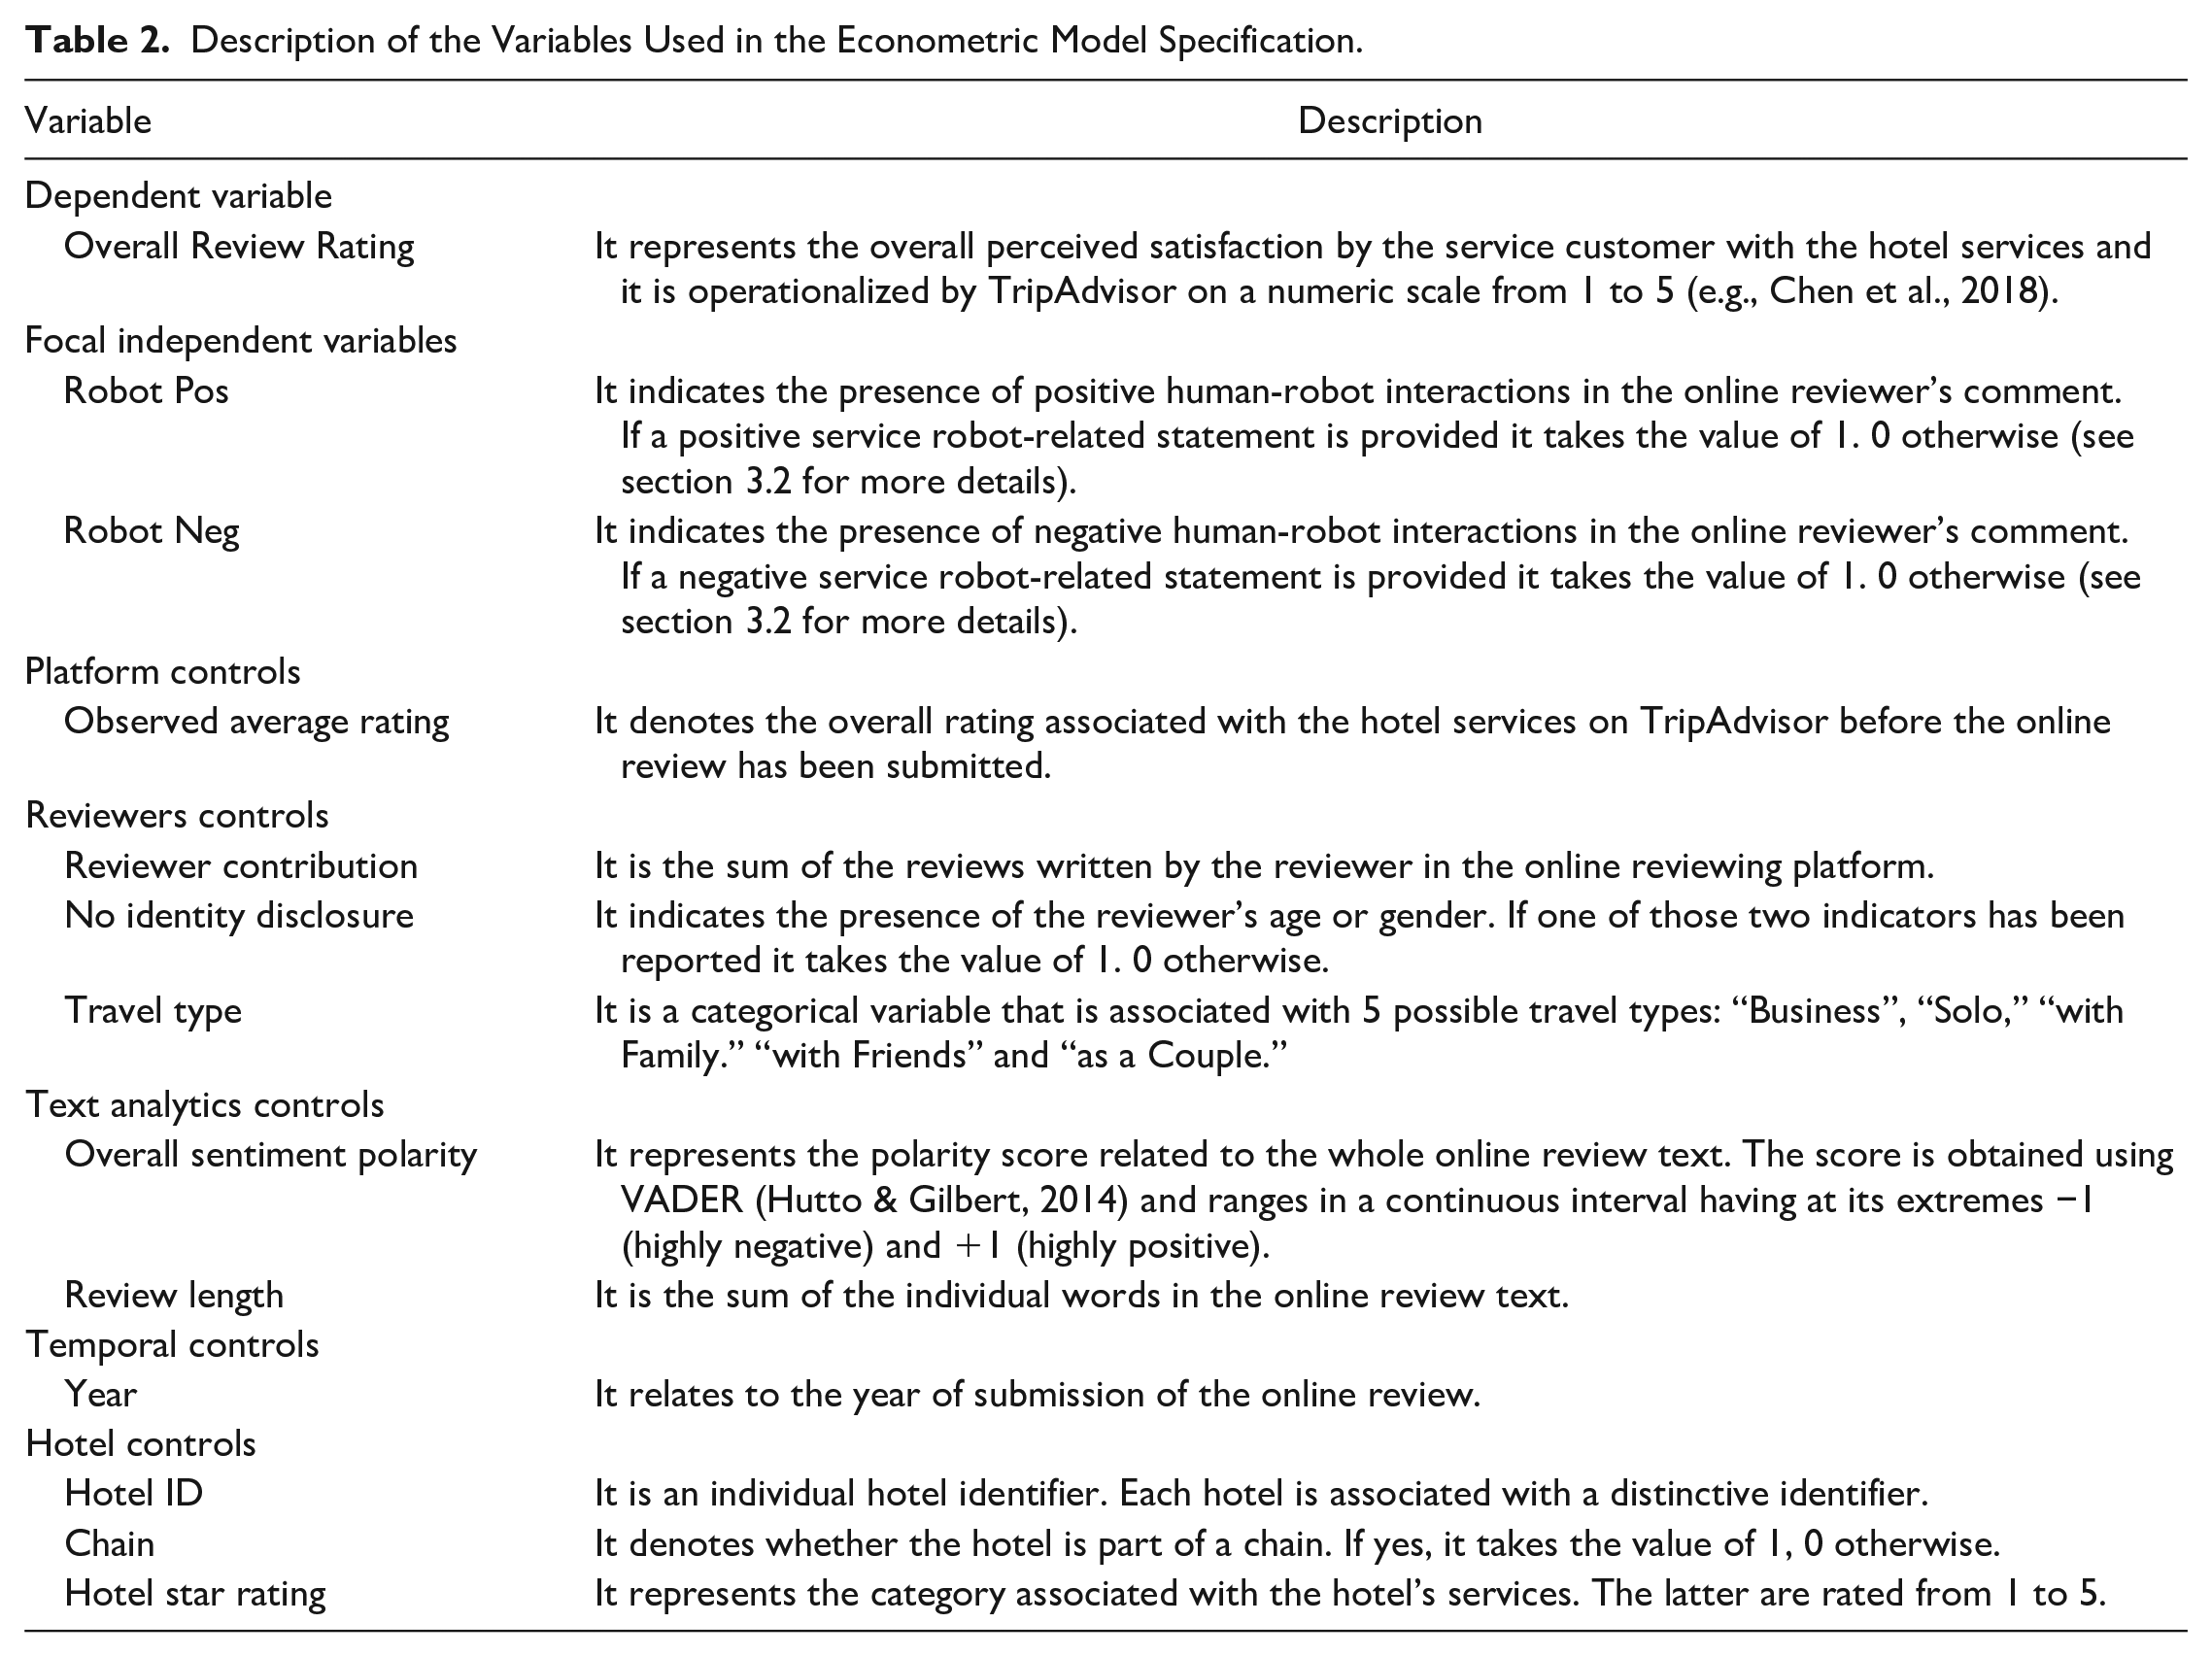
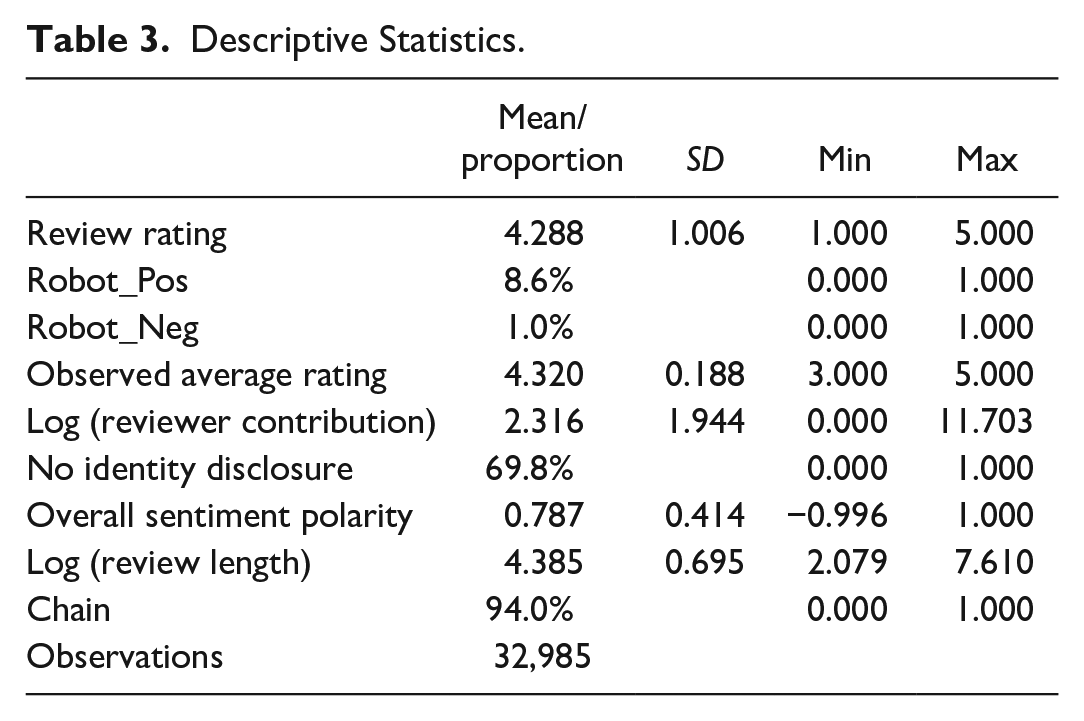
All the variables’ descriptions are briefly reported in Table 2, whereas Table 3 displays their descriptive statistics. Looking in detail at the figures in Table 3, the collected ORs show an average review rating (4.288) in the upper end of the ordinal scale of TripAdvisor. This inflation of positive ratings is in line with extant eWOM research (e.g., M. M. Mariani & Borghi, 2018; Sridhar & Srinivasan, 2012). Regarding service robots’ evaluation, 8.6% of ORs favorably mentioned this service attribute, while solely 1% of the overall sample left a negative statement. Aware that these low percentages could potentially undermine the reliability of the estimation results, we conducted a robustness check on a balanced sample (see Section 4.2). Besides, due to the high skewness of the distribution of Reviewer Contribution and Review Length, we included in the model their logarithmic transformation.
Description of the Variables Used in the Econometric Model Specification.
Descriptive Statistics.
Model Specification
To conduct the empirical examination, testing the two focal hypotheses, we decided to deploy an ordered logit model. The choice was guided by the fact that the dependent variable (i.e., the Overall Review Rating) is ordered, discrete and not normally distributed (Sridhar & Srinivasan, 2012). Indeed, TripAdvisor lets online reviewers express their satisfaction through an ordinal scale of five consecutive values: “Terrible” = 1, “Poor” = 2, “Average” = 3, “Very Good” = 4, “Excellent” = 5. As highlighted by Agresti (2010), ordinal regression approaches, accounting for the “floor effect” and the “ceiling effect,” provide less biased estimates compared to linear regression analyses (i.e., Ordinary Least Square) in presence of ordinal categorical dependent variables. Among ordinal regression models, the two most used methods are the logit and probit, which differ in the assumptions made regarding the error terms’ distribution (Zhang et al., 2016). In this regard, following the lead of researchers in marketing and tourism management examining online ratings (e.g., Gao et al., 2018; Godes & Silva, 2012; Zhang et al., 2016), we opted for the ordered logit model, implicitly assuming that the error term distribution can be approximated by a logistic function.
More specifically, representing with
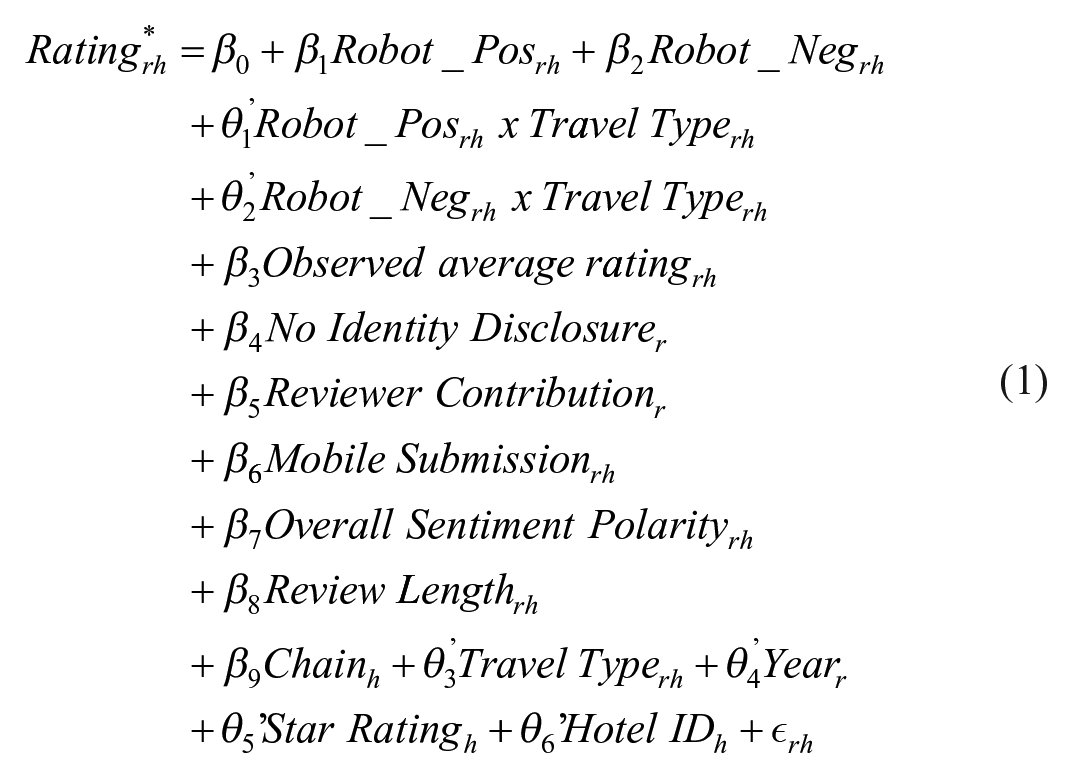
where
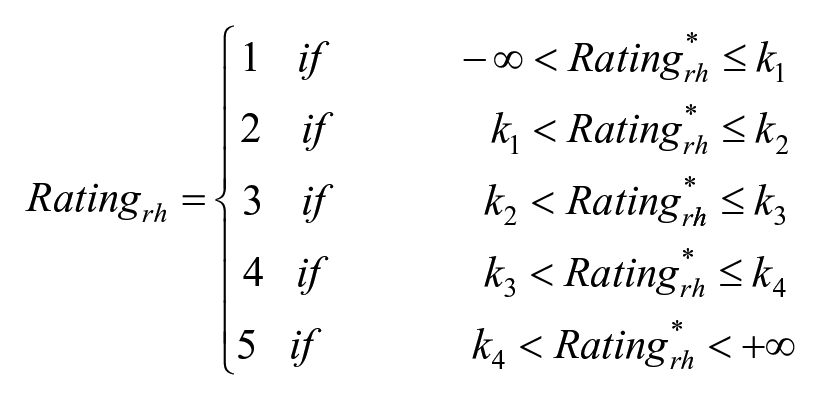
In the abovementioned rules, the different realization of the variables (i.e., values from 1 to 5) corresponds to the scores allowed by TripAdvisor, whereas k1, k2, k3, k4 represent the set of four cut-off points determined by the model. The latter are used to discern the specific discrete ordinal response from the predicted latent rating. In this process, the model implicitly assumes the values of
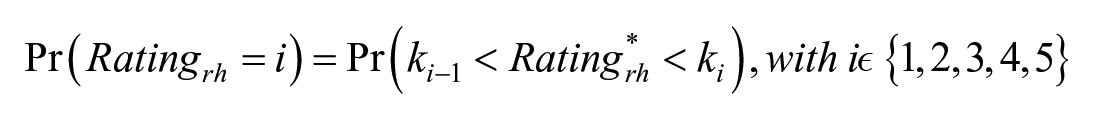
where i refers to the set of discrete outcomes and
For the purposes of the study, in Equation 1, our main interest was related to the coefficients
Findings
Main Findings
The empirical results of the study are unveiled in Table 4, where the econometric coefficients of the model specification described in Equation 1 are presented. As clear from Model 1, Robot_Pos shows a positive and statistically significant coefficient p < .001). Therefore, as expected in HP1, a positive performance stemming from human-robot interaction increases the chances of online reviewers posting higher review ratings, which translates into higher overall customer satisfaction. On the contrary, Robot_Neg displays a negative but not significant coefficient (
Estimation Results Ordered Logistic Models.
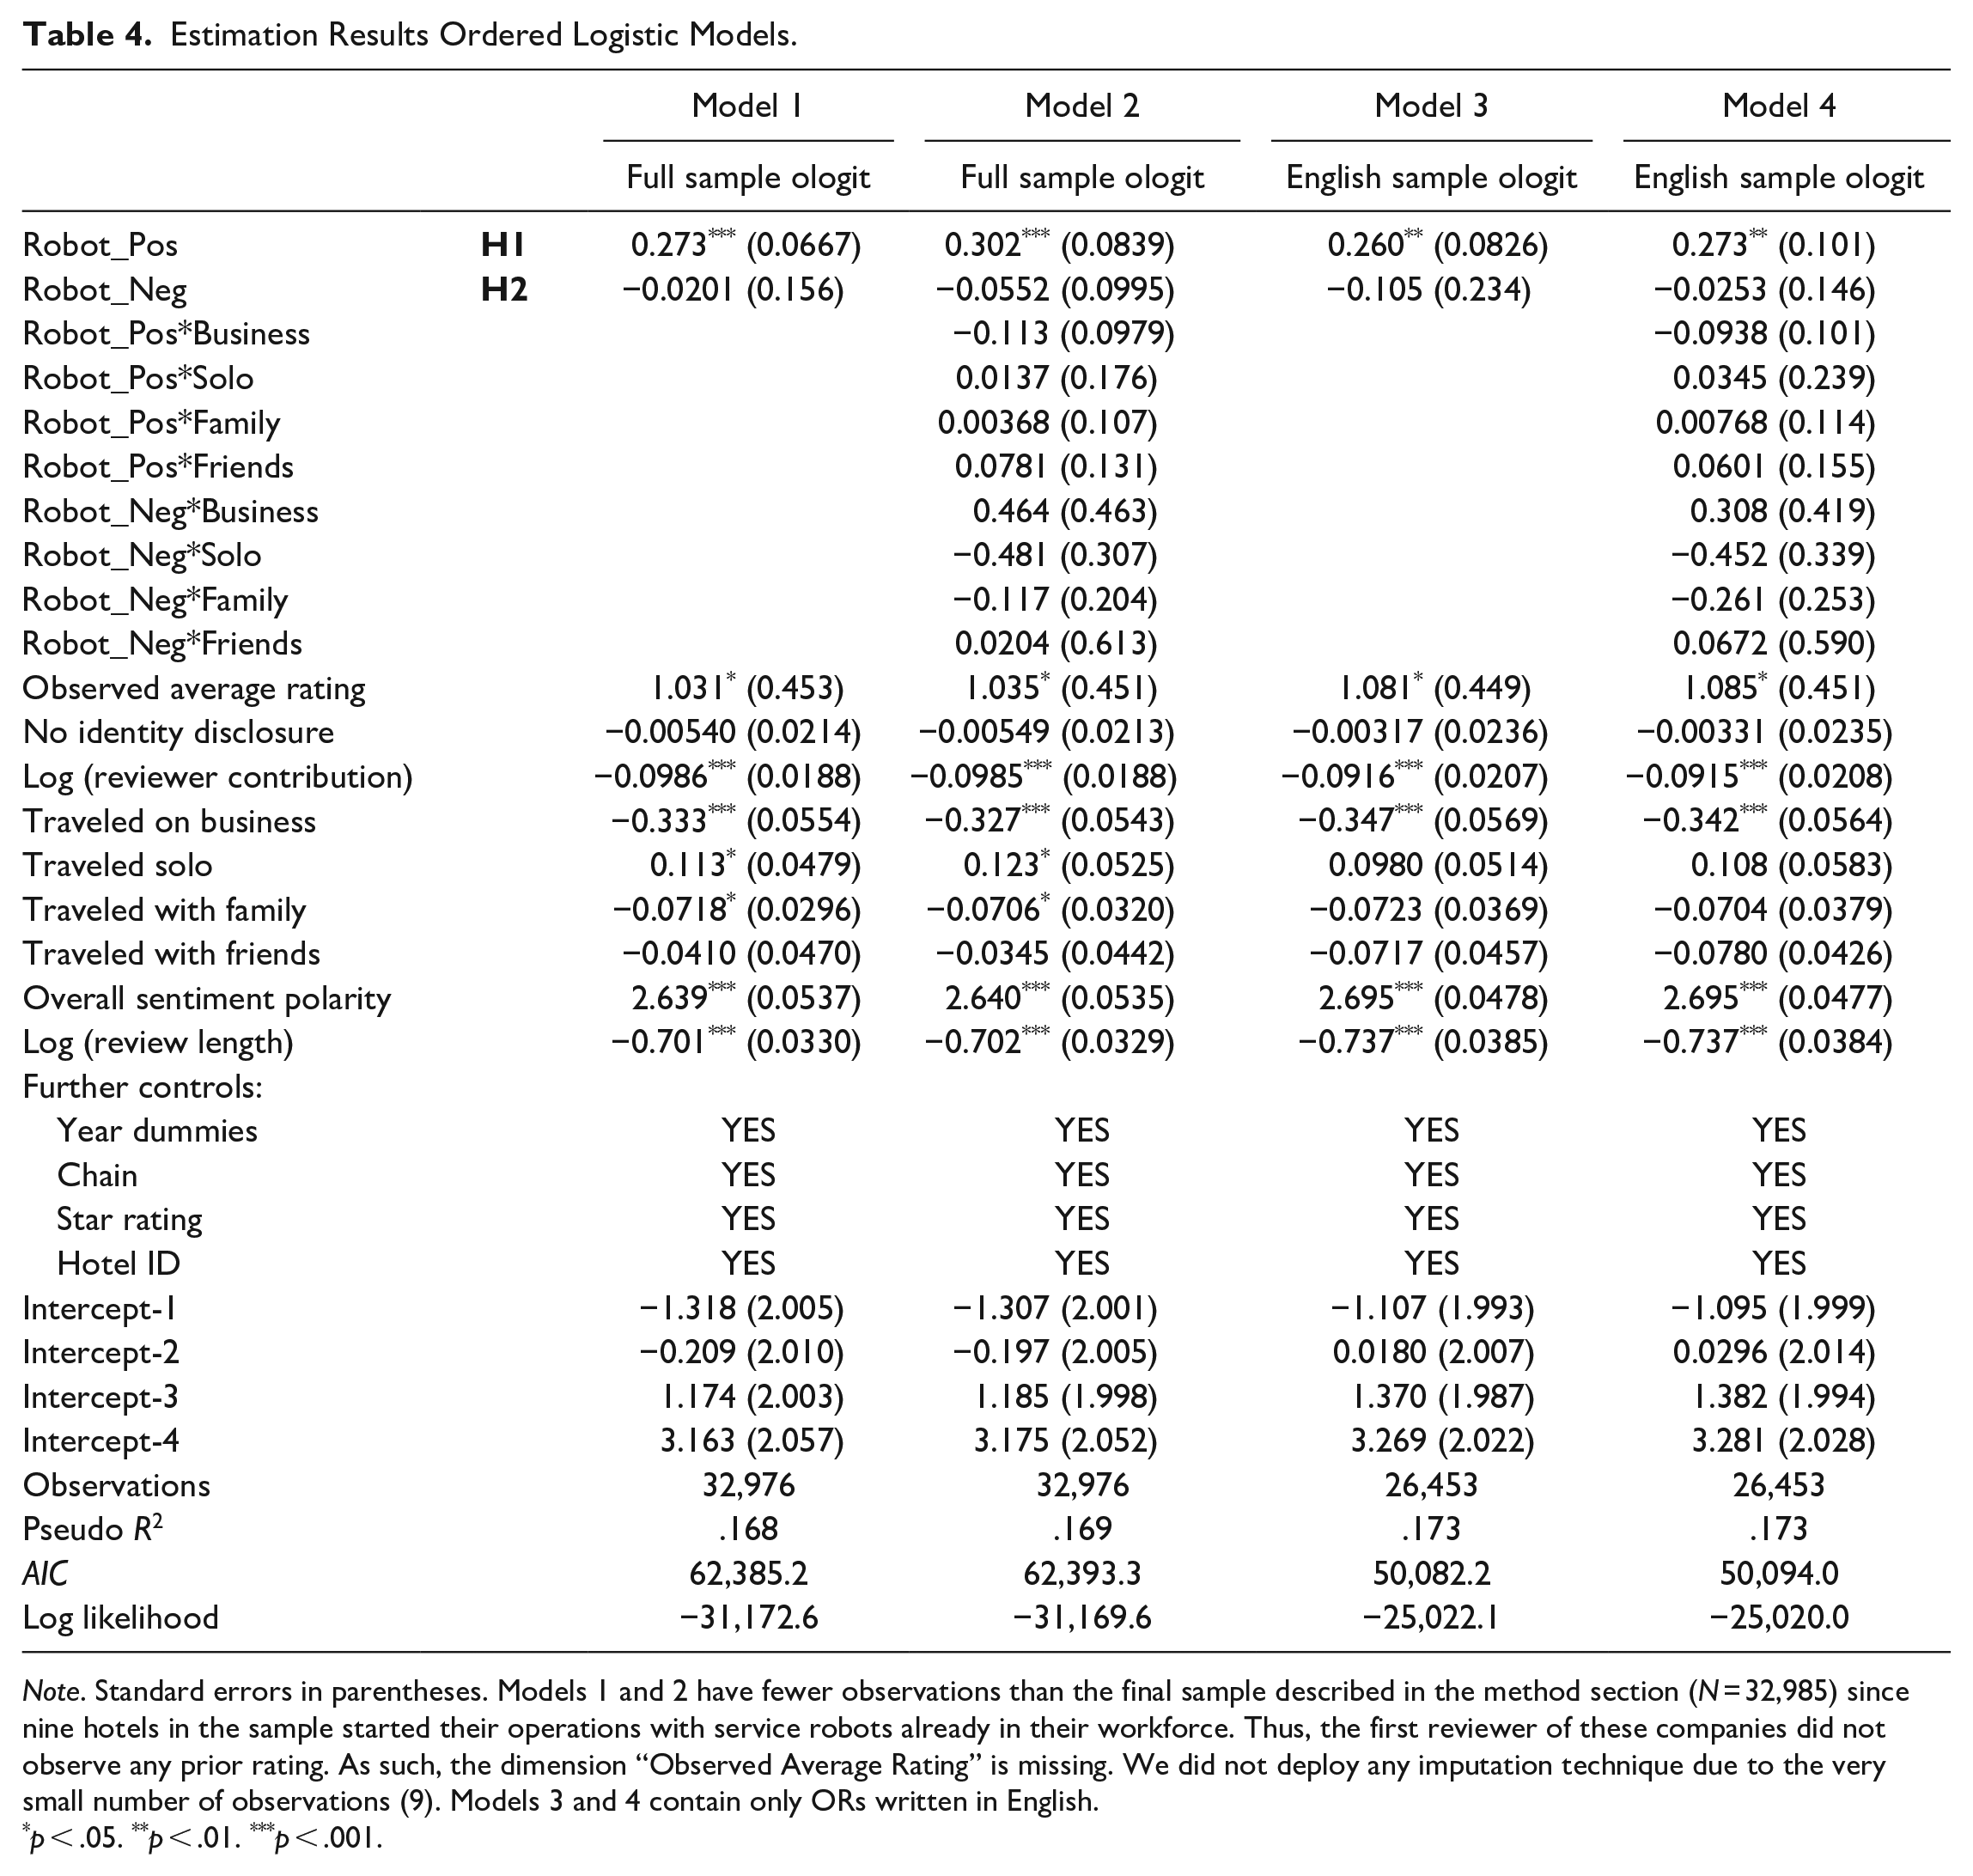
Note. Standard errors in parentheses. Models 1 and 2 have fewer observations than the final sample described in the method section (N = 32,985) since nine hotels in the sample started their operations with service robots already in their workforce. Thus, the first reviewer of these companies did not observe any prior rating. As such, the dimension “Observed Average Rating” is missing. We did not deploy any imputation technique due to the very small number of observations (9). Models 3 and 4 contain only ORs written in English.
p < .05. **p < .01. ***p < .001.
As far as the moderating effect of traveler type is concerned, the latter has not been found to moderate significantly the relationship between service robots’ perceived performance and overall customer satisfaction (see Model 2). Thus, this supports our claim pertaining to a nonexistent moderation effect. Indeed, since different travel type dimensions display similar patterns of positive response in recent exploratory empirical studies (Fuentes-Moraleda et al., 2020; Orea-Giner et al., 2022), as expected, the impact of service robots is effectively captured by our two main variables Robot_Pos and Robot_Neg.
Referring to the effects of the control variables, their coefficients confirm the findings of extant empirical literature in marketing and tourism marketing management. For instance, review ratings are positively and significantly influenced by previous ratings (Sridhar & Srinivasan, 2012) and the overall sentiment of the review content (Geetha et al., 2017). Conversely, the reviewer’s level of contribution and length of OR exert a negative and significant effect on the review rating (Gao et al., 2018; Godes & Silva, 2012) as well as business travelers (M. M. Mariani et al., 2019). Moreover, identity disclosure does not impact the reviewers’ evaluation (Sridhar & Srinivasan, 2012).
Investigating the robustness of the main findings, Models 3 and 4 in Table 4 report the estimates obtained using only ORs written in English. The results align with the ones of Models 1 and 2.
Robustness Check: Propensity Score Matching
The approach used so far to test the relationship between the introduction of service robots and customer satisfaction could have been prone to endogeneity issues, mainly related to sample selection (Cameron & Trivedi, 2005). Indeed, individual characteristics could influence whether the tourist decides to interact with service robots (Ivanov et al., 2019). Besides, self-selection and data sparsity could also be seen as potential biases, influencing the main findings of the study (Bi et al., 2020). The latter is clearly displayed in the OR data used in this work since only 12.17% of the ORs in the entire sample report a statement referring to service robots (N = 4,013). Accordingly, due to the relatively low frequency of negative comments related to service robots, the econometric results might present a spurious association between Robot_Neg and customer satisfaction.
To reduce the abovementioned biases, we chose to leverage propensity score matching, a quasi-experimental analysis. This technique allows researchers to analyze the results related to an outcome variable among individuals who had—a priori—an analogous probability to engage in the behavior under examination (Rosenbaum & Rubin, 1983). Originated by the seminal work of Rosenbaum and Rubin (1983), it has gradually become a popular matching technique in a wide range of research fields (Caliendo & Kopeinig, 2008). Essentially, through this matching exercise, we aimed to associate each reviewer reporting service robots with the closest reviewer not mentioning this attribute but being the most similar based on a set of predefined characteristics. This allowed us to balance the sample in terms of: (1) volumes, so that half of the sample mentions service robots (thus reducing data sparsity concerns); (2) individual characteristics, thereby diminishing sample selection issues. More specifically, we matched each of the 4,013 ORs containing a portion of text related to service robots with a counterpart OR non-mentioning this service element. This led us to obtain a sample of 8,026 ORs after having performed this matching exercise.
The first step to deploy propensity score matching was related to the estimation of the propensity score (Caliendo & Kopeinig, 2008). As such, to calculate the propensity score of reporting service robots we estimated a logistic regression model having as dependent variable a dummy variable equal to 1 if the reviewer has reported service robots in her OR and 0 otherwise. As independent variables, we used a set of covariates that have been conceptualized or empirically tested in extant literature as having an impact on the adoption of service robots or reviewing behaviors, such as travel type (Tung & Au, 2018), reviewer experience and identity disclosure (Gao et al., 2018). Further, we included the set of hotel controls used in the main econometric estimation, namely Chain, Star Rating, and Hotel ID since firm characteristics can impact the degree of robotics adaptation (Ivanov et al., 2019) and a time-related variable, labeled “months_from_intro” to account for potential organizational learning mechanisms (Levitt & March, 1988). Overall, this is a parsimonious set of features in order to avoid any over-parametrization issue in the estimation of the propensity score (Bryson et al., 2002).
Second, in line with Yang et al. (2019), we opted for the nearest neighbor algorithm to select the matching observations among reviewers not reporting service robots. Third, to verify the assumption of common support, we examined the density distribution functions of the treated and control groups in the overall population (Caliendo & Kopeinig, 2008). Finally, based on the newly obtained sample we re-ran all the econometric analyses.
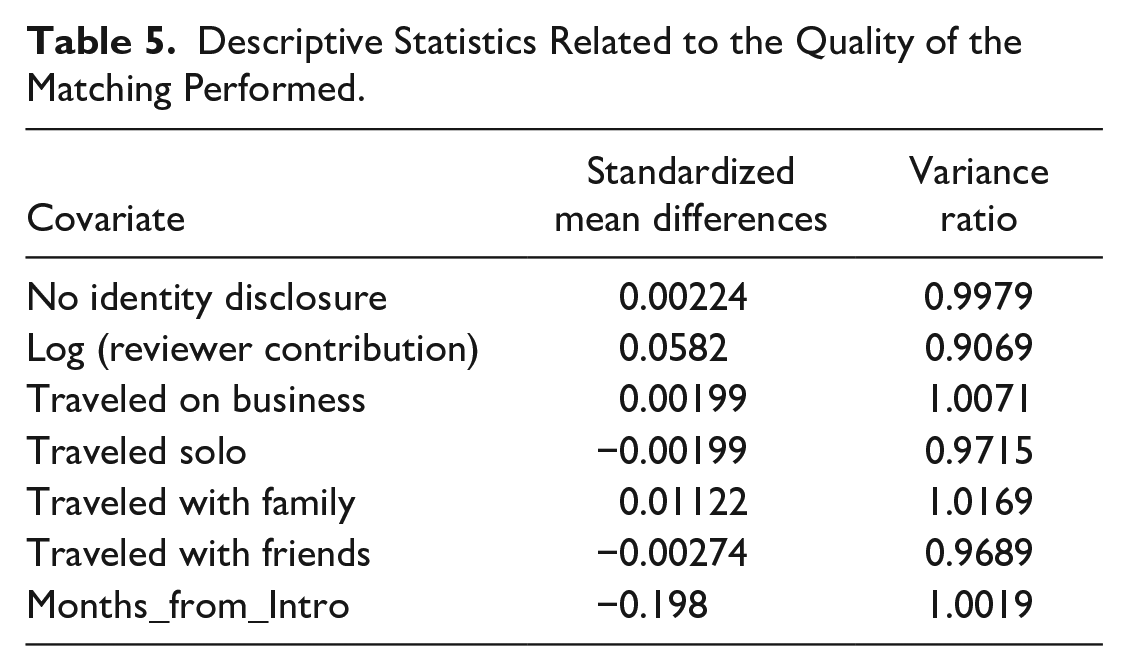
Before evaluating the econometric results, we conducted a series of analyses to ensure the quality and reliability of the matching. To this aim, we first inspected the common region assumption, visually assessing the density distributions of the propensity score for the sample of reviewers writing about service robots vis-à-vis reviewers not mentioning this aspect (Caliendo & Kopeinig, 2008). As clear from Figure 1, there seems to be a reasonable overlap between the areas underneath the two functions, indicating that the current analysis does not suffer from common support issues. Besides, we checked the balance of every covariate used to calculate the propensity indicator. Table 5 shows how all the differences in terms of standardized mean are close to zero, whereas all the variance ratios present values close to one. Moreover, for the overall sample, we calculated the Rubin’s B and the Rubin’s R indicators (Rubin, 2001), which equated to 12.77 and 1.31, respectively: these values perfectly fit the intervals recommended by Rubin (2001) for considering the sample sufficiently balanced. Taken together, these results certify the quality of the performed matching, ensuring that each reviewer mentioning service robots was associated with the most similar reviewer not mentioning service robots.
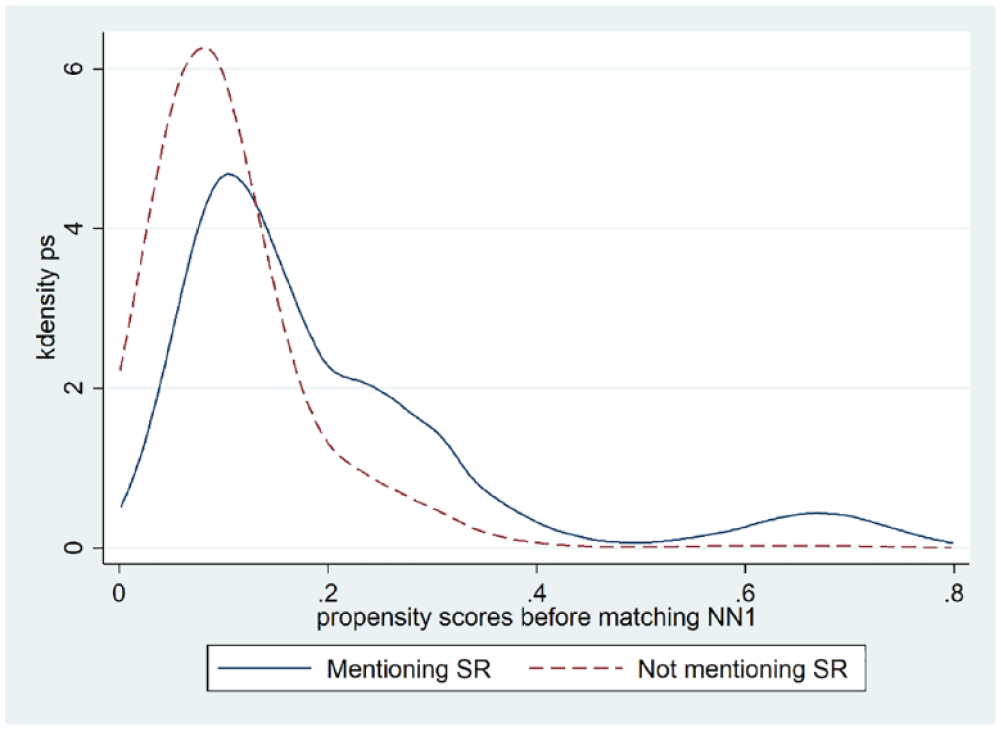
Density distributions of the propensity score for the sample of reviewers mentioning service robots vis-à-vis reviewers not mentioning it.
Descriptive Statistics Related to the Quality of the Matching Performed.
As far as the econometric results are concerned, the main findings of the study still hold in this semi-experimental configuration. Indeed, as depicted in Table 6, the coefficient of Robot_Pos is positive and statistically significant in all the estimated models, confirming HP1. Conversely, Robot_Neg, despite presenting a negative coefficient, is never found to be statistically significant, rejecting HP2. Also, none of the variables included to capture the moderating effect of the traveler type has been found to be significant.
Estimation Results Propensity Score Matching Sample Using Ordered Logistic Models.
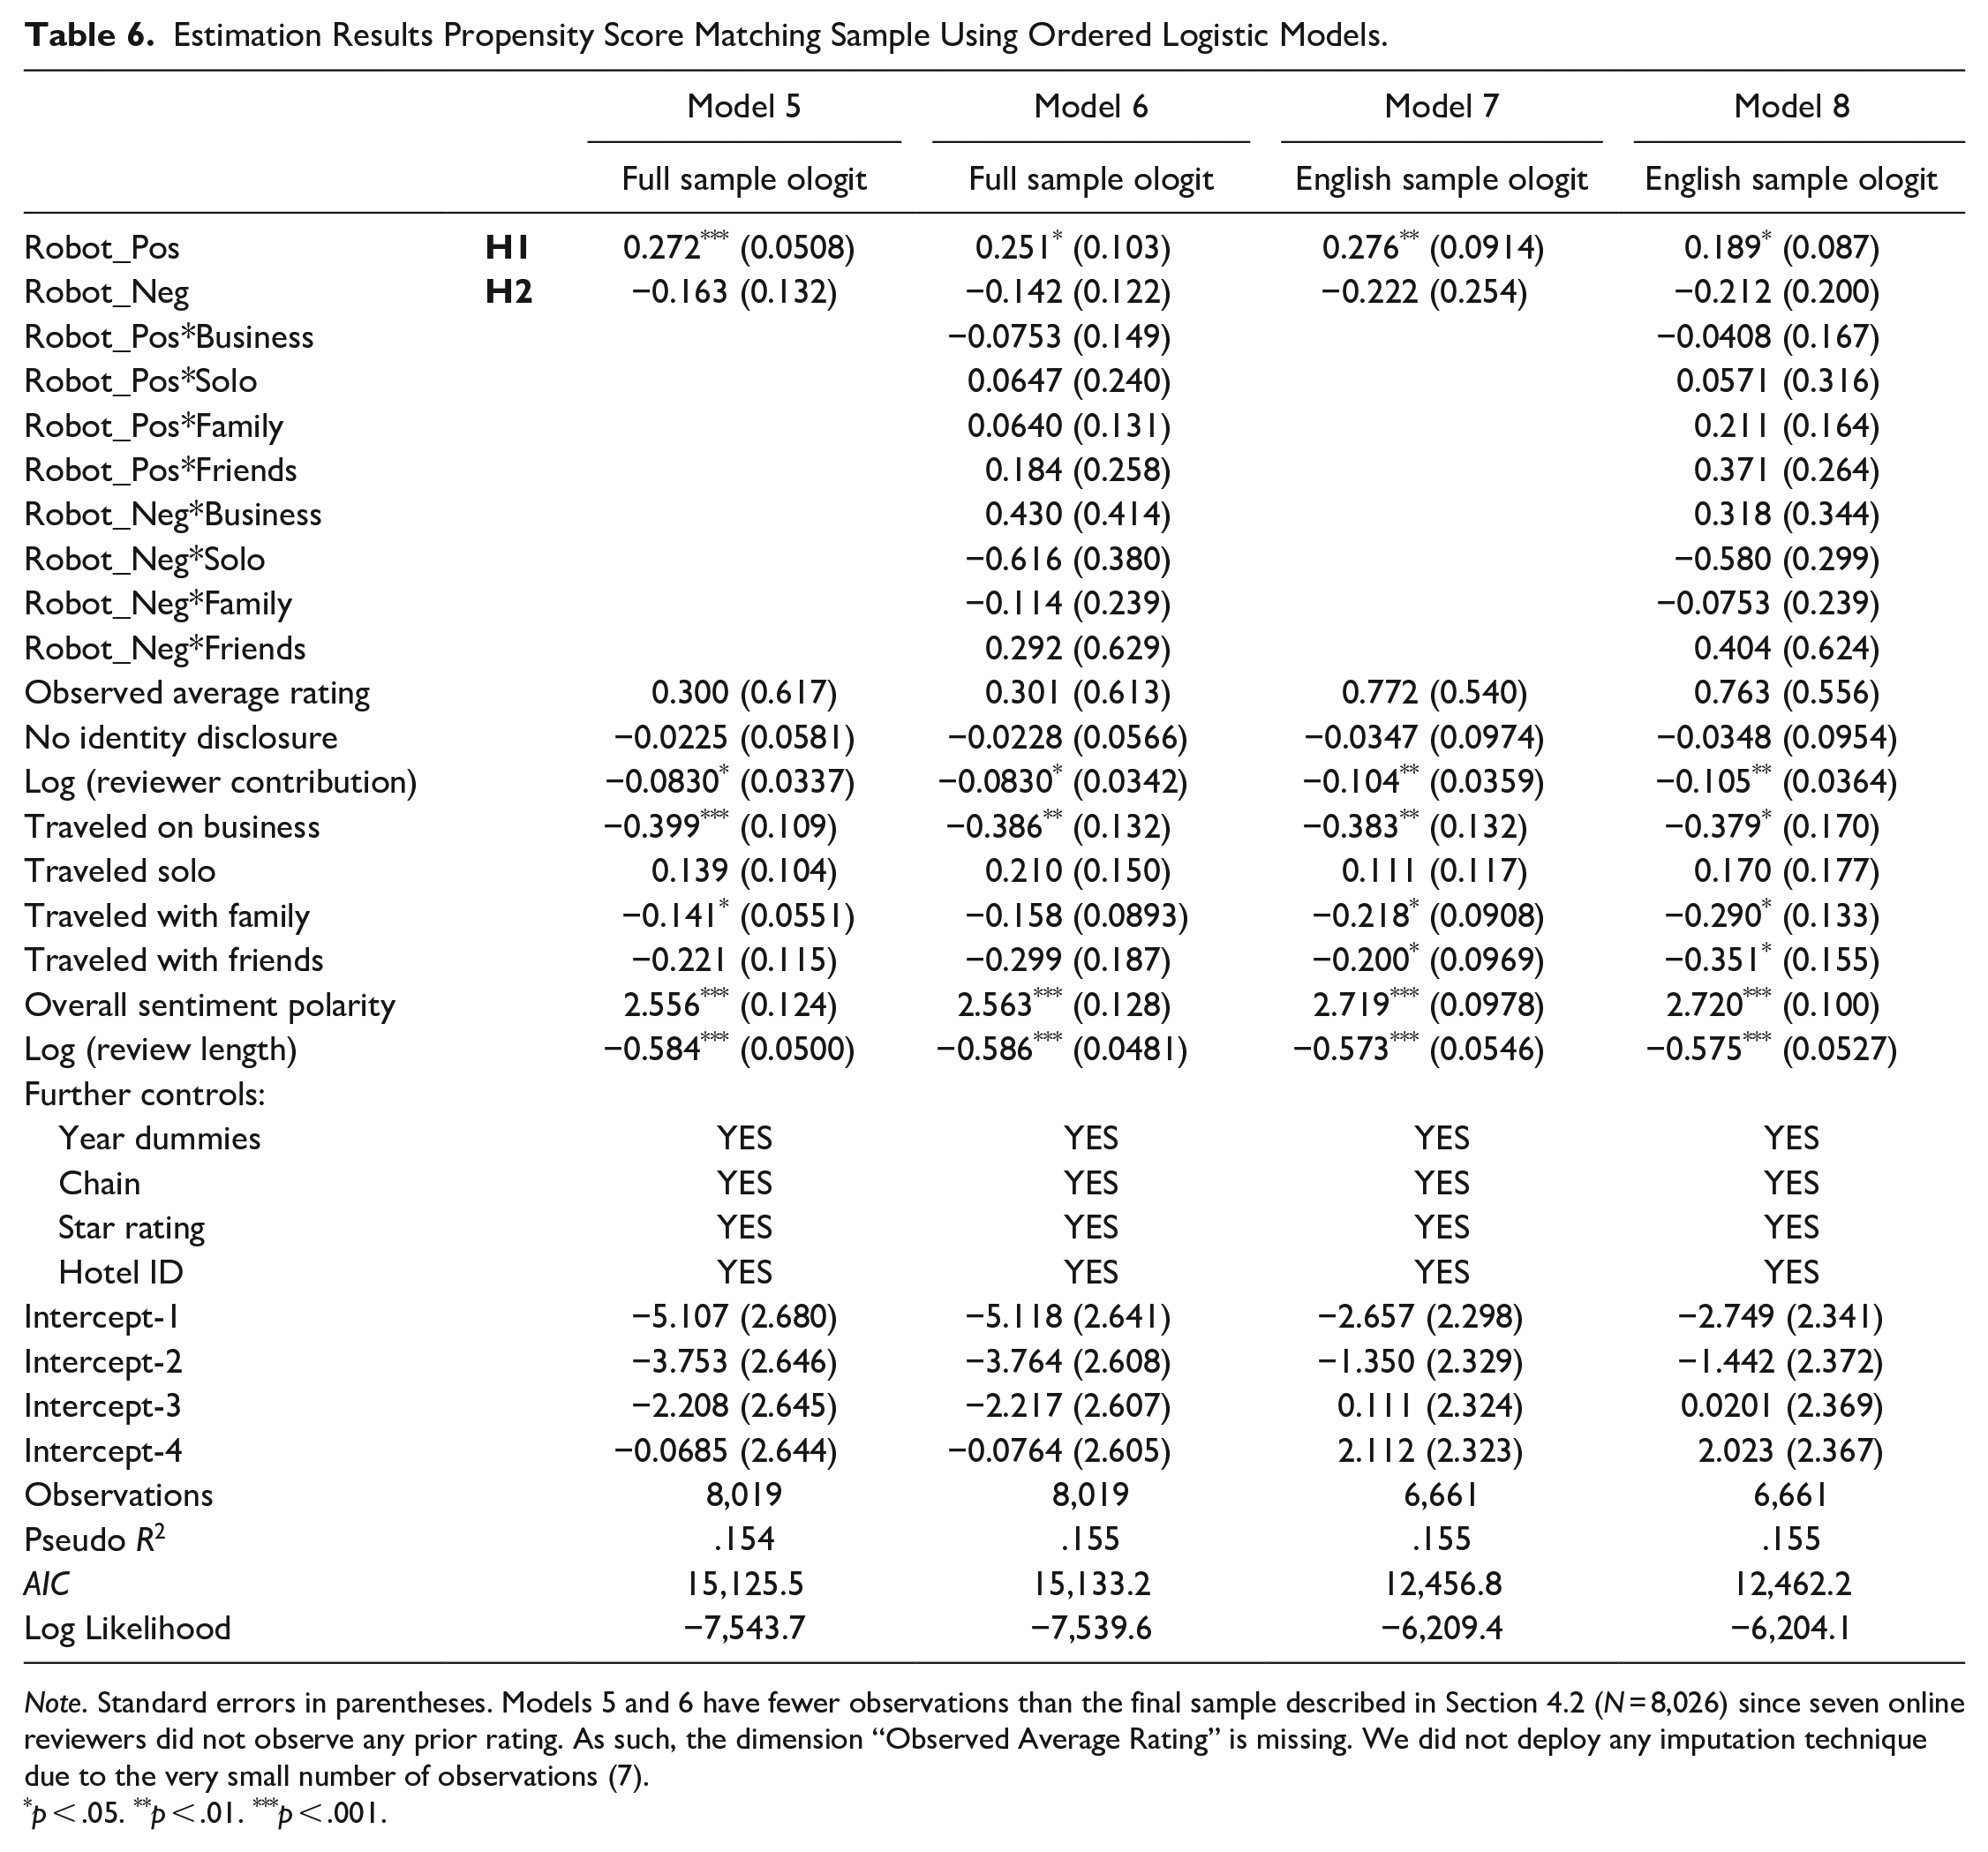
Note. Standard errors in parentheses. Models 5 and 6 have fewer observations than the final sample described in Section 4.2 (N = 8,026) since seven online reviewers did not observe any prior rating. As such, the dimension “Observed Average Rating” is missing. We did not deploy any imputation technique due to the very small number of observations (7).
p < .05. **p < .01. ***p < .001.
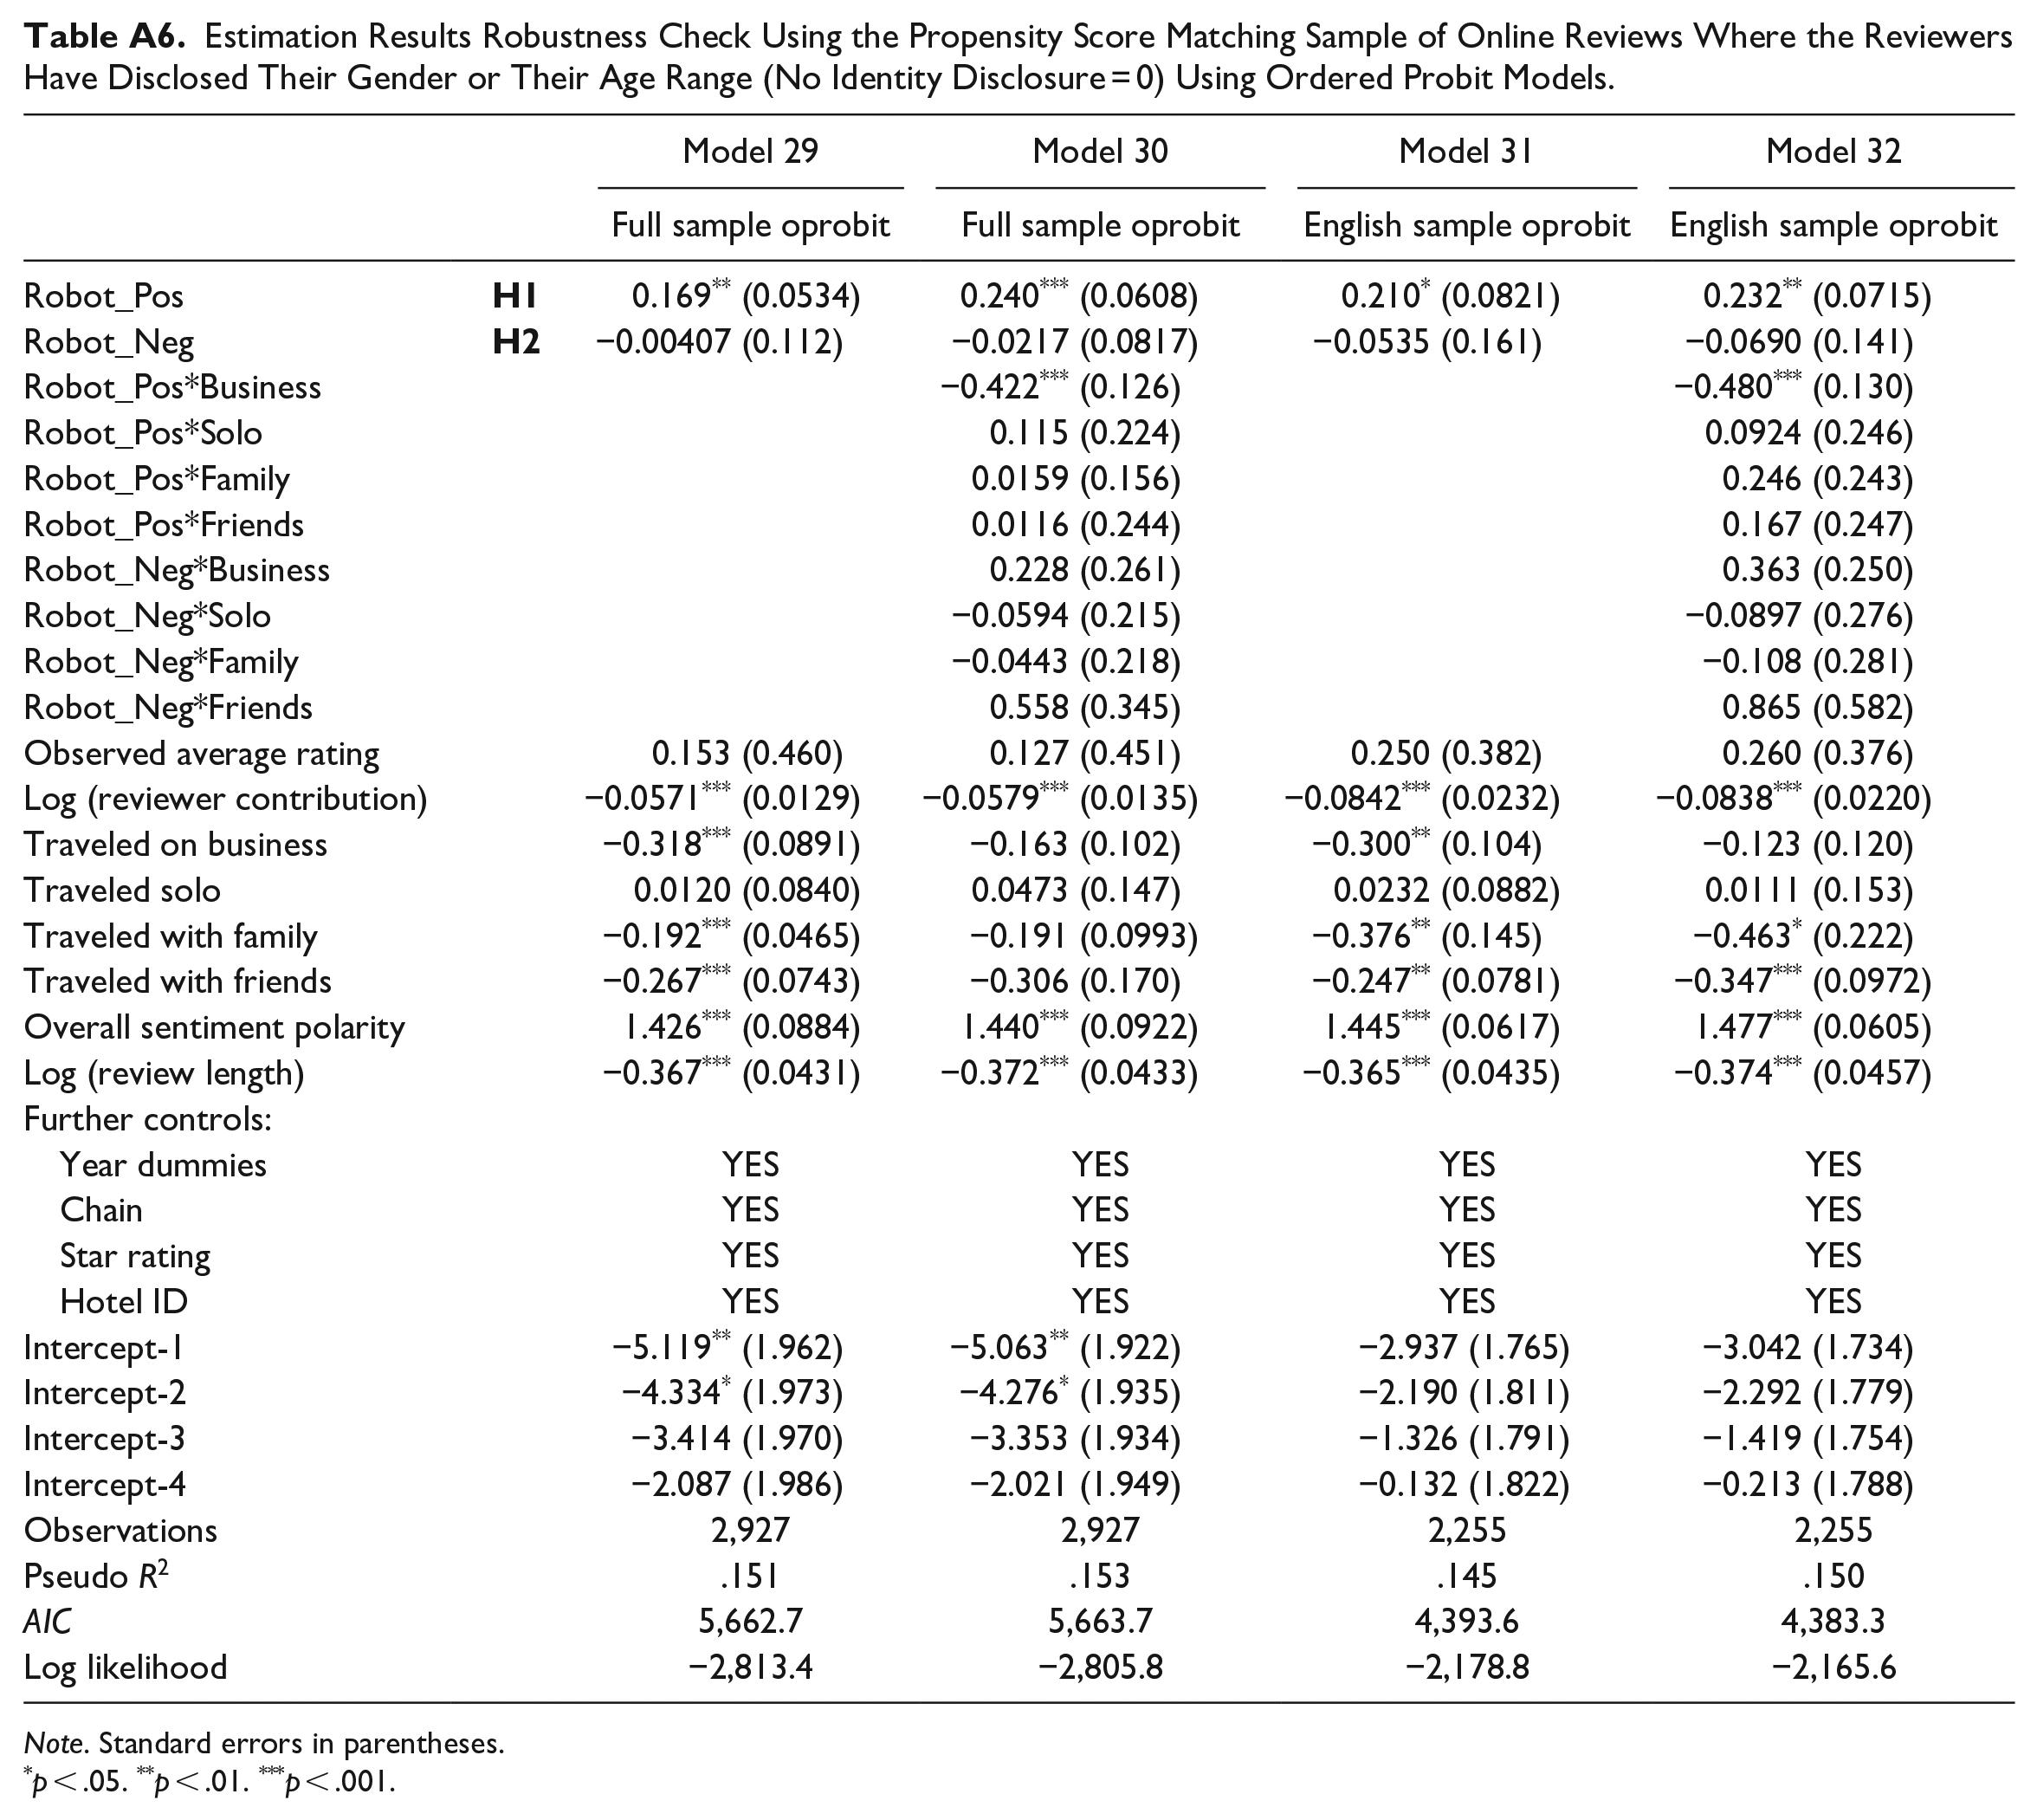
Apart from leveraging propensity score matching, we conducted a series of further robustness checks that can be found in the Appendix. In particular, we leveraged a different estimation technique, namely ordered probit (Tables A1 and A2) and also run all the analyses considering only the sample of ORs whereby reviewers disclosed their identity (Tables A3, A4, A5, and A6). The results are in line with the main findings, consistently supporting HP1 and rejecting HP2. However, using the sample of ORs with No_identity_disclosure = 0, the coefficient related to the moderating effect of Robot_Pos*Business is found to be negative and significant. This might be explained by the fact that since travelers on business focus on the efficiency of HRIs (Fuentes-Moraleda et al., 2020), a positive performance from the latter does not generate customer delight. Yet, being this specific sample only 30% of the entire population and in light of the wide range of robustness checks performed, we are confident in the reliability of our main findings.
Discussion
Theoretical Implications
This study contributes to the literature lying at the intersection of the evaluation of the service experience, human-robot interaction, and eWOM.
First, it constitutes the first attempt to analyze and conjointly assess the impact of both positive and negative performance stemming from human-robot interaction on overall perceived customer satisfaction, under the guise of OR ratings. Thus, the study answers the call to assess comprehensively and empirically the impact of service robotics in tourism (Tung & Law, 2017). In particular, we aim to shed new light related to the impact of service robots on overall perceived customers’ satisfaction with the service experience by leveraging real post-service consumption self-reported comments (V. N. Lu et al., 2020). Tracking the evolution of customer satisfaction research in the tourism and hospitality domain, the three-factor theory of customer satisfaction is used as the main theoretical underpinning of the study (Cadotte & Turgeon, 1988). Our findings, stemming from mechanisms belonging to attribution and service innovation theories, strongly highlight how positive performance associated with the interaction of service robots outweighs the impact of negative performance on perceived customer satisfaction. Indeed, we show that a positive customer evaluation of service robots contributes to enhancing overall customer satisfaction (confirming our first hypothesis), whereas the latter is not altered by a negative customer evaluation of service robots (rejecting our second hypothesis). Finding support for our first hypothesis, we empirically validate insights stemming from the service (e.g., Evangelista & Vezzani, 2010) and tourism and hospitality innovation literature (e.g., Martin-Rios & Ciobanu, 2019). On the contrary, since our second hypothesis has been rejected, our findings are at odds with the attribution theory literature (Miller & Ross, 1975; Moon, 2003) and recent empirical evidence suggesting a significant impact of negative consumer responses to human-robot interactions (Fuentes-Moraleda et al., 2020; Kim et al., 2019; Mende et al., 2019; Orea-Giner et al., 2022). Yet, as we elaborate later, this might align with recent studies focusing solely on robotic service failures (Fan et al., 2020; Jörling et al., 2019). This implies that, even in presence of a negative performance stemming from a human-robot interaction, this event does not significantly impact the overall satisfaction of the guest with the service experience, suggesting that service robots evaluation falls in the consumers’ “zone of tolerance” (Wirtz & Lovelock, 2018). Overall, due to this discrepancy in the effects of the positive and negative performance of service robots, we argue that the latter have an asymmetrical influence on overall customer satisfaction. In other words, as our results highlight, the positive and negative performance of service robots during a human-robot interaction impact consumers’ judgments revolving around satisfaction differently. Linking this back to the three-factor theory, we can confidently classify service robots as an excitement factor.
Second, testing the potential moderating effect of the traveler type dimension we add to the human-robot interaction literature suggesting this factor can determine customers’ perceptions of service robots (Fuentes-Moraleda et al., 2020; Orea-Giner et al., 2022; Rodriguez-Lizundia et al., 2015; Tung & Au, 2018). However, the latter has not been found to moderate significantly the relationship between service robots’ perceived performance and overall customer satisfaction. Thus, this sustains our claim pertaining to the nonexistent of a moderation effect. Therefore, we might argue that although there might be differences in the way human-robot interactions are evaluated by different traveler types (Fuentes-Moraleda et al., 2020), their impact on customer satisfaction is rather homogenous and positive.
Third, distinctively from empirical works using laboratory and survey data (e.g., de Kervenoael et al., 2020; Pitardi et al., 2022), this study leverages OR data on a set of international hotels, uniquely contributing to the literature stream leveraging eWOM to unfold travelers’ perceptions of human-robot interactions (Borghi & Mariani, 2021; Fuentes-Moraleda et al., 2020; Gretzel & Murphy, 2019; Orea-Giner et al., 2022; Tung & Au, 2018). In particular, it extends Borghi and Mariani’s (2021) online robotic discourse to derive the levels of performance perceived by the reviewing guest when evaluating service robots. Without leveraging online robotic discourse and related analytics we would have not been able to obtain such a rich dataset for our analyses. As such, this study showcases not only the importance of online robotic discourse, as suggested by Borghi and Mariani (2021), but also how metrics extracted from it can be effectively used to test hypothesized relationships stemming from the analysis of extant literature.
Fourth, as we found that negative evaluations of service robots do not significantly affect overall perceived customer satisfaction, there seems to be no supporting evidence of the existence of a self-serving bias. This aligns with the results of Fan et al. (2020) and Jörling et al. (2019) regarding the overall evaluation of the service experience. Therefore, following the lead of Fan et al. (2020), this could be explained by the fact that the social cues embedded in service robots induce self-blame that in its turn alleviates dissatisfaction with a negative performance from a human-robot interaction. This claim theoretically corroborates existing scholarly definitions of service robots in service marketing (Jörling et al., 2019; van Doorn et al., 2017) that depict robots as social agents. More broadly, this would support arguments in favor of alternative approaches in the sociomateriality literature that challenge the conventional separation between the social and the material spheres (see Orlikowski, 2007). Indeed, as stressed by Latour (2005), agency is not to be considered an innate human characteristic, but a capacity, relational in nature, that is obtained by associating a set of entities (either human or non-human). Therefore, combining Latour thinking with the principles of the service-dominant logic proposed by Vargo and Lusch (2004, 2008), the social (people) and the material (technologies) can be perceived as equal actors whose interaction has the capability to co-create value. Based on this theoretical ground, the current study contributes to the human-robot interaction literature by assessing empirically how the interaction between service customers and service robots effectively creates value in the hotel market (which is reflected in higher OR ratings).
Practical Implications
Starting from a micro-level of analysis, this study provides clear evidence of the positive influence of service robots in the evaluation of the overall hotel customer experience, encouraging the adoption of this form of innovation by hotel managers. Negative performances related to service robots’ interactions exist, but they do not significantly influence the overall travelers’ judgments. This confirms the view of Kuo et al. (2017), who highlight how service robots are an important resource able to sustain hotel competitiveness. However, managers should carefully evaluate the fit of this source of innovation into their current brand image and operations (Kuo et al., 2017). Furthermore, as depicted by Xu et al. (2020), customers’ feedback on human-robot interactions should be proactively gathered and analyzed by businesses. Indeed, this will lead companies to acquire a more comprehensive understanding of travelers’ preferences for human-robot interactions. For instance, we provide specific examples in the following paragraph regarding negative service robots’ performance. Therefore, hotel operations managers might leverage the innovatively conceived methodology of our study to appraise and control the influence of service robots’ performance on consumers’ judgments of the service experience virtually in real time. More specifically, hotel managers could collect guest review data from public and private sources and apply the penalty-reward contrast analysis built upon text analytics techniques devised in Section 3. The interpretation of the econometric estimates, using Lin et al. (2010) classification schema, will provide them with an overview of the impact of service robots on their firms’ operations and allow them to adjust their strategies and operations accordingly. Besides, they might decide to compare and contrast the analyses taking into account specific periods to better evaluate the introduction of innovative features (e.g., new restaurant menu items that can only be delivered by the robot, robot-centric holiday packages) related to the deployment of service robots.
As far as a meso-level of analysis is concerned, service robots might soon become a commodity in hotel’s operations (Wirtz et al., 2018). This might alter customers’ expectations and make them less prone to forgive failures in human-robot interactions. For instance, in the sample analyzed, negative performances mainly stem from situations where the robot is found to be under maintenance, not able to accommodate the guest request (e.g., the robot luggage is full) or the service is taking longer than expected (e.g., the robot butler has troubles with the service delivery). Also, in some instances, hotels seem to fail to clearly communicate service robots’ functionalities in advance, leaving guests unsure about how to use them. Moreover, among self-reported HRIs, we record situations in which guests expected the service to be delivered by the robot and felt disappointed when the latter was carried out by a human employee. These negative performances might soon match or even outweigh the impact of positive HRI in consumers’ judgment of their stay. Thus, hoteliers adopting service robots should meticulously ponder the exclusive features of their human-robot interactions, avoiding the abovementioned pitfalls and constantly improving them through incremental innovation. In this manner hotel managers would be able to preserve their competitive positions in the hotel market and repeatedly delight their customers by leveraging service robotics. As an example, the YOTEL Singapore in Orchard Road, winner of the “Robotics Award for hospitality and leisure” in the city (Singapore Business Review, 2019), has uniquely tailored the interactions with its two service robots, Yoshi and Yolanda. The robots resemble the brand in their design, but each of them is equipped with a distinctive dictionary of phrases that aims to portray different personalities and make them be perceived as social agents able to deliver a memorable customer experience. Due to their service robots increased popularity, YOTEL Singapore Orchard Road has recently introduced the new concept of ROBOCATION, an exclusive robot-centric holiday package where the consumer experience entirely revolves around human-robot interaction (YOTEL Singapore, 2022). Despite being a remarkable example of the deployment of service robots, the latter perfectly fit the company philosophy, “Constant and Never-Ending Innovation.”
Referring to a macro level, although these results incentivize the global adoption of service robots in the hotel market, they can also exacerbate the debate about societal issues stemming from their introduction. For instance, global leaders are demanding the establishment of “robot taxes” (Davenport, 2019). This is due to the fact that in the global economy the main source of taxation is referred to human workers’ wages (Webster & Ivanov, 2020). If service robots were to substitute human employees, governments should create completely new taxation systems, which could include robot taxes. Besides, discussion related to employment challenges will soon follow (I. Tussyadiah, 2020). As highlighted by Guerreiro et al. (2019) if governments and policymakers do not step into the debate, the gradual decrease of automation costs will translate into a wider discrepancy in income inequality. Despite controversial positions in this regard (see, Dwivedi et al., 2023; Wirtz et al., 2018), we do not truly know whether the disruption brought about by artificial intelligence infused in service robots will follow the same pathway as the previous industrial revolutions, generating wealth and new areas of employment. As such, in this climate of uncertainty, policymakers are called to timely act and actively support the transition to a more automated service economy, avoiding being caught unprepared when the global adoption rate will surge dramatically.
Lastly, the manuscript bears practical implications related to its impact on the current COVID-19 pandemic. Since service robots have been found to have a largely positive relationship with respect to perceived customer satisfaction, this ensures that advanced technologies can significantly improve the consumer experience even in a high-touch service setting. Thus, in light of the social distancing measures put in place in many countries around the world, service robots could act as a pivotal element in restructuring strategies to respond to the unprecedented challenges brought about by the COVID-19 pandemic in the hotel industry (Zeng et al., 2020). For instance, some hotels in the United States have started to deploy cleaning robots designed for the healthcare industry to sanitize their rooms (Qubein, 2020). Despite some of these robots being already in use in service companies before the global pandemic, the global demand is expected to dramatically increase in the foreseeable future due to the ongoing pandemic (Financial Times, 2020).
Conclusions, Limitations and Future Research
This study aims to determine to what extent service robots affect perceived customer satisfaction by leveraging the application of three-factor theory to electronic Word-Of-Mouth data. To this end, text analytics are deployed in conjunction with a penalty-reward contrast technique on almost 70,000 online reviews spanning 44 hotels worldwide that incorporated service robots in their operations. The results show that customer satisfaction with hospitality services is significantly increased by positive service robots’ performance, while no significant effect is associated with negative service robots’ performance. Overall, through the three-factor theory lens, service robots constitute an “excitement factor” in the hospitality service offering. Hence, service robots are found to act in the satisfaction domain but do not seem to significantly cause dissatisfaction when unfavorable performance materialized. Also, the traveler type seems not to moderate the relationship between service robots’ performance and customer satisfaction. The study’s findings are confirmed by a semi-experimental research design obtained through Propensity Score Matching. Taken together these results suggest that the trend of global adoption of service robots in the hotel market is becoming increasingly stronger, but also contribute critically to the debate about societal issues (e.g., inequality, employment-related and ethical concerns) stemming from their introduction and deployment. Thus, it is imperative for policymakers and governments to act and support the transition to a more automated service economy. By doing so, they can avoid being caught unprepared when the global adoption rate surges dramatically.
Despite contributing to the extant literature, this work displays some limitations. First, the findings could be biased due to the specific moment in time when data was collected. Future research, adopting a longitudinal perspective with a longer time span, could shed light on the moment where the transition from being an “excitement factor” to a “performance factor” happens. Moreover, they could consider collecting additional online reviews of hotels that have adopted robots after the sampled period. Indeed, the global demand for service robots is expected to increase after the Covid-19 pandemic and this might need a second independent study—where online review data should be made homogenous—to analyze whether there are significant differences between the pre- and post-Covid-19 pandemic periods. Second, although we use data related to 44 hotels worldwide, we only collected them from TripAdvisor. To guarantee the generalization of our findings, scholars can extend the current research design by analyzing other reviewing platforms (i.e., Yelp or Booking.com). Third, even though different robustness checks have been performed to rule out possible problems related to sample characteristics and data sparsity, endogeneity could still be an issue. Indeed, reviewers’ demographic characteristics, such as nationality, age, and gender, could have the power to influence the acceptance of service robots (see Ivanov et al., 2019; M. M. Mariani et al., 2020). TripAdvisor optionally allows reviewers to disclose their age and gender, but unfortunately in the analyzed sample less than 30% of the overall population of ORs presents this information; thereby, we decided not to use these metrics in the empirical analysis. Besides, researchers should also consider individual expectations toward human-robot interactions (e.g., whether the guest was expected to interact with the robot prior to their stay). Controlling for these dimensions and possibly conducting field experiments would ultimately validate the study’s findings. Fourth, scholars might decide to complement our semi-experimental approach at the online review level with a difference-in-difference research design (Kim et al., 2021) at the hotel level. This can be done by matching hotels that adopted service robots (treatment) with firms that did not adopt this new form of innovation (control) and considering the pre- and post-timeframes as the adoption of robotics for each hotel. This would further enrich the evidence on the validity (already proved through other robustness checks) of our main findings at a different level of analysis.
Footnotes
Appendix
Estimation Results Robustness Check Using the Propensity Score Matching Sample of Online Reviews Where the Reviewers Have Disclosed Their Gender or Their Age Range (No Identity Disclosure = 0) Using Ordered Probit Models.
| Model 29 | Model 30 | Model 31 | Model 32 | ||
|---|---|---|---|---|---|
| Full sample oprobit | Full sample oprobit | English sample oprobit | English sample oprobit | ||
| Robot_Pos |
|
0.169 ** (0.0534) | 0.240 *** (0.0608) | 0.210 * (0.0821) | 0.232 ** (0.0715) |
| Robot_Neg |
|
−0.00407 (0.112) | −0.0217 (0.0817) | −0.0535 (0.161) | −0.0690 (0.141) |
| Robot_Pos*Business | −0.422 *** (0.126) | −0.480 *** (0.130) | |||
| Robot_Pos*Solo | 0.115 (0.224) | 0.0924 (0.246) | |||
| Robot_Pos*Family | 0.0159 (0.156) | 0.246 (0.243) | |||
| Robot_Pos*Friends | 0.0116 (0.244) | 0.167 (0.247) | |||
| Robot_Neg*Business | 0.228 (0.261) | 0.363 (0.250) | |||
| Robot_Neg*Solo | −0.0594 (0.215) | −0.0897 (0.276) | |||
| Robot_Neg*Family | −0.0443 (0.218) | −0.108 (0.281) | |||
| Robot_Neg*Friends | 0.558 (0.345) | 0.865 (0.582) | |||
| Observed average rating | 0.153 (0.460) | 0.127 (0.451) | 0.250 (0.382) | 0.260 (0.376) | |
| Log (reviewer contribution) | −0.0571 *** (0.0129) | −0.0579 *** (0.0135) | −0.0842 *** (0.0232) | −0.0838 *** (0.0220) | |
| Traveled on business | −0.318 *** (0.0891) | −0.163 (0.102) | −0.300 ** (0.104) | −0.123 (0.120) | |
| Traveled solo | 0.0120 (0.0840) | 0.0473 (0.147) | 0.0232 (0.0882) | 0.0111 (0.153) | |
| Traveled with family | −0.192 *** (0.0465) | −0.191 (0.0993) | −0.376 ** (0.145) | −0.463 * (0.222) | |
| Traveled with friends | −0.267 *** (0.0743) | −0.306 (0.170) | −0.247 ** (0.0781) | −0.347 *** (0.0972) | |
| Overall sentiment polarity | 1.426 *** (0.0884) | 1.440 *** (0.0922) | 1.445 *** (0.0617) | 1.477 *** (0.0605) | |
| Log (review length) | −0.367 *** (0.0431) | −0.372 *** (0.0433) | −0.365 *** (0.0435) | −0.374 *** (0.0457) | |
| Further controls: | |||||
| Year dummies | YES | YES | YES | YES | |
| Chain | YES | YES | YES | YES | |
| Star rating | YES | YES | YES | YES | |
| Hotel ID | YES | YES | YES | YES | |
| Intercept-1 | −5.119 ** (1.962) | −5.063 ** (1.922) | −2.937 (1.765) | −3.042 (1.734) | |
| Intercept-2 | −4.334 * (1.973) | −4.276 * (1.935) | −2.190 (1.811) | −2.292 (1.779) | |
| Intercept-3 | −3.414 (1.970) | −3.353 (1.934) | −1.326 (1.791) | −1.419 (1.754) | |
| Intercept-4 | −2.087 (1.986) | −2.021 (1.949) | −0.132 (1.822) | −0.213 (1.788) | |
| Observations | 2,927 | 2,927 | 2,255 | 2,255 | |
| Pseudo R2 | .151 | .153 | .145 | .150 | |
| AIC | 5,662.7 | 5,663.7 | 4,393.6 | 4,383.3 | |
| Log likelihood | −2,813.4 | −2,805.8 | −2,178.8 | −2,165.6 |
Note. Standard errors in parentheses.
p < .05. **p < .01. ***p < .001.
Acknowledgements
None
Declaration of Conflicting Interests
The author(s) declared no potential conflicts of interest with respect to the research, authorship, and/or publication of this article.
Funding
The author(s) received no financial support for the research, authorship, and/or publication of this article.