
Abstract
While most businesses actively adopt a data-driven approach for revenue management decisions, understanding how air travelers perceive and behave differently to pricing strategies is essential for yielding optimal financial outcomes. This study analyzes the loss aversion and diminishing sensitivity mechanisms of prospect theory in economy and business cabin classes. With rich longitudinal airfares, regression models and revenue data (15,868 observations from the top-10 aviation routes in the world) from 2014 to 2019, this study finds that lower-(higher-)than-expected airfares have a positive (negative) impact on revenue. When the effect of loss-coded and gain-coded tickets were compared, the extent to which passengers avoided losses (vs. welcomed gains) had a greater impact on revenue, supporting that loss aversion applies to the airline revenue, especially for business passengers. This study contributes to the further refinement of prospect theory by showing that the loss aversion and diminishing sensitivity mechanisms manifest differently in each cabin class.
Introduction
The perishability and high-fixed costs of airline operations have been the basis of developing sophisticated pricing and revenue management strategies to increase the financial prosperity and productivity of the airline industry (Kimes 2005; Weatherford and Bodily 1992). Given that successful pricing strategies are based on understanding customer perception and decision-making behaviors, a growing number of studies have focused on how airline customers react to different pricing information (e.g. Anderson and Wilson 2003; Yu 2008). As a conceptual tool that informs explanations of systematic violations of rational choices among various price points, prospect theory since its first appearance in 1979, has been applied in general behavioral analysis—wherein studies of tourist behavior are included—to explain departures from rationality in a reference-dependent context, in which the analysis of prices has been prevalent (e.g. Barberis 2013; Crompton 2016).
Two important tenets of prospect theory are loss aversion (which states that the sensitivity to perceived losses is greater than the sensitivity to perceived gains) and diminishing sensitivity (which argues that the further away from a benchmark, variations happen at a decreasing rate) (Tversky and Kahneman 1992). Considering that risk is an inherent component of the tourism experiences (Holm et al. 2017), a body of tourism research tested loss aversion and diminishing sensitivity in the context of tourist destination choice behaviors (e.g. Lee and Choi 2020; Nguyen 2016; Nicolau 2011a, 2011b, 2012; Oh 2003; Olya and Han 2020; Sönmez and Graefe 1998; Zou and Petrick 2021). However, only limited research examines loss aversion and diminishing sensitivity in the context of the airline industry (Nicolau 2011a; Nicolau and Sellers 2020). Since most research, investigates these phenomena of consumer behavior in experimental settings or via self-administered surveys, it remains questionable if it retains its accuracy in real-world settings (Barberis 2013). Thus, this study tests the loss aversion and diminishing sensitivity mechanisms using actual airline fares and revenue data from 2014 to 2019 for the world’s most important routes according to Forbes (2019). The study will provide further empirical insights into the impact of loss aversion and diminishing sensitivity on airline revenue. This approach will substantially improve the external validity of prospect theory in airline revenue management.
In addition, despite the wide acceptance of prospect theory in tourism research, there exists some underexplained heterogeneity in findings related to loss aversion and diminishing sensitivity, implying that their levels can be dependent upon the product characteristics or levels of customer service experiences (Chang, Chen, and Hsu 2010; Neumann and Böckenholt 2014). Although there are widespread variances in the products experienced by tourists as well as the tastes of travelers, existing tourism research has not fully considered such diversity when examining the loss aversion and diminishing sensitivity mechanisms; this can result in a lack of deeper insight into tourist decision-making processes and their outcomes (Ramos, Daamen, and Hoogendoorn 2014). Within this scrutiny, this study proposes to test loss aversion and diminishing sensitivity on two distinct airline products namely the economy and business cabin classes. As in the traditional way of segmenting the air travel market, each cabin class targets a different air traveler base, as economy passengers are more price sensitive, while business passengers are less sensitive to airfares, but more sensitive to the quality of in-flight service (Kuo and Jou 2017; Nenem, Graham, and Dennis 2020; Teichert, Shehu, and von Wartburg 2008). Thus, this study comparatively analyzes the impact of loss aversion and diminishing sensitivity on airline revenue between the two cabin classes.
The purpose of this study is to test prospect theory in airline revenue management by specifically analyzing the manifestations of loss aversion and diminishing sensitivity, and whether the impact is exhibited differently in the diverging bipartite cabins of economy and business class. In the following sections, relevant literature on airline revenue management and prospect theory is reviewed. Next, based on the theoretical gaps identified in the literature review, study hypotheses are developed. Third, research methodology and results including hypotheses tests are explained. Lastly, discussions of study findings and future research directions are presented.
Literature Review
Airline Revenue Management
Airline operations incurs high costs ranging from fuel burn to passenger services (e.g. multiple complex inflight products), while the industry’s thin profit margins are dependent on the efficient utilization of aircraft and productivity of staff. Meanwhile the numerous extraneous market forces, such as the relentless competition, regulatory environment or fluctuating fuel prices, further erode its financial relevance (Chin and Tay 2001; Doganis 2019; Ko 2016; Shaw et al. 2021). Setting fares at the optimum price point to attract the attention of potential passengers is essential in driving the revenue streams, while there is only a limited supply of seats due to the fixed physical floor surface area of the aircraft cabin and it is imperative for each carrier to maximize its revenues (Delahaye et al. 2017; Garrow 2010; Selc̣uk and Avṣar 2019).
Managing the complex mix of perishable fixed seat inventory (i.e. an empty seat has no value once the aircraft departs), continuously-varying passenger demand due to seasonality issues, and the added ramifications of interpreting the offerings of competing carriers who are also striving to entice passengers at the same time is extremely arduous. Meanwhile Revenue management’s key principle is to extract the maximum yield from each passenger, while accounting for all of these attributes, that are ever changing (Kimes 2003; Talluri and Van Ryzi 2005). Research and application of airline revenue management dates back to the 1960s when American Airlines adopted the Sabre reservation system (Chiang, Chen, and Xu 2007). With the deregulation of the U.S. aviation industry in 1978, airlines have been able to freely set ticket prices and flight schedules, further enabling the development of revenue management strategies.
In earlier literature, revenue management was called “yield management” and was defined as the “process by which discount fares are allocated to scheduled flights for the purpose of balancing demand and increasing revenues” (Pfeifer 1989, p. 149). While this definition alludes to two important parts of revenue management namely pricing and seat inventory management, Weatherford and Bodily (1992) later critiqued the way airlines used the term yield as confusing and proposed the term “Perishable-Asset Revenue Management” (emphasis added) to highlight the importance of achieving the ideal trade-off between the average price paid and capacity management via price segmentation.
Kimes (2005) finds that the airline, hotel, and rental car industries may increase their revenue by 3%−5% if they use revenue management strategies. Li and Peng (2007) found that by applying revenue management to airline ticket pricing has incremented the revenue by between 2% and 8%. McAfee and Te Velde (2007) recognize that there is a lack of studies on revenue management and claims for a diverse pool of empirical studies. Accordingly, academic research on revenue management decisions has been developed with a large focus on solving problems and developing effective models of pricing, demand forecasting, capacity allocation, distribution channel management, cancelations, and overbooking (e.g. Grauberger and Kimms 2016; McGill and van Ryzin 1999; Warnock-Smith, O’Connell, and Maleki 2017; Wright, Groenevelt, and Shumsky 2010).
While pricing decisions and capacity management are at the very core of airline revenue management, revenue decisions are not limited to these two factors alone. Importantly, tourist perception and passenger purchase behavior should not be overlooked in revenue management methodologies (Talluri and van Ryzin 2004). When travelers make purchase decisions, they are not entirely rational and do not make optimal choices by evaluating various prices and available options objectively based on calculated utility, contrary to the basic assumptions of classical economic theory (Becker 1993; Simon 1990). Instead, travelers decisions, and therefore revenue outcomes, are affected by human traits including emotional, social or psychological factors (Kahneman and Tversky 1979). Customer buying behaviors have a considerable profit implication. Therefore, understanding how travelers process information is dependent on human traits when it comes to making purchase decisions, which is crucial in effective airline revenue management.
The literature is replete with studies implying that the airfare was pivotable in influencing passengers to travel with an airline (see e.g. Chen and Chao 2015; Fageda et al. 2017; O’Connell and Williams 2005; Proussaloglou and Koppelman 1999). Literature referring to airline revenue management resolve to extrapolate information pertaining to the interdependency of the purchase decision and the ticket price. Some studies examined how travelers perceive and process relevant information such as ticket prices when making purchase decisions. Anderson and Wilson (2003) simulated how airline consumers make use of demand and price information to cope with airline pricing. They found that passengers strategically delay their ticket purchase because of their understanding of airline pricing strategies, wagering that ticket price will decrease as the departure date approaches, which can lead to reduced revenues for airlines. Later, Yu (2008) surveyed airline consumers and found that they perceived price differently depending on their choice of purchase channel. Consumers who consulted online channels perceived ticket prices more negatively than those who employed offline distribution channels. However, these studies have not been able to show with actual revenue data how purchasing decisions are made.
Beyond implementing revenue-maximizing pricing strategies or developing more precise demand forecasting methods, there are few studies that reveal how airline revenue is affected by travelers decision-making mechanisms founded on the subjective perception of objective price information. To fill this gap, the current paper takes a behavioral economics perspective in examining how passengers behave in purchasing their tickets and how this can affect the revenues generated by an airline by employing the principles of prospect theory.
Prospect Theory
According to the expected utility theory, people make rational decisions by processing information to maximize utility from the outcomes of decisions (Loewenstein et al. 2001). Given that every decision is made under risk, the expected utility theory had been a tool to explain the maximization of the expected return with minimal risk exposure (Yang and Qiu 2005). However, contrary to the expected utility theory, experiments in several behavioral studies found that how options are framed could influence a pattern of risk attitudes, resulting in behavioral changes (Assailly 2011). Focusing on perceived gains and losses instead of absolute utilities, Kahneman and Tversky (1979) developed an alternative theory called prospect theory, which refers to those individuals that have different utility functions and are influenced by unique reference points in their decision making. Prospect theory has become an integral part of behavioral economics, and has been successfully applied to problems in finance, insurance, and also airlines (Barberis 2013; Nicolau 2011a).
Prospect theory proposes three general tenets: reference dependence, loss aversion, and diminishing sensitivity. In pricing, people evaluate the value of products based on perceived gain and loss relative to their reference point (Kahneman and Tversky 1979). Thus, their decisions are reference-dependent and the deviation from the reference point will determine if it is to be categorized as a gain or a loss, which influences the final decision.
One of the most noticeable manifestations of reference dependent behavior is loss aversion, which indicates that individuals are more sensitive to perceived losses than to perceived gains relative to their reference points (Tversky and Kahneman 1992). Loss aversion explains that individuals, when given the choice, would rather avoid the pain of losing than pursue the joy of winning the same amount. Prospect theory also claims diminishing sensitivity to price, which states that additional gains or losses further from the reference point, yields diminishing marginal sensitive reactions from individuals; the higher the price level, the smaller the perceived additional utility from the price gaps (Grewal and Marmorstein 1994).
Given that risk is an inherent part of tourism experiences (Holm et al. 2017), a stream of tourism research focuses on examining the impact of loss aversion and diminishing sensitivity on tourist decision-making behaviors. For example, Sönmez and Graefe (1998) initially tested the loss aversion mechanism in vacation decisions involving terrorism risk. Later, Nicolau (2008) found that Spanish tourists use reference prices and are more sensitive to price increases than to price decreases relative to reference price when making their destination choices, with diminishing sensitivity for losses only. Building on this, the author further identified five segments of tourists in terms of their sensitivities to losses (Nicolau 2012). Nguyen (2016) investigated determinants of overspending behavior in a destination focusing on leisure travelers and identified the positive linkage between loss aversion and tourists’ overspending. Most recently, Sharma, Park, and Nicolau (2020) presented the existence of loss aversion and diminishing sensitivity reflected in online review sentiments by analyzing consumers’ positive or negative airline service experience relative to their expectations.
While prospect theory has been widely adopted in economics and business literature, inconsistencies have been found in results about the existence and the impact of loss aversion on decision making (e.g. Hardie, Johnson, and Fader 1993; Raman and Bass 2002). In order to address this issue, researchers highlighted the paradox to incorporate important contextual factors such as heterogeneity among consumers and different product categories to reduce biases in estimates of loss aversion (Klapper, Ebling, and Temme 2005; Neumann and Böckenholt 2014). In the field of tourism, several studies took such an approach and examined the role of product and consumer characteristics. For example, Nicolau (2011b) incorporated tourist characteristics in relation to loss-averse consumer behavior in destination choice and found that people with higher levels of cultural interest in destinations are less loss-averse. Most recently, an empirical examination (Nicolau and Sellers 2020) showed that travelers exhibit different levels of loss-averse tendency depending on tourism product characteristics (i.e. independent flight tickets versus tickets being a part of bundles).
In their meta-analysis of loss aversion, Neumann and Böckenholt (2014) suggested that buyer sensitivity to losses should be considered in more industries, implying that individuals’ asymmetric responses to gains and losses can be observed in flight choice behaviors. While most businesses actively adopt, so called, a data-driven approach for revenue management decisions, understanding how air travelers perceive available pricing strategies and how they behave according to these perceptions as well as the type of cabin class that they opt to travel in is essential for yielding an optimal financial outcome. In this regard, the current study takes account of product types and consumer characteristics and argues that the reactions of airline passengers of economy and business cabin classes to airfares will be embodied differently in each class, resulting in different impacts on airline revenues.
Airlines offer differentiated products and services (i.e. cabin classes) to cater to diverse needs of passengers and to maximize their revenue, attracting passengers with different price sensitivities in each cabin class (Hugon-Duprat and O’Connell 2015). However, there is limited knowledge of how prospect theory is manifested in the purchase decision making of passengers and its associated impact on airline revenue (Nicolau 2011a; Nicolau and Sellers 2020); therefore, further empirical evidence is required to deepen the understanding of loss aversion and diminishing sensitivity mechanisms in the airline industry. In addition, most research examining prospect theory relies on experimental approaches or self-administered surveys (e.g. Chang, Chen, and Hsu 2010; Sönmez and Graefe 1998). While these methodologies provide important insights into the asymmetric tourist behaviors postulated by prospect theory, it is valuable to test whether the tenet of prospect theory holds, for the actual revenue data that is a derivative from consumer choice behaviors. This approach will add further evidence of prospect theory and enhance the validity of loss aversion and diminishing sensitivity. Thus, by incorporating prospect theory the current study proposes to test the loss aversion and diminishing sensitivity mechanisms using airline passengers’ revenue data.
Hypotheses Development
According to prospect theory, people make a purchase decision based on their perceived potential losses or gains relative to their reference points (Kahneman and Tversky 1979). This principle can be tested with actual airline revenue data when travelers perceive some flight fares either higher- or lower-than-expected. When passengers find that airfares are lower than their reference prices, they are likely to perceive them as gains and secure such fares. Therefore, they would be more likely to purchase the flight tickets as they are in the gain territory, resulting in an increase in revenue. Alternatively, when passengers find higher-than-expected flight fares, paying for such fares would be encoded as a loss and they might opt for alternatives thereby leading to a decrease in flight revenues. Put together, Hypotheses 1 and 2 are proposed as below.
Prospect theory explains that buyers react more sensitively to perceived losses than to perceived gains (Kahneman and Tversky 1979). In other words, the anguish of losses feels greater than the gratification of equivalent amount of gains in decision making. While the concept of loss aversion has been applied to explain tourists’ asymmetric behaviors in several studies, Nicolau (2011a) reported the initial examination of the loss aversion tendency in airline passengers’ choice behaviors. Analyzing how actual ticket prices influence individuals’ choice of different types of air carrier, the author found that passengers rely on reference prices instead of absolute prices in choosing low-cost, charter or full-service network carriers, and are more sensitive to an increase in price, than to a reduction against their reference prices.
While this study shows air travelers reference dependence in making purchase decisions, its findings rely on airline passengers’ self-reported answers regarding their air carrier choice behaviors. Thus, it is important to understand whether and how such behaviors are linked to the revenue performance of the carrier. Encompassing the prospect theory’s value function (Tversky and Kahneman (1992) and applying it to the purchase behaviors we expect that loss aversion of revenues will be more pronounced than the pursuit of gain. In other words, the decrease in flight revenue resulting from higher-than-expected flight fares will be greater than the increase in flight revenue derived from lower-than-expected flight fares. Therefore, following hypothesis is proposed.
Regarding diminishing sensitivity, few studies have analyzed this property in the context of airlines. Nicolau (2011a), in a choice framework, finds diminishing sensitivity for losses only and Sharma, Park, and Nicolau (2020) confirms its existence in the relationship between online review sentiments and the ratings of passengers. The existence of diminishing sensitivity in the context of airlines’ revenue would imply that the marginal variation in revenue derived from a gain or loss, changes depending on the distance from the reference point. In particular, this property postulates that gains (losses) in airfares bring about lower variations in revenues as we move further from the reference point. Therefore, the following hypothesis is stated:
Methodology
Sample and Variables
In order to secure a large number of passengers per route, we selected the top-10 routes in the world (Forbes 2019) and obtained data on 150 airlines from Official Aviation Guide of the Airways. We selected the 10 busiest routes for two reasons; (1) they represent the world’s most important routes according to Forbes (Forbes 2019) and account for significant market demands and transactions and (2) it is not feasible to collect and analyze the data from all airline routes in the world. These 10 routes are Kuala Lumpur—Singapore, Hong Kong—Taipei, Jakarta—Singapore, Hong Kong—Shanghai, Jakarta—Kuala Lumpur, Seoul—Osaka, New York LaGuardia—Toronto, Hong Kong—Seoul Incheon, Bangkok—Singapore, and Dubai—Kuwait. Due to disproportionate amount of missing data, the Seoul—Osaka route was not included for the final analysis.
The study period ranges from 2014, the earliest data point available in Official Aviation Guide (OAG) of the airlines scheduled data, to 2019; we intentionally excluded the data from 2020 due to the considerable impact of the COVID-19 pandemic on airline demand and revenue. The demand analysis was conducted using a Global Distribution System (GDS) Sabre AirVision Market Intelligence Data Tapes subscription database. This database, which has also been extensively used in many academic papers (e.g. Corbet et al. 2019; Derudder, Devriendt, and Witlox 2010; Sismanidou et al. 2013; Soyk, Ringbeck, and Spinler 2018; Suau-Sanchez, Voltes-Dorta, and Rodríguez-Déniz 2016). It collects data on passenger demand, fares, and airline revenues, and includes both indirect bookings such as online travel agents and global travel retailers as well as the direct bookings that include airline websites and mobile Apps by incorporating an algorithm to estimate the total demand, fares and revenues. It can be customized to derive information for specific routes (Sabre 2016). After filtering the sample for missing values, the final sample consists of 15,868 observations. The definitions of the dependent and independent variables are explained in the following subsections. Descriptive statistics of the key and control variables are presented in Table 1.
Descriptive Statistics.
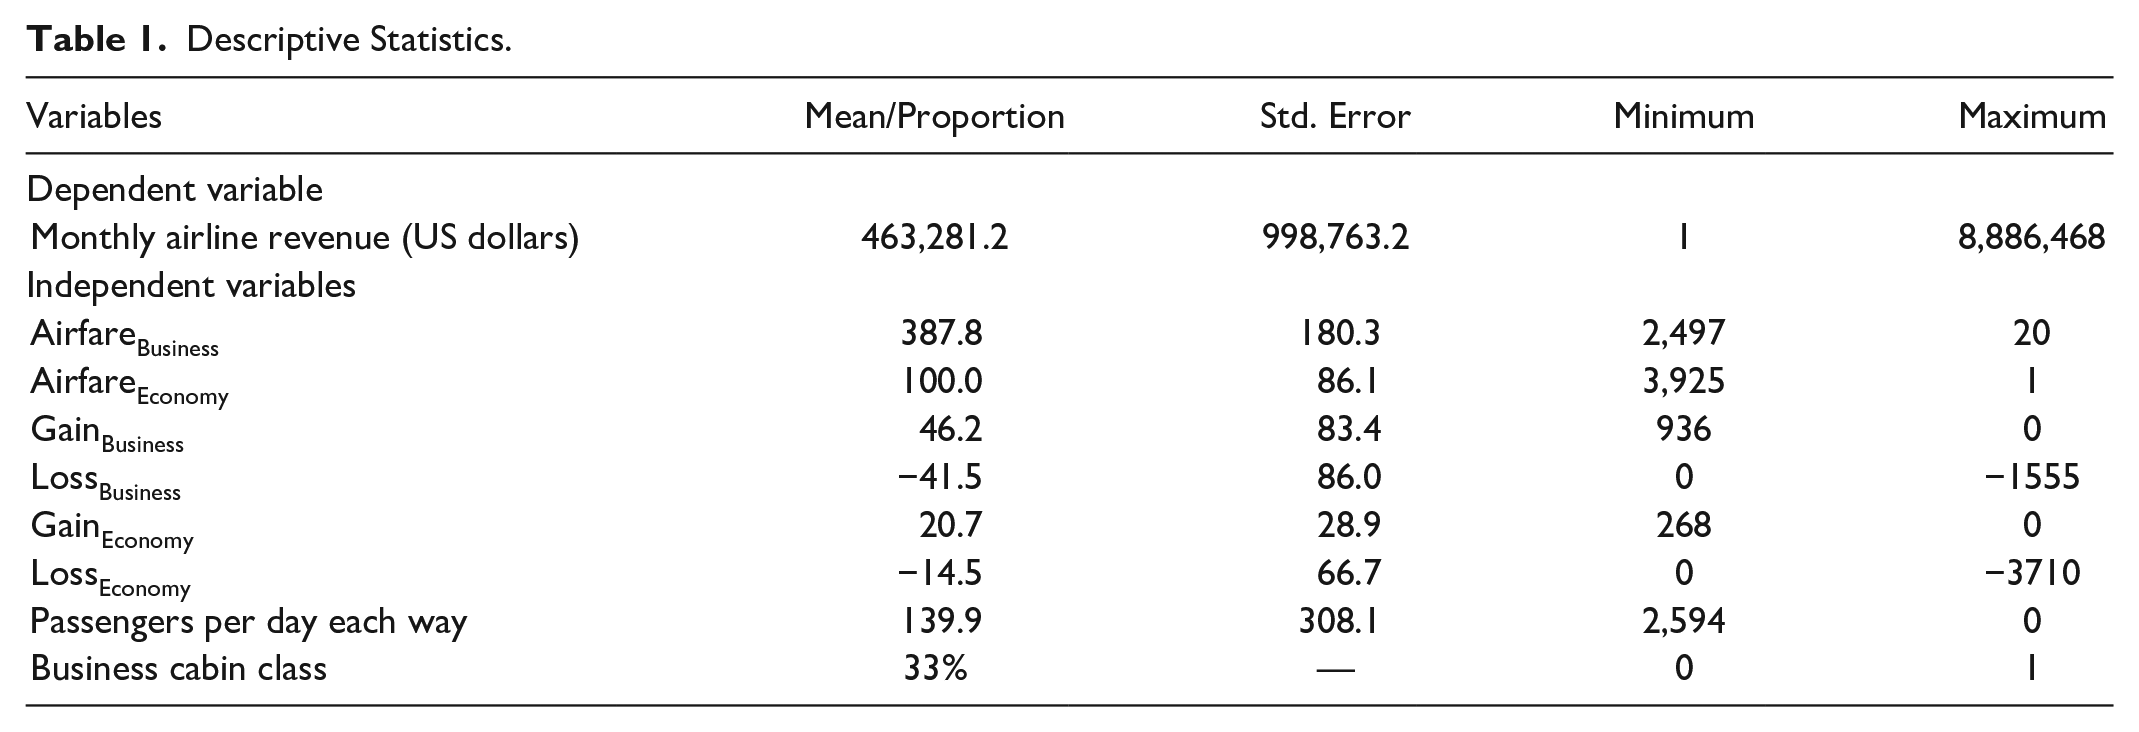
Dependent variable
The dependent variable is airline monthly revenue calculated as monthly number of passengers multiplied by airfare that they paid. Key information such as airline revenue, airfares, and number of passengers of flights operating on the selected route was collected from Sabre AirVision Market Intelligence Data Tapes database.
Independent variables
In order to incorporate reference dependence so that loss aversion can be tested, we built the gain and loss variables described earlier by using the airfare for each flight operating on the selected routes and the expected airfare measured by the mean airfare (Nicolau and Sellers 2020). Key to any analysis of reference dependence is the identification of an accurate reference point which is, the expected airfare in our case. Accordingly, in an attempt to refine our calculations and arrive at an accurate measure of expected airfare, we consider four dimensions to build this expected airfare that incorporated the route, airline, month, and cabin class. In this line, we compared each actual airfare with the expected airfare obtained by the mean value for the same specific route, airline, month, and cabin class. Although the use of mean could be seen somewhat restrictive or static the fact that the proposed reference point changes in the alluded four-dimensional space makes it somewhat dynamic. It implies that the same passengers traveling the same route with the same airline and cabin class but in two different months, will be confronted with different reference prices (different means) because each month has different values. The theoretical basis of using the mean airfare stems from the two approaches that exist to detect reference points in the empirical prospect theory literature (Mazumdar, Raj, and Sinha 2005). The first approach is based on internal memory-based benchmarks, and involves individuals comparing prices paid in the past to the current prices. Getting these survey-based data on these comparisons is a tricky task as at the time of conducting the survey, respondents are expected to have an accurate memory of the price paid on the last occasion. The second approach to obtain reference prices is based on external benchmarks, such as the average prices that the passengers have paid for a flight during a specific period of time. This average point represents the expected price for a passenger to pay for a flight with the same route, airline, and cabin class within the same month.
Regarding control variables, we use the number of “passengers per day, each way,” measured as the total number of one-way passengers in one month, divided by the number of days during each month. As a proxy for demand, this metric helps capture the intensity with which an airline is being used during each month of the study period (Carlton et al. 2019). In addition, as air fares are contingent upon passenger demand, airline costs, and market structure, the decision to operate non-stop versus connecting flights depends on such intensity measured by passengers per day, each way (Luo 2014). As connecting itineraries are linked to longer travel times, passengers tend to have lower predisposition to opt for them; moreover, stopovers also entail higher costs for airlines. Nevertheless, Ennen, Allroggen, and Malina (2019, p. 4) suggest that “connecting routings may enable cost savings through exploiting economies of traffic density on routes to and from a hub airport, particularly through using larger and more efficient aircraft and achieving higher load factors.” Also, we accounted for seasonality by including the year and month dummy variables to reflect these effects, where the year 2014 and the month of January were used as baselines in the estimation. This is approach is in line with Bilotkach, Gaggero, and Piga (2015) and Merkert and Webber (2018). As Narangajavana et al. (2014) points out, the dynamic evolution of airlines’ price structure is a consequence of changes in environmental conditions reflected by time measures.
Data analysis
The analysis of the airfare-revenue relationship to test the tenets of prospect theory requires adopting the framework that Kahneman and Tversky (1979) provides. Specifically, in this context of reference dependence, we need to define the differences between the expected and actual airfares so that the model captures the potential effects of the following gain and loss variables:
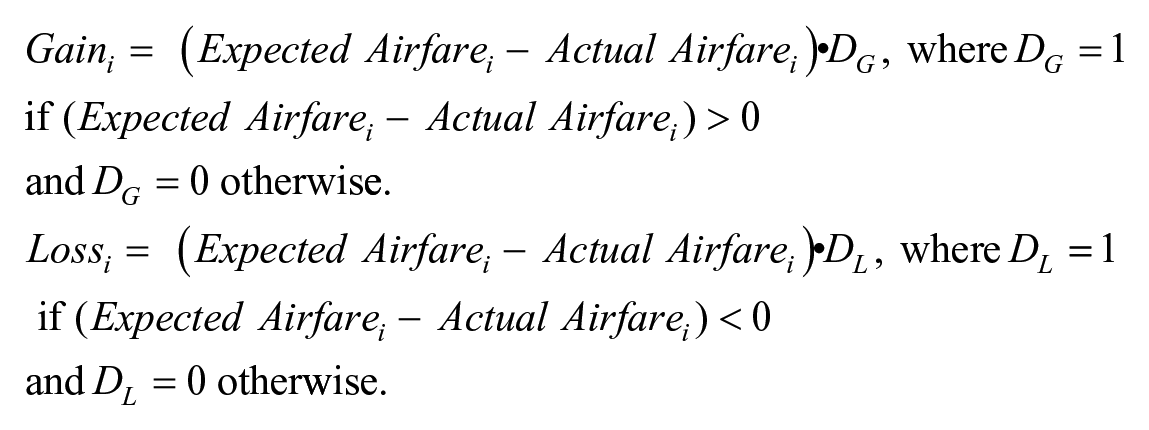
By including these variables (with specific variables for each cabin class) in a regression model that explains an airline i’s revenue (i.e. Revenuei), we obtain the following expression:
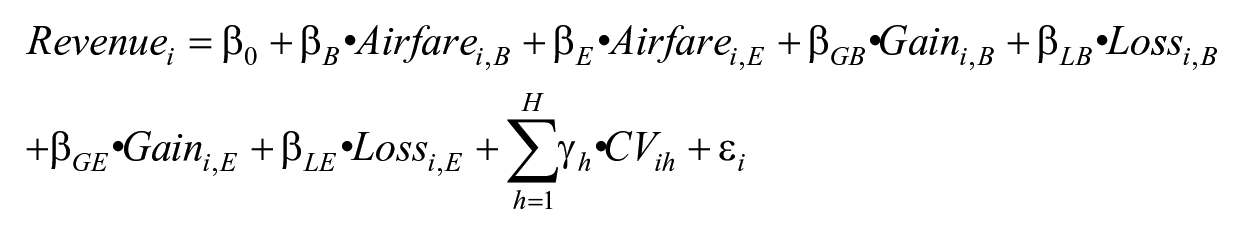
where Airfarei,B and Airfarei,E are the business and economy airfares for airline i, and β B and β E show their effects on revenue; Gaini,B, Lossi,B, Gaini,E, Lossi,E are the gain and loss variables defined previously reflecting the specific effects of business and economy airfares. The parameters β GB , β LB , β GE , and β LE present the impact of these reference dependence-related variables on airline revenue. According to Kahneman and Tversky’s (1979) prospect theory, we observe the loss aversion phenomenon if the parameter associated with the loss variable is greater than that linked to the gain variable. Specifically, loss aversion will be observed if β LB > β GB for business airfares, and β LE > βGE for economy airfares. The testing of diminishing sensitivity is explained later. Finally, several variables CVih that control for level of demand and seasonality are used. The parameters γ h show their effects on revenue.
As the purpose of this study is to quantify the effects of the proposed independent variables on the dependent variable and make parameter comparisons to test the stated hypotheses, we rely on regression analysis in line with the studies of Bell and Lattin (2000) and Klapper, Ebling, and Temme (2005) on prospect theory as it seems to be a methodological approach capable of conducting the analyzes leading to those comparisons and hypothesis testing.
Prior to running the estimation of the model via ordinary least squares, heteroskedasticity, collinearity, linearity and serial correlation are tested. We detect heteroskedasticity through the Breusch-Pagan test (F = 242.62; p < .001) and serial correlation through the Breusch-Godfrey Lagrange multiplier test (F = 19,515.06; p <.001). Consequently, we use Newey-West heteroscedasticity- and autocorrelation-consistent standard errors to compute the parameter significance. Nevertheless, all the variance inflation factors are lower than 10 (Neter, Wasserman, and Kutner 1989), thus collinearity does not seem to be an issue. Regarding linearity, the Ramsey reset test suggests that some non-linear effects might be missing (F = 73.74; p < .001). Accordingly, we introduce the square of the airfares for economy and business cabin class in the model. After controlling for these non-linear variables, the Ramsey reset test shows that the specification with quadratic terms is appropriate (F = 0.1073; p = .7431). In fact, in the same vein of testing quadratic terms, we test diminishing sensitivity—the other pillar of prospect theory. Thus, the resulting model is:
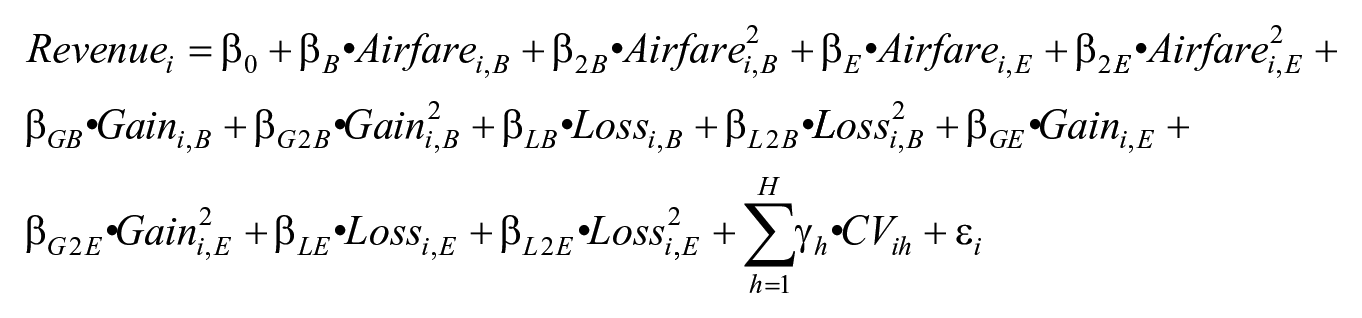
where the parameters β 2B , β 2E , β G2B , β L2B , β G2E , and β L2E represent the effect of diminishing sensitivity-related variables on airline revenue. Diminishing sensitivity will manifest if Gain2 has a negative and significant parameter (βG2B and βG2E) and Loss2 has a positive and significant parameter (βL2B and βL2E).
Additionally, relevant to this empirical application is stationarity and endogeneity. As stationarity is related to rationality (Clayton 1997; Lim and McKenzie 1998), we conduct unit root tests on the series resulting from routes, airlines, cabin types, years and months, to determine whether the data properties suggest stationarity, and find that non-stationarity seems to be confirmed. With an average p-value of .38, the Augmented Dickey-Fuller test cannot reject the presence of a unit root—and non-stationarity for that matter—in 1,114 (90.4%) of the 1,231 series tested. Thus, we should expect non-rational behavior to happen.
Critical to this analysis is the potential endogeneity existing between passenger demand and airfares (and prospect theory-related variables): the airfares have an effect on demand, and the reverse also applies. To control for this potential endogeneity we use Gaussian copulas, which is an instrument-free approach that uses a control function to directly model the joint distribution of the error term and the variable that can be endogenous (Park and Gupta 2012). The copula terms for the variables Airfares (for business and economy cabin classes) and the prospect theory-related variables (for business and economy cabin classes) are obtained as
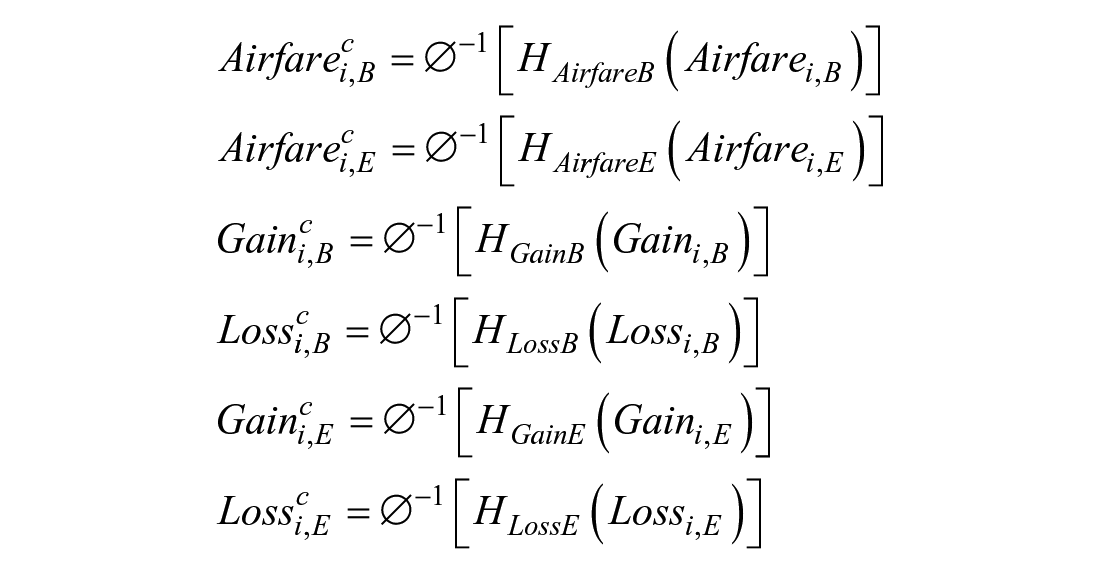
where
Importantly, note that a requirement for this method to be applied is that the empirical distribution of the endogenous regressor should not follow a normal distribution (Park and Gupta 2012); thus, the non-normal distribution of these variables has to be tested. The Jarque-Bera test confirms that the variables Airfarei,B (JBAirfareB = 144,268, p < .01), Airfarei,E (JBAirfareE = 87,204,332, p < .01), GainBusiness (JBGainB = 3,326,701; p < .01), LossBusiness (JBLossB = 3.22E+08; p < .01), GainEconomy (JBGainE = 2.71E+08; p < .01) and LossEconomy (JBLossE = 4.32E+09; p < .01), do not follow a normal distribution. Also, if significant parameters are found for the copulas, it means that endogeneity exists, and those significant parameters must be included in the estimation. Consequently, following Mathys, Burmester, and Clement’s (2016) two-stage procedure, in a first step we included copulas for Airfarei,B, Airfarei,E, GainBusiness, LossBusiness, GainEconomy, and LossEconomy in the model estimation, and in a second step we maintained the copulas that were significant to produce the definitive estimates corrected for endogeneity. When introducing the six copula terms, we find that the copulas for Airfarei,E (t = 3.71; p < .01), GainBusiness (t = 3.57; p < .01) and LossBusiness (t = −4.53; p < .01) are significant, and the copulas for Airfarei,B (t = 1.68; p = .09), GainEconomy (t = −0.38; p = .70) and LossEconomy (t = 0.25; p = .80) are not significant. Therefore, in line with Mathys, Burmester, and Clement’s (2016), in the final model we include the copula terms for Airfarei,E, GainBusiness, LossBusiness only (see Table 2).
Effect of Loss Aversion and Diminishing Sensitivity on Airline Revenue.
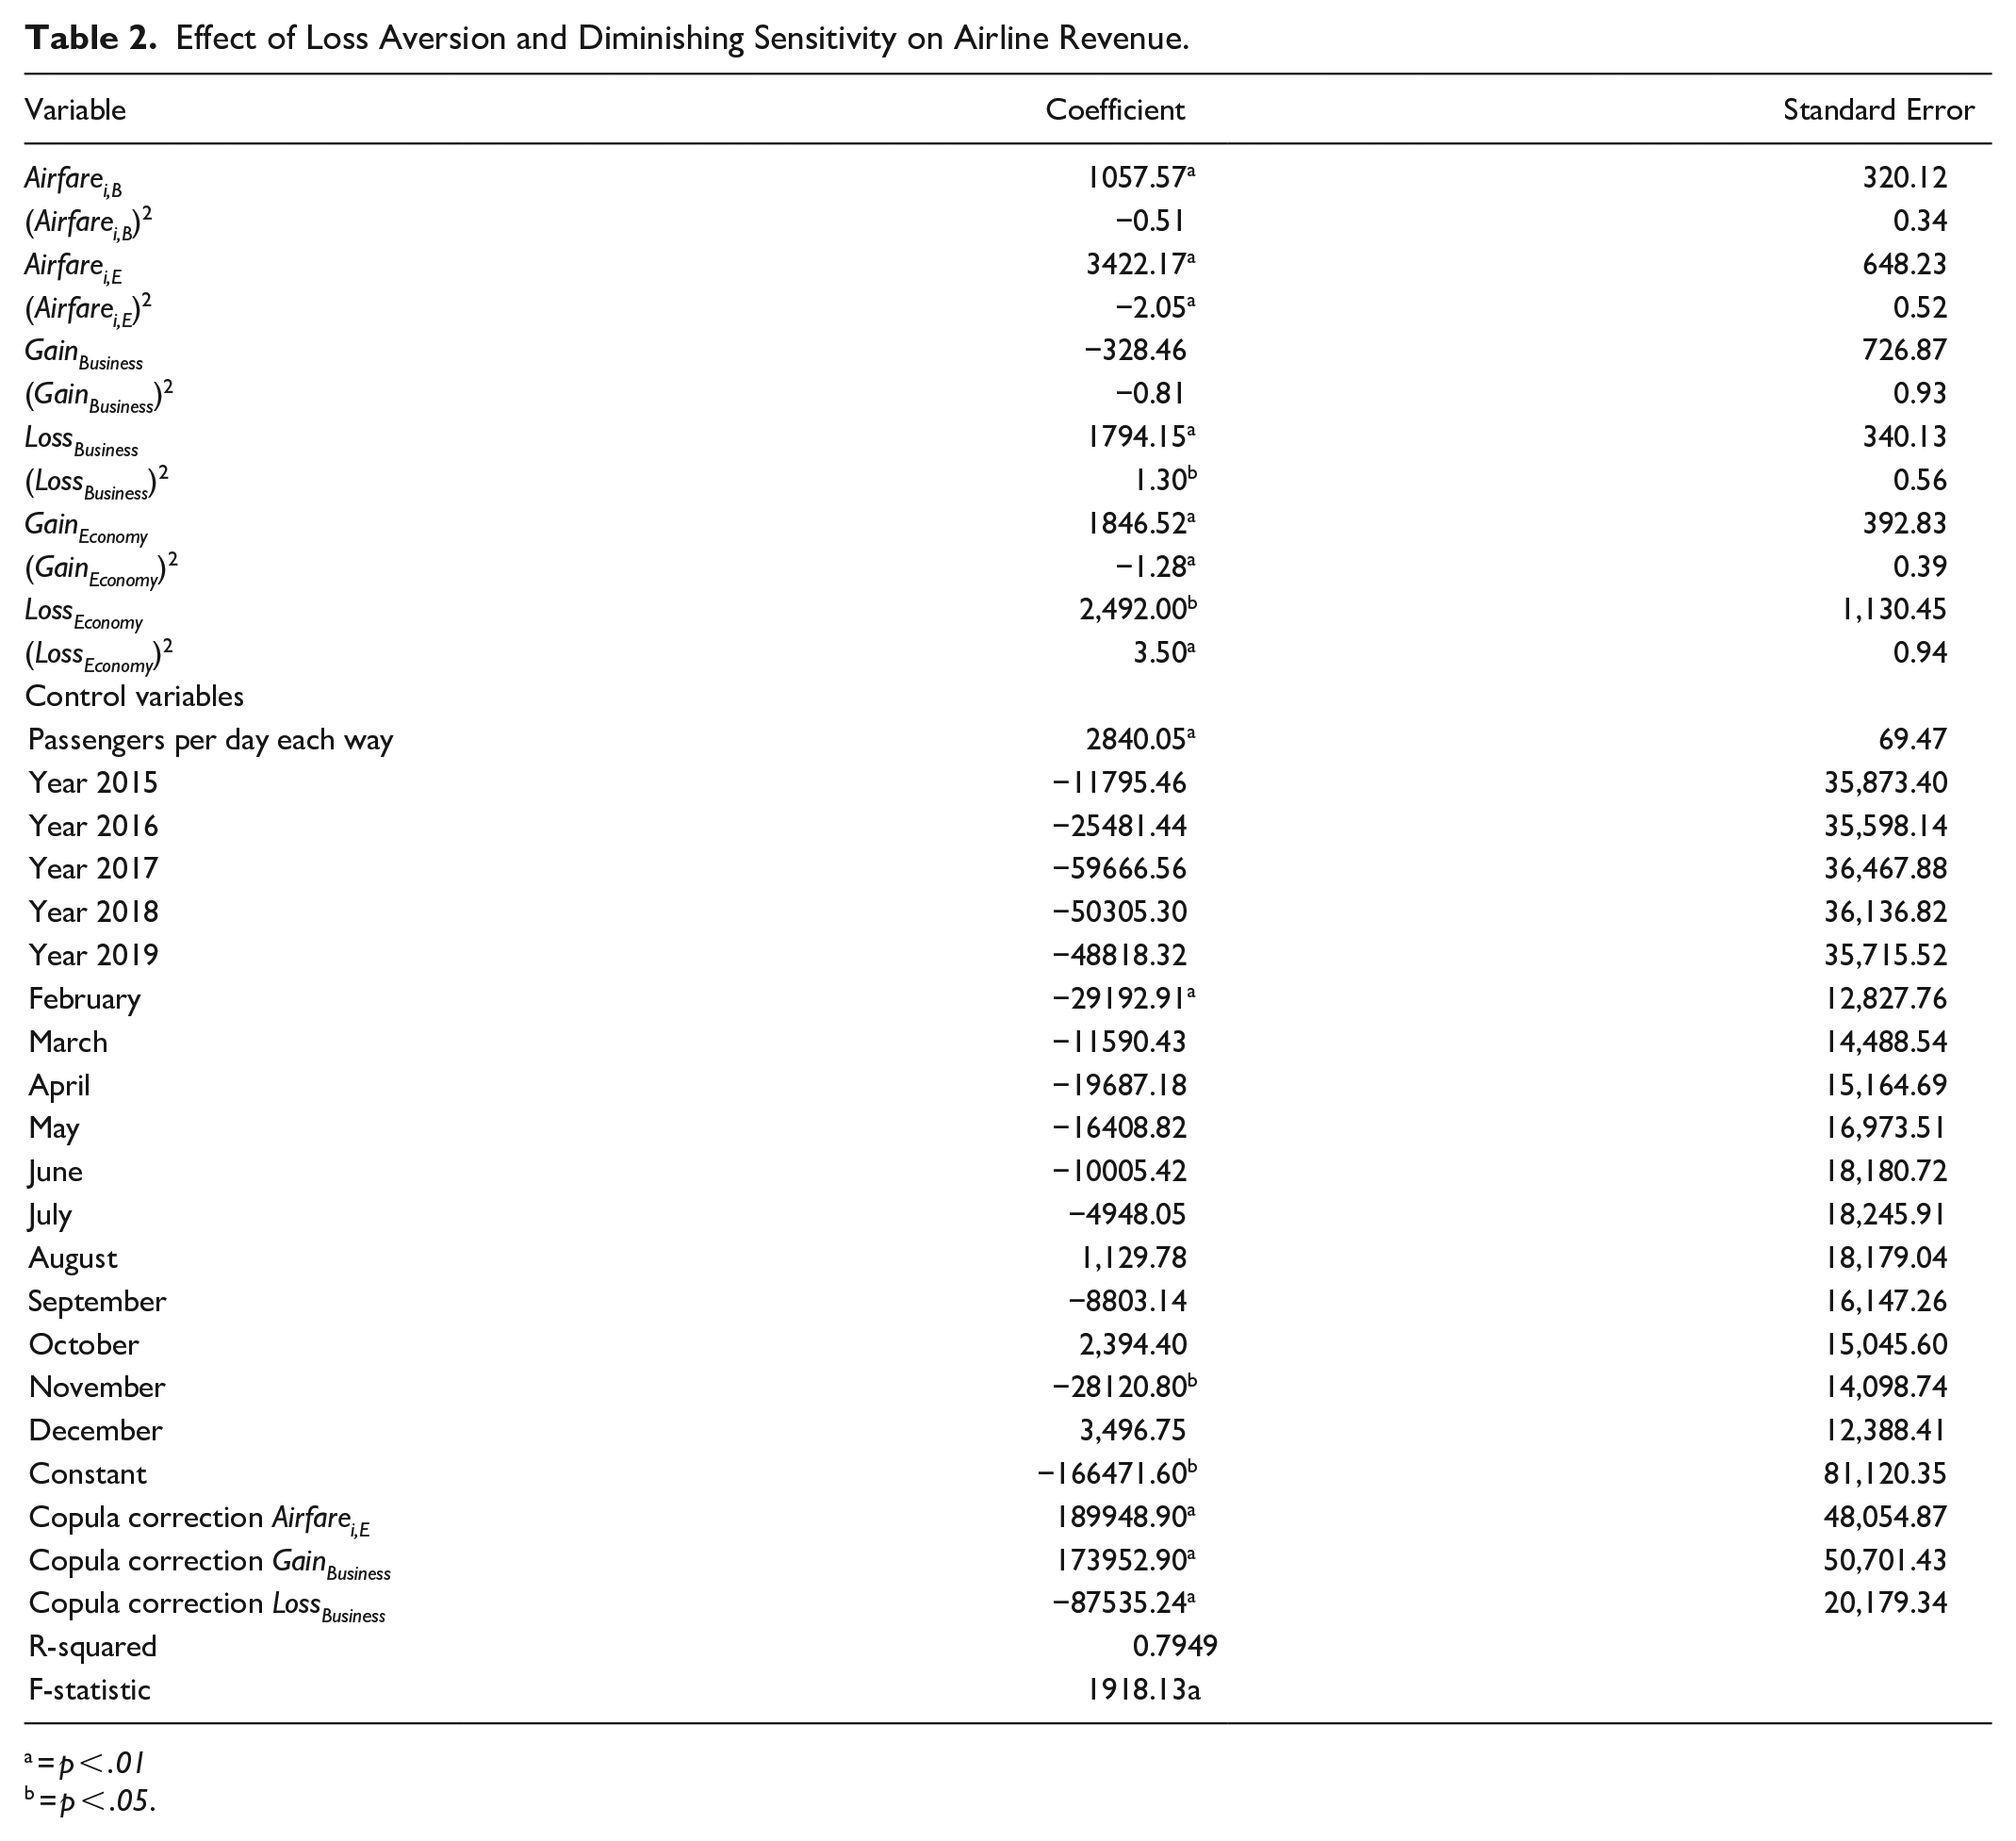
= p < .01
= p < .05.
Results
Table 2 shows the effects of the variables analyzed. Before describing the central variables our study (i.e. prospect theory-related variables), note that the variables Airfarei,B and Airfarei,E have significant and positive effects on revenue, which means that higher airfares bring in greater revenue in both business and economy cabin classes, thereby compensating the potential reduction in the number of passengers derived from those increases in airfares (i.e. higher prices could lead some people to opt for other alternatives that are more affordable but higher unit margin is achieved by airlines). As an interpretative example, the parameters associated with Airfarei,B and Airfarei,E are 1,057.57 and 3,422.17, which means that an increase by $1 causes an increment in monthly revenues of $1,057.57 and $3,422.17, respectively. Interestingly, this positive impact of increased fares on revenue is significantly higher in economy cabin class than in business cabin class (Wald test = 13.32; p < .01).
As for the gain variables we find significant and positive parameters for economy cabin classes only. This indicates that when passengers in the economy cabin class find fares lower-than-expected, there is an increase in revenue derived from the expected increment in demand. This result for the of economy cabin class is in accordance with Hypothesis 1, that lower-than-expected fares have a positive effect on revenue. We find significant and positive parameters for the loss variables of both cabin classes, showing that when passengers find airfares higher-than-expected, there is a reduction in revenue via contraction in the demand, thereby supporting Hypothesis 2 that higher-than-expected fares have a negative effect on revenue.
For business cabin class, the loss parameter is significantly greater than the gain parameter (Wald test for business = 5.24), but for the economy cabin class this difference is not significant (Wald test for economy = 0.24; p = .62). Therefore, loss aversion is supported in line with the prospect theory of Kahneman and Tversky (1979) for business cabin class only, thereby confirming Hypothesis 3 that the extent to which higher-than-expected fares decrease revenue is larger than the extent to which lower-than-expected fares increase revenue. This means that, assuming an increase and a decrease in airfares of the same magnitude, for business cabin class, the negative effect of the increase in airfares on revenue is greater than the positive effect of the decrease in airfares on revenue.
Regarding the quadratic terms reflecting the potential existence of diminishing sensitivity, we find that the squared loss variables associated with both cabin classes are significant and positive, and the squared gain variable is only significant and negative for economy cabin class. These results lead to a curve with convexity for negative value and concavity for positive values, that is, the characteristic S-shaped curve, for economy cabin class; and a convex curve for negative values for business cabin class. This outcome supports Hypothesis 4 that regardless of whether the airfares are higher or lower than expected, variations in airfares closer to the reference point bring about higher marginal effects on revenue than variations further away from the reference point, for economy cabin class; and partially for business cabin class as diminishing sensitivity only occurs for losses.
Concerning the control variables, we find that the demand-related variable “passengers per day, each way” has a significant and positive effect on revenue; as expected, more passengers per day lead to greater airline revenues; and for the seasonality variables, years do not seem to significantly exert any effect while the months of February and November show lower revenues than any other sampled month.
Discussion and Conclusions
Discussion of Results
The main purpose of this study is to investigate the effect of loss aversion and diminishing sensitivity on airline revenue and the moderating role of product and consumer characteristics that are reflected in cabin class. The results show that air travelers encode lower-than-expected airfares as gains and obtain them, positively contributing to airline revenue while they register higher-than-expected tickets as losses and avoid them, imposing negative effect on airline revenue. When the effect of loss-coded and gain-coded tickets were compared, the extent to which passengers avoid losses (vs. welcome gains) had greater impact on revenue, supporting the loss aversion mechanism in the airline revenue for business cabin class. This phenomenon is manifested differently in each cabin class due to different reference points on which passengers of each cabin class base their evaluation and different sensitivity to the quality of the in-flight services.
This study sheds new light on airline revenue management, an important subject yet has been largely neglected in hospitality and tourism literature in recent decades. While the idea and technique of modern revenue management originated from the airline industry in the 1980s, most tourism and hospitality researchers have directed their attention mainly to hotel revenue management (e.g. Abrate and Viglia 2016; Kimes 2011; Wang 2012) or restaurant revenue management (e.g. Heo 2016; Kimes 2008; Thompson 2010). As the airline industry plays a pivotal role in sustaining tourism and hospitality industries, this study provides further empirical insights on how airline travelers process price information and make purchase decisions through loss aversion and, importantly, how it is linked to the company’s actual financial outcome using actual revenue data. Specifically, this study confirms the validity of prospect theory that travelers make decisions based on their perceived potential losses or gains relative to their reference points instead of actual product prices (Kahneman and Tversky 1979; Nguyen 2016; Sönmez and Graefe 1998).
The findings of this study show that airlines’ lower (higher)-than-expected fares have a positive (negative) effect on revenue and also empirically validate tourists’ asymmetric behaviors (e.g. Nicolau 2011a; Sharma, Park, and Nicolau 2020) by identifying that loss aversion of revenues is more pronounced than the pursuit of gain, with differentiated effect for the cabin classes analyzed. The same applies to the property of diminishing sensitivity, in such a way that for economy cabin class this property is found for positive and negative differences between the paid and the expected airfare—gains and losses—but for business cabin class this property only manifests for losses. In doing so, this study provides further insights into the existing literature repository by incorporating relevant contextual factors of products related to the company’s pricing strategy and the response of the demand to that strategy.
Theoretical Implications
This study contributes to the further refinement of prospect theory by identifying a significant moderating role of airline cabin classes in loss aversion and diminishing sensitivity. Historically, studies that examined airline pricing and revenue mostly have aimed to make technical and methodological contributions (e.g. Luo and Peng 2007; Otero and Akhavan-Tabatabaei 2015; Wright, Groenevelt, and Shumsky 2010) using simulation or data-driven approaches, rather than taking theoretical considerations and human traits into account. In addition, while existing studies proposed that prospect theory mechanisms can be changed by product or customer characteristics (Chang, Chen, and Hsu 2010; Neumann and Böckenholt 2014), there has been a lack of empirical evidence that supports this proposition. In this regard, this study empirically supports the point made by Neumann and Böckenholt (2014) that product and consumer characteristics can result in consumers’ asymmetric responses to perceived gains and losses; in this study’s setting, economy and business class passengers react to lower(higher)-than-expected fares differently.
We show that while airlines’ higher-than-expected fares have a negative effect on revenue for both cabin classes, airlines’ lower-than-expected fares have a positive effect on revenue for economy cabin class only. The higher price-sensitivity of economy passengers compared to business passengers lead the former to be more attracted to these gains than business passengers. Conversely, the statement that the extent to which airlines’ higher-than-expected fares reduce revenue is larger than the extent to which airlines’ lower-than-expected fares increase revenue, is confirmed for business passengers only. Interestingly, diminishing sensitivity manifests in such a way that it is found for gains and losses in the case of economy cabin class, but only for losses in the case of business cabin class.
Lastly, this study improved the external validity of prospect theory by using and analyzing actual longitudinal airline fares and revenue data. A common limitation of most previous tourism research on this topic is that it applied experimental designs or self-administered surveys, which only enable researchers to test loss aversion and diminishing sensitivity mechanisms based on subjective self-reported responses regarding behavioral intentions or past behaviors (e.g. Chang, Chen, and Hsu 2010; Nguyen 2016; Nicolau 2008). This study fills this gap by verifying the loss aversion and diminishing sensitivity mechanisms using real longitudinal data including airline fares and revenue from 2014 to 2019. Complementing studies surveying respondents’ willingness to purchase or subjective perception per se, the current study assimilates the actual commercial data on how airline passengers’ loss averse tendency affects the revenues of airlines. The findings from the study provide strong empirical evidence to the loss aversion mechanism that is inherent in airline revenue management.
Practical Implications
The high fixed-costs and the perishable inventory in the airline industry has always necessitated successful revenue management practices of aviation business. In addition, the COVID-19 pandemic has begotten the unprecedented crisis of the airline industry. The airline revenue in 2020 was less than half of that of 2019, which is the same revenue level as it was 20 years ago (Bouwer, Saxon, and Wittkamp 2021). Affecting consumers’ travel intention and behavior in addition to the global financial crisis, the COVID-19 has created a more competitive environment where airline companies need to develop and implement sophisticated revenue management practices to remain relevant and competitive in the market post-pandemic. In this regard, several managerial implications derived from the results that take into account human behavior and the mechanisms of loss aversion and diminishing sensitivity can be a basis of developing successful revenue management strategies in the airline industry.
First, the support found for loss aversion—particularly for business passengers—is critical for pricing strategies, especially for promotional actions. We find that the decrease in revenue resulting from higher-than-expected fares is larger than the increase in revenue derived from lower-than-expected fares for business cabin class, thus, when implementing a discount—especially an abnormally large discount—these passengers may process this new information in a way that a new reference price is set in their minds. As has been shown, passengers make their decisions based on benchmarks, and so according to the available information, they will adjust those benchmarks; in other words, they will vary their reference prices.
Discounting per se does not necessarily have to bring negative effects; however, the literature shows that doing it in a systematic way can damage the image of a company. In our case, based on the results obtained, we can alert that if a firm attempts to raise prices for a flight on occasion t after offering a discount for previous occasions t-1, t-2, . . . t-n, passengers may set the discounted airfare as the new reference point and may consider the price raise as “unfair.” As an illustrative example, if an airline lowers the fare of a flight, say from $1,000 to $700, the monthly demand may increase, for example, from 8,000 to 10,000 passengers. However, if the company decides to set the fare back to the original “normal” levels (i.e. $1,000), the decrease in demand would be greater than 2,000 passengers; for example, the new demand could be 7,000 passengers. Note that as passengers changed their reference price by setting their new “normal” fare at $700, when the airline raises the fare back to $1,000, the $300 increment will reduce the demand by 3,000 passengers, which is larger than the increase in 2,000 passengers derived from the initial $300 discount.
This peculiar consequence of the loss aversion phenomenon is especially relevant in situations of crisis, or under the current pandemic, where airlines attempt to incentivize passengers by offering fares than are lower than usual. When the crisis is over and companies try to raise fares to the original levels, customers may have become accustomed to the new prices, and the increase in fares may significantly hurt the demand. A way to minimize this negative impact could be for the airline to implement small “imperceptible” increments over time until the old high fares are attained. Given that customers form a range of prices around reference prices, as long as the small increment falls within that range, customers would accept the new increased price.
Also, as diminishing sensitivity manifests, changes in airfares that are much larger (or much lower) than expected will bring smaller changes in revenues; nevertheless, if these airfares are closer to the passenger’s expected airfare, the variations in revenue would be greater. This is something to take into account for either cabin class when the actual airfare is higher than the expected airfare, and for economy cabin class when the actual airfare is lower than expected.
Limitations and Future Research
Several research limitations can point to avenues for future research directions. First, while this study secured a large amount of passenger data by focusing on the top-10 international routes (Forbes 2019), the data may not fully represent different characteristics of flight paths and airline passengers. For example, some routes may be dominated by leisure travelers while other routes have more business travelers. In addition, other unique characteristics of passengers (e.g. the difference between domestic travelers and international travelers) and of domestic flight routes (which might offer different product and services in each cabin class than our sample of top-10 international routes) can be considered when analyzing airline passenger data in future studies. By expanding airline routes considering different market segments of airline passengers, further empirical evidence on the loss aversion mechanism can be obtained.
Second, the current study only analyzed the moderating role of airline cabin classes and has shown that economy and business class passengers exhibit different patterns of purchasing behavior due to the differences in their characteristics such as reference points regarding price and expected quality of service. However, future research is advised to identify additional boundary conditions and moderating factors for loss aversion and diminishing sensitivity to further extend the findings of this study and further the understanding of airline passengers’ pricing perception and subsequent decision-making behaviors. Specifically, future research could consider factors such as carrier characteristics (e.g. low-cost vs. full-service airlines), route characteristics (e.g. long-haul vs. short-haul fights), or passengers’ brand loyalty toward airline brands to see if they moderate the impact of loss aversion on airline revenue.
Third, the current study analyzed airline revenue data from 2014 to 2019 and excluded 2020 in order to avoid the distortion posed by the pandemic in 2020 on airline demand and revenue. Therefore, the findings of this study cannot be generalized to 2020 or airline business after pandemic. As it is important to consider the impact of the COVID-19 pandemic and its associated knock-on effect on revenue management, future studies could assess the impact of the pandemic through the loss aversion mechanism. When the airline demand is fully recovered after the pandemic, future research could test if the identified mechanism is still applicable in the airline revenue management.
Fourth, our empirical analysis focuses on airfares and reference points; still, an interesting examination could be the way consumers perceive not buying a product as a loss: a foregone vacation could be a much more significant loss than a loss based on a disappointing price expectation. However, we do not have information on customers who were expecting to fly to go to a destination but in the end they were not able to. Lastly, we rely on regression analysis in line with the studies of Bell and Lattin (2000) and Klapper, Ebling, and Temme (2005) on prospect theory to quantify the effects of the proposed independent variables on the dependent variable and make parameter comparisons to test the stated hypotheses; however, other methodologies can be used to make the most of the data properties themselves, such as decomposing the annual data into a trend (long-term behavior), cycle (short-term behavior), and considering irregular components.
Footnotes
Declaration of Conflicting Interests
The author(s) declared no potential conflicts of interest with respect to the research, authorship, and/or publication of this article.
Funding
The author(s) received no financial support for the research, authorship, and/or publication of this article.