
Abstract
This study introduces a new method, named Dynamic Destination Satisfaction Method (DDSME), to model tourists’ satisfaction with a destination (and its attributes), breaking it down into an individual-level component (linked to the specific individual tourists’ perceptions) and a system-level (time-related) component (common to all the tourists). Moreover, this work develops a matrix “entropy/trend accuracy” that destination managers can use to understand to what extent managing a specific attribute has increased tourists’ satisfaction with the destination over multiyear time spans. We test the innovative method on a large data set, covering the period 1997-2015 and including almost 0.8 million observations. By doing so, we analyze tourists’ satisfaction with tourism-related sectors and attributes of Italy as an inbound tourism destination and we use the matrix to map out destination attributes over time. The findings indicate that courtesy, art, and food are strategic attributes to enhance satisfaction in the long term.
Keywords
Introduction
Despite the consensus around the usefulness of market intelligence aimed at supporting destination development planning and marketing strategies (Morrison 2019), scarce scholarly attention has been paid to the topic of monitoring tourists’ satisfaction with a destination over time and by means of a longitudinal perspective (Song et al. 2012). The aforementioned aspect constitutes an important research gap, in light of the role that scholars assign increasingly to tourism destination satisfaction as an antecedent to enhance destination loyalty in the form of revisit intentions and recommendation to others (Alegre and Cladera 2006; Song et al. 2012) that might potentially translate into enhanced destination competitiveness (Crouch and Ritchie 1994, 1999; Crouch 2011). Loyalty is the by-product of processes that develop over time, but travelers’ needs change so fast that when marketing action is taken it is sometimes too late as customer groups and market segments might have changed in the meantime (Dolnicar and Lazarevski 2009).
The objective of this paper is not to offer a measure of the attributes of destination competitiveness (Crouch and Ritchie 1994 1999; Crouch 2011), but rather to design a new method to monitor and explain tourists’ satisfaction dynamics taking into account a number of attributes that feature rather frequently in research conducted by tourism destinations themselves on international tourists. Our holistic and longitudinal approach is designed to track and compare changes in destination attributes’ associated satisfaction, allowing destination marketers and managers to better understand to what extent they can manage an attribute over time to enhance tourists’ overall satisfaction with a destination in the long term.
In more detail, we design a novel method allowing to break down tourists’ evaluations of a specific destination attribute into two different components: an individual-level component (also termed as “subjective” in the rest of the article) and a social system-level component (also termed as “structural” in the remainder of the article). Following the lead of DiPrete and Grusky (1990) from a methodological point of view, we link the individual-level component to consumer factors (e.g., demographic characteristics, vacation preferences). The system-level component relates to aspects affecting all the consumers (i.e., changes in the infrastructures and their overall quality, modification in people’s broad knowledge and attitude toward tourism), whose cumulated effect can be described and tracked through a temporal dynamic of the “average tourist’s” evaluation of a destination across repeated cross-sectional data.
Both these components can be influenced by destination marketing and management policies and decisions (albeit combined with the emergence and occurrence of unmanageable and unexpected events). However, we recognize that both the time lag by which those policies and decisions might translate into an observable effect in terms of satisfaction, and the size of this effect could change considerably across the considered destination attributes.
Our proposed novel dynamic and holistic approach fits with all the cases and situations whereby data of a discrete skewed distributed ordinal variable (e.g., tourists’ satisfaction, general appreciation, and intention to recommend) is collected periodically and therefore waves of cross-sectional data are available longitudinally. Thus, we attempt to address innovatively the challenge of studying tourists’ satisfaction with a destination building on the increasing public availability of large volumes of data (i.e., open “big” data).
The current paradigm shift toward data accessibility—also witnessed by the introduction and implementation of the European Regulation EU 692/2011—is taking place in a number of destinations worldwide at different levels (see Morrison 2019). Furthermore, microdata are made accessible by supranational institutions such as the World Bank (e.g., http://microdata.worldbank.org/index.php/catalog/central), and by many National Statistical Offices, Central Banks and NTOs. One of such cases is a nationwide satisfaction survey that is conducted on a monthly basis by the Bank of Italy (Banca d’Italia 2019) and relates to the dynamics of tourist satisfaction with a number of service and nonservice destination attributes (e.g., https://www.bancaditalia.it/statistiche/tematiche/rapporti-estero/turismo-internazionale/distribuzione-microdati/file-dati/index.html).
Despite the fact that the method is applied to a single yet important global tourism destination such as Italy—that ranks in the top five destinations in terms of tourism arrivals (UNWTO 2018)—it could be potentially applied to other contexts (i.e., regional or national tourism destinations) where official data are collected in a similar fashion and, possibly but with a few caveats, also to Internet user-generated content about tourism destinations. As such, the method generates opportunities to use tourists’ evaluation data collected at multiple moments as a powerful market intelligence tool for decision makers and destination marketers active virtually in any tourism destination in the world.
The method (and related approach) displays two main distinctive features. First, it is dynamic, as the evolution of satisfaction is tracked over a multiyear time span. Second, it is holistic, because it considers the tourism destination under analysis as a bundle of both tourism-related sectors and other relevant destination attributes that can be either tangible or intangible. To our knowledge, this is the first study in the tourism-related literature proposing a methodology able to simultaneously track (and compare) the dynamics of tourists’ satisfaction for nonservice destination attributes and to assess their pattern over a long time span.
Furthermore, this work develops a matrix—termed as the Dynamic Destination Satisfaction Matrix (DDSM)—that can be used as a destination marketing and management tool by destination marketers and policy makers. An application of the matrix to the Italian national context is provided, emphasizing important long-term managerial implications for Italian destination managers and tourism policy makers.
To achieve our research goals, the article is organized as follows. The second section reviews the relevant literature and identifies the research gap, and the third section describes the data set and elucidates the methodology. In the fourth section, the results are discussed and the DDSM introduced and discussed. The last section draws the concluding remarks and offers policy making and destination marketing implications for the case study the DDSM is applied to.
Theoretical Framework and Literature Review
The construct of customer satisfaction is generally understood as the extent to which the consumer’s perceptions of a product or service match expectations (Oliver 1980). The cognitive evaluation based on the disconfirmation paradigm has been explored in a number of customer satisfaction studies in travel and tourism (Kim 2018), even if satisfaction has been also conceptualized as an overall affective response/judgment (Žabkar, Brenčič, and Dmitrović 2010).
However, using perceptions to model satisfaction requires to make assumptions about whether consumer decision behavior can be explained by compensatory or noncompensatory models (Srinivasan 1988). In the former case, a weakness in one attribute is compensated by a strength in another (i.e., the consumer considers the relative importance of each attribute to make a purchase decision or to express her level of satisfaction). Noncompensatory models postulate that consumers establish a minimum acceptable level for each important product attribute and become satisfied only if each attribute (conjunctive approach) or a few attributes (disjunctive approach) equals or exceeds this minimum level (Pizam, Shapoval, and Ellis 2016).
Independently from the chosen approach, there seems to be a huge measurement problem as a tourism destination consists of a bundle of products, services, facilities, and experiential attributes (see Žabkar, Brenčič, and Dmitrović 2010; Rigall-I-Torrent and Fluvià 2011) that are not easy to be defined, confined, and measured (Crouch 2011). Further complexity arises as the customers’ cognitive processes can also vary over time (LaBarbera and Mazursky 1983) whereas most of the studies focus on the time when the evaluation actually occurs.
Extant literature emphasizes the importance to observe tourists’ sectoral perceptions and behaviors within a temporal pattern and recommends avoiding a mere static approach by, at least, comparing two different snapshots (Bowen and Clarke 2002; Song et al. 2012; Pike et al. 2016). Certainly, there is a relevant research gap here as, to our knowledge, no prior study has tracked explicitly the temporal path of tourist satisfaction evaluations of a tourism destination.
When the analysis becomes dynamic, scholars should pay more attention to the benchmark against which tourists’ subjective expectations are compared. This benchmark changes over time as a consequence of the dynamics in the standards of service quality (Yucelt and Marcella 1996; Tian-Cole and Crompton 2003; Hu et al. 2019), and price levels (Chen and Tsai 2007) partially affected also by destination marketing and management policies (albeit combined with the evolution of broader economic, social, or cultural factors as well as the occurrence of unexpected/unmanaged events). Accordingly, any dynamic analysis of satisfaction should consider that a destination attribute performance depends on two components: a subjective and a structural component that reflect tourists’ perception/expectations and the performance of the attributes’ change over time.
From a wider social sciences perspective, a similar approach is suggested in DiPrete and Grusky (1990). They recall that in the analysis of quantitative data from cross-sectional surveys there are two interrelated components: a pure individual effect and a system-level outcome that has to be accurately studied—even when the main interest is on the individual level—because it has a direct influence on individual level parameters.
Thus, we assume that the satisfaction with a destination attribute depends on the interaction between an individual-level (subjective) component, linked to tourists’ individual perceptions and expectations, and a system-level (structural) component conceptualized and modeled as the dynamic of the average tourist’s satisfaction (a temporal dynamics common to all the tourists). Accordingly, the latter reflects the dynamics of tourists’ satisfaction with an attribute, that are more directly related to long term tourism destination development strategies and less to marketing or promotional short-term tactics.
As satisfaction with various elements of the destination could enhance tourists’ overall satisfaction with the destination (Denstadli and Jacobsen 2011), the association among the system-level components for each attribute and the structural component of overall satisfaction can be used to assess—through a holistic approach—how changes in the attributes were able to influence the overall satisfaction with the destination along the considered time span.
However, we acknowledge that DMOs have different capabilities to intervene on different destinations attributes. Borrowing the terminology used by Tasci and Gartner (2007), destination attributes can be controllable (dynamic), semicontrollable (semidynamic), or uncontrollable (static). Controllable or semicontrollable attributes are expected to be related to the services that customers receive from firms (i.e., accommodation, food, leisure facilities). Semicontrollable or uncontrollable attributes would be more frequently invisible/intangible nonservice components whose performance strongly depends on broader institutional, economic, cultural, and historical factors (i.e., heritage, friendliness, courtesy, efficiency, reliability, staff competence, other tourists’ and residents’ behaviors).
Regarding the methodology, a core aspect of this work relates to the information bias associated to satisfaction at the individual level. In fact, without explicit hypotheses, respondents’ heterogeneity prevents from considering a time series of unconditional average satisfaction statements expressed at different moments in time by different tourists as an unbiased proxy of the system-level satisfaction dynamics. Interestingly, Pizam, Shapoval, and Ellis (2016) encourage scholars to take into account cultural differences: indeed, different perceptions of service could exist in different cultures and services might not be expected to deliver identical functions or stimuli across various cultures. A measurement bias is also expected, given the equivalence of the chosen scales across different respondents. Araña and León (2013) suggest testing and correcting for scale response bias: however, in the scholarly travel and tourism research, self-satisfaction evaluation scales are much more common (Prayag, Hassibi, and Nunkoo 2018).
In such cases, it is possible to reduce the biases associated with individual-level effects by estimating conditional statistical models whereby individual satisfaction statements are expressed as a function of exogenous variables accounting for respondent heterogeneity. Several frequently used exogenous variables are tourists’ sociodemographic characteristics (Yu and Goulden 2006; Alegre and Garau 2010), cultural backgrounds (Turner, Reisinger, and McQuilken 2002; Caneen 2003; Mariani and Predvoditeleva, 2019), country of origin (Wong and Law 2003; Agyeiwaah et al. 2016), travel purpose (Buhalis 2000; Fuchs and Weiermair 2004), length of stay (Sarra, Di Zio, and Cappucci 2015; Jarvis, Stoeckl, and Liu 2016), and past experiences (Yuksel 2001; Lehto et al. 2004).
The aforementioned issue is addressed by the literature in many ways. The simplest approach to study the system-level component in the satisfaction statements is through comparisons of cross-sectional averages. That way, changes in the “average tourist’s” satisfaction, synthetize the effect of changes intertwined in the system-level antecedents of satisfaction, that is, an average effect that is visible as a temporal dynamics common to all the tourists (Légaré and Haider 2008). Mowen et al. (2005) weight data to reduce the effect of sociodemographic characteristics. Kuentzel and Heberlein (2003) use indicators of change across the 3 samples that they consider. Bradley and Sparks (2012) compare mean changes for homogenous groups while Bernini and Cagnone (2012) apply a multiwave LISREL model using gender, economic status, country of origin, and previous visits as explicative variables. All the aforementioned approaches are not designed to model and forecast temporal dynamics directly. A viable and interesting approach could be a multilevel model with time-series components (Modugno, Cagnone, and Giannerini et al. 2015). The technique conjugates the flexibility of mixed effect models together with the possibility to model and forecast the time dynamics directly. Unfortunately, this solution is designed for continuous variables (or for ordinal variables with symmetric distribution): thus, it can hardly be used to analyze the dynamics of satisfaction statements. Indeed, generally the distribution of satisfaction statements is concentrated in noncentral values of the rating scale, preventing to assume that the distance among numbers exactly represents the distance among response categories.
In this article, we suggest to augment a Cumulative Logit Model (CLM) with parallel assumption (McCullagh 1980) with a trend component that captures the system-level effect. Among the specifications expressly conceived to assess the intensity and significance of causal relationships between bounded and ordinal scale variables, violating the normality and homoscedasticity assumptions, CLM is more parsimonious and less difficult to interpret if compared to alternatives.
By augmenting a standard CLM with a trend component, we assume that the standard CLM specification accounts for individual-level outcomes, while the system-level outcomes may be estimated by a deterministic trend of appropriate complexity. Additionally, we suggest keeping the trend specification “smooth” (i.e., simple), as structural changes in satisfaction levels are expected to occur slowly over time consistently with previous literature (Gartner 1986; Pike et al. 2016; Park, Lee, and Miller 2015; Pham, Nghiem, and Dwyer 2017).
In synthesis, measuring tourist satisfaction dynamically is a key element of a destination management and marketing strategy but the analysis of raw data sets may seriously bias results and mislead researchers as well as management and policy decisions based on them (Araña and Leon 2013). Subjective and trip-related influences can engender serious interpretative problems when satisfaction evaluations are read in strategic terms or used as a yardstick to evaluate destination management performances over time.
For instance, a destination A may be visited in year 1 and year 2 by distinctively different travelers. The possible discrepancy in the overall evaluation of the destination in the two years might be due to the fact that in year 1 the sampled respondents were mainly young and low-income travelers while in year 2 the sampled respondents were mainly older and wealthier travelers. In such a situation, we suggest controlling the subjective effect associated with different user groups, describing the “pure” dynamic of satisfaction assessments in the form of a regular trend. Focusing on the latter component enables to avoid designing strategies that are inconsistent with changes taking place in the external environment (Dwyer and Edwards 2009) and allows to assess the costs of sustaining destination competitiveness in the long term (Crouch and Ritchie 1994, 1999; Song et al. 2012). The next section, by proposing a methodological innovation, suggests a possible solution to address the aforementioned research issue both dynamically and holistically.
Data and Method
Data
We retrieved tourist satisfaction statements (including travelers’ evaluations) from a nationwide survey about inbound visitors, administered since 1997 by the Italian Exchange Office and since 2008 by the Central Bank of Italy, through face-to-face interviews at 82 border locations. The questionnaire is administered at the end of an international journey to Italy and consists of 48 questions, including satisfaction statements related to destination attributes, sociodemographic characteristics, travel purposes, expenditure, and trip-related factors. Travelers express their satisfaction with eight tourism-related service sectors, destination attributes and assets (reported in Table 1 as dependent variables), using a 10-point scale anchored from 1 (very bad) to 10 (excellent).
Variable Description and Statistics.
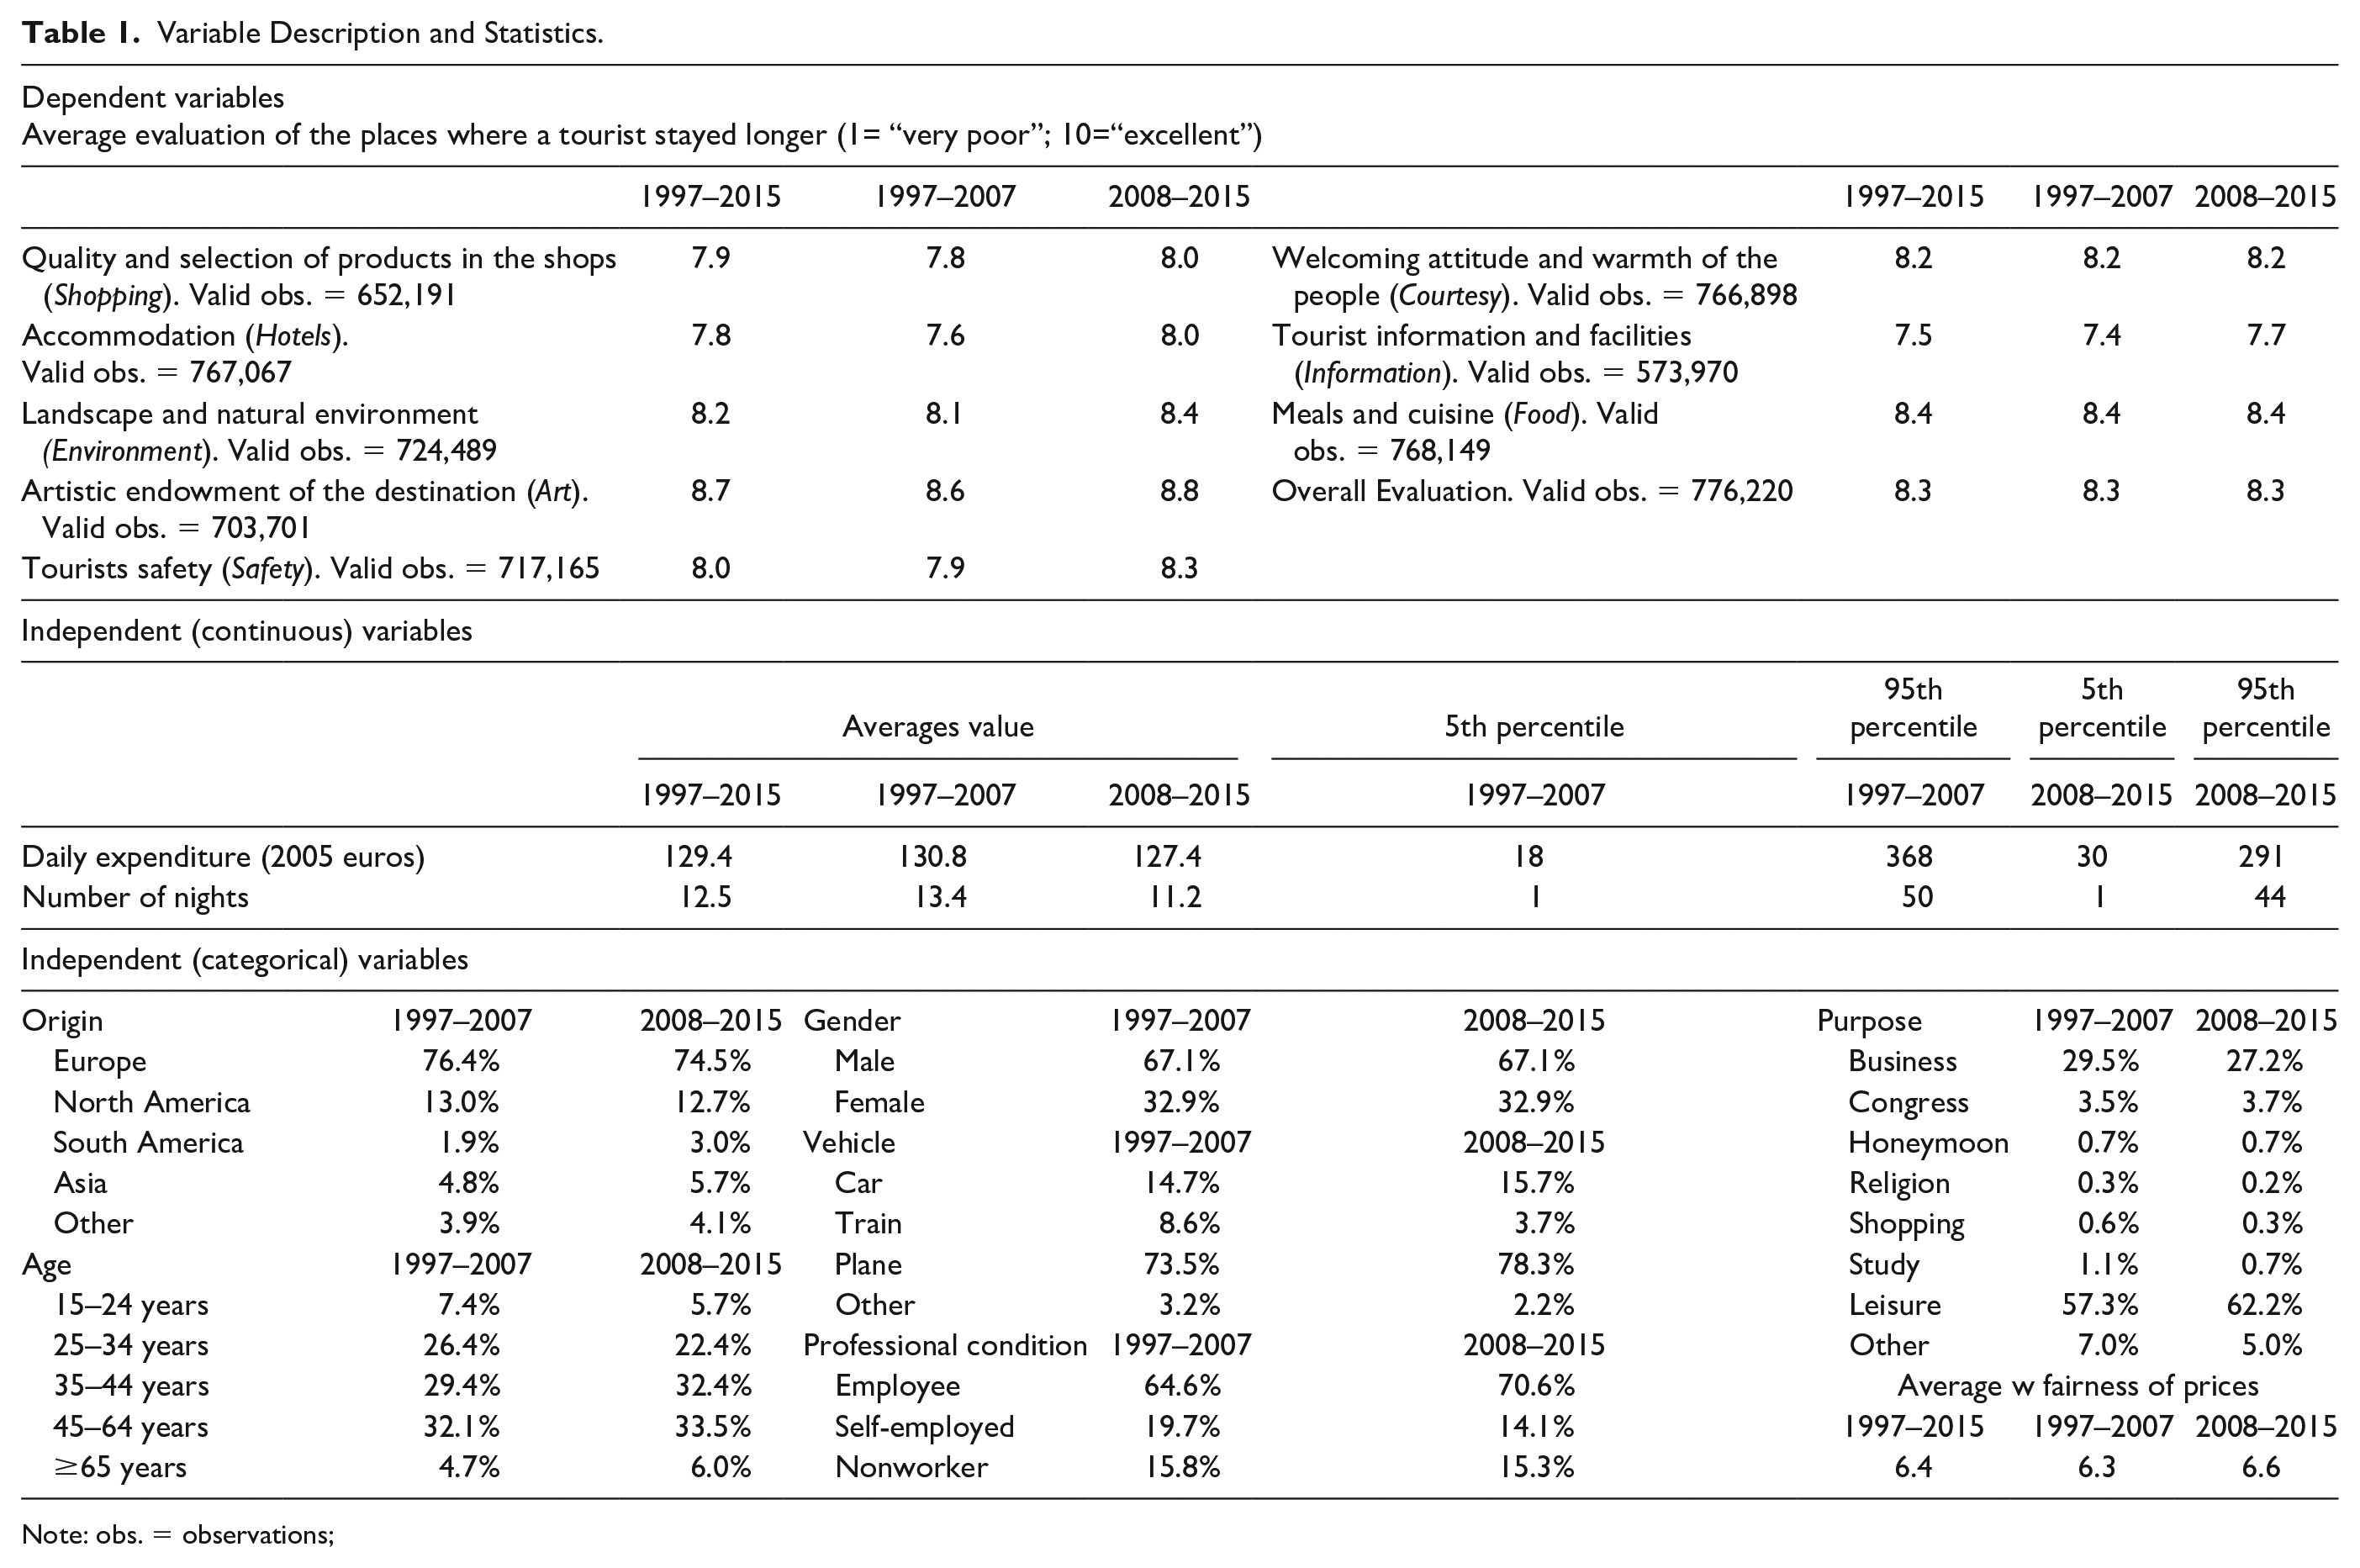
Note: obs. = observations;
Tourists are also required to provide evaluations about price and the overall tourism experience. The survey is administered on a regular (annual) and continuing basis in many locations allowing access to Italy as a country destination. It is designed to be representative of the inbound flows and therefore the sample includes all types of visitors. The data set, pooling together the visitors of all the Italian provinces, includes 1,249,706 observations, covering the time span 1997–2015. To be consistent with the UNWTO definition of tourism, we exclude same day travelers. We also exclude tourists who do not answer all the questions regarding satisfaction. The final database consists of almost 0.8 million tourists who spent at least one night in a hotel. Table 1 provides some statistics of the sample composition along with their average values (for continuous variables) or relative frequencies (for categorical variables), with reference to both the whole time span, and the period before the latest global economic crisis taking place in 2008.
Overall satisfaction is high (8.3) and only the attributes of Art and Food do better, while the lowest average level of satisfaction pertains to tourist information. The analysis of satisfaction dynamics suggests that the average overall satisfaction remains stable between the two periods (before and after the 2008 global economic crisis). The lowest increase recorded relates to satisfaction with Food and satisfaction with Courtesy. Results are not surprising as the former is subject to a ceiling effect (it already gets the highest average satisfaction), while the latter is a semidynamic/static asset that reflects residents’ culture and attitudes toward tourists. The average performance of the other sectors/attributes has increased between 0.2 and 0.4 percentage points reaching a peak for Safety (this latter attribute’s increase is supposedly the reflection of the terrorist attacks that have taken place in other competing European country-destinations).
In relation to the exogenous variables, the modal respondent is a European male, aged between 45 and 64, working as employee and reaching Italy by plane for a leisure trip. A descriptive comparison of the precrisis and postcrisis average figures highlights that the share of tourists reaching the destination by train has more than halved, reflecting some well-known problems of the Italian rail transportations (see Delaplace et al. 2014) and a very slow (and recent) growth of high-speed connections, compared with that of low-cost flights. Moreover, although tourist satisfaction increases across all of the destination sectors and attributes, Italy is scarcely attractive for Asian travelers, and also for the youth segment. The share of self-employed, as well as that of business and congress travelers, narrowed over time, thus translating into lower average daily expenditure. Furthermore, Italy is losing appeal in the perception of the wealthiest international tourists: it is worth noting that perceived fairness of prices reaches the lower average values.
The above comments on (unconditional) average satisfaction dynamics suggest that a cross-sectional average of individual satisfaction statements—expressed at different moments in time by different tourists—is able to reduce the bias stemming from the respondents’ heterogeneity related to their country of origin. From a statistical viewpoint, large samples and the representativeness of the survey could make the cross-sectional average robust to the aforementioned heterogeneity bias.
In the next section we introduce a more robust approach.
A Method for the Dynamic Evaluation of Satisfaction: The Dynamic Destination Satisfaction Method (DDSME)
In this section, we illustrate a method for the dynamic evaluation of satisfaction with a tourism destination, the Dynamic Destination Satisfaction Method (DDSME), which is particularly suitable to track tourism destination satisfaction trends with repeated cross-sectional data.
For the sake of clarity, in this study the method is illustrated by focusing on a modeling approach whereby we have nine r = (1, . . . , 9), different dependent variables stemming from repeated cross-sectional data: in particular we consider the tourists’ satisfaction with 8 attributes of a tourism destination and the overall satisfaction with the destination. Data take ordinal values from s = 1 (very bad) to s = 10 (excellent) and are collected on an annual basis over an extended multiyear period.
Several models can be employed for such a kind of data analysis, with cumulative link models being the most popular ones. A cumulative link model can be motivated by assuming that the observed ordinal variable for individual i,

In such a setting,
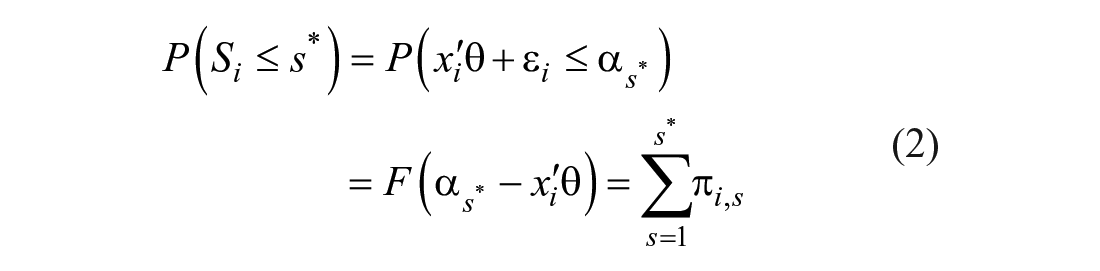
where the error
We estimate an inverse CLM specification for each considered dependent variable assuming the following dependence structure:

where
Thus, with eq. (3), we assume that the independent variables are linearly related to the log of the inverse odds. The inverse odds numerator
For the sake of parsimony, parallelism of the regression slopes is assumed (an in-depth analysis of the individual contribution goes beyond the scope of this work). Thus, our CLM can be understood as a set of binary logistic regressions all represented by parallel lines, with increasing intercepts.
We will not report statistics regarding the MCA component in the Results section as their interpretation is neither straightforward nor the primary focus of this work. Following the lead of Nenadic and Greenacre (2007), we perform MCA using the “adjusted” option that improves the MCA solution by rescaling the coordinates of the solution to best fit the pairwise cross-tabulations of the main diagonal of the Burt matrix. This way we adjust the inertias (considering the overestimation of the total inertia), keeping the optimal scaling properties of MCA. That said, with this option, eigenvalues are calculated only for an optimal fraction (in our case, 32 dimensions) of all possible dimensions accounting for 51.6% of the total variance. In the following, we model the individual effect with the first 6 components as they account for 49.1% of the total variance.
We model the structural dynamic of the performance of the rth dependent variable by augmenting the CLM specification with a deterministic trend—common to all the individuals—as follows:

with t = 1, 2, . . . , T being the number of years considered in the analysis. We embrace a parsimonious approach allowing for a maximum number of H = 3 regressors; then we choose the best specification during the estimation of eq. (1), based on the Akaike information criterion. H = 3 is always the most optimal choice even performing likelihood ratio tests comparing models with H = 3 and H = 2. This is consistent with literature that has found that destination quality indices for mature (European) destinations (e.g., Fuchs and Weiermair 2004) show a trend-cycle structural component with frequency that is always higher than 6 years in the destinations’ quality dynamics: as we focus on a 19-year time window, H = 3 seems suitable to capture all of the structural changes.
All the parameters are estimated on the full sample (T = 19). We estimated 9 CLM (one for each attribute in addition to one for the overall satisfaction), through maximum likelihood estimation.
In general, a CLM coefficient quantifies the variation in the
To allow comparisons of the structural (time dependent) contribution to satisfaction across different times and sectors/attributes we consider the values taken by the following transformation:
Results
Dynamic Destination Satisfaction Matrix (DDSM)
The values of the estimated coefficients for the time trends
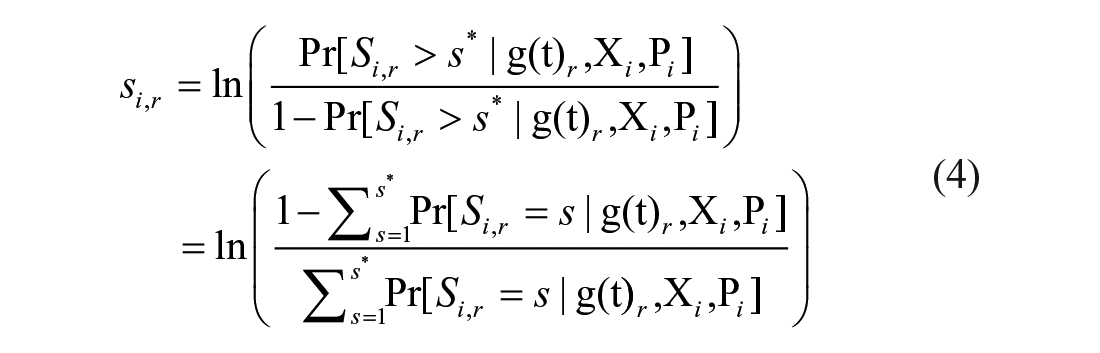
In order to provide destination marketers and managers with more interesting insights from market research (Morrison 2019) we suggest to represent the results stemming from our methodological contribution in the form of a matrix that we term as Dynamic Destination Satisfaction Matrix (DDSM) (see Figure 1).
The Dynamic Destination Satisfaction Matrix (DDSM).
On the Y axis we represent the entropy of
This way, destination managers can cluster the destination attributes and sectors into the four quadrants of the DDSM matrix, by treating the central value (e.g., the mean) as the split value.
In the left-hand-side quadrants, the matrix displays those attributes that show a lower association, over time, between their system-level satisfaction (i.e., the satisfaction common to all the tourists) and the trend in overall satisfaction. If an attribute that has been the object of long-term commitment and investments in terms of tourism policies and marketing activities toward tourism destination development appears on the left-hand-side of the matrix, the DMOs’ actions are supposed to be not as effective in modifying the overall satisfaction of the average tourist as they could have been. This does not rule out that these attributes could affect the overall satisfaction of a specific subgroup of tourists, as the matrix does not represent the subjective component of the satisfaction evaluation (the individual effect). Symmetrically in the right-hand-side of the matrix, we find attributes that have a direct effect on the overall satisfaction at the system level, that is, across different groups of tourist (over time).
In the upper quadrants, we expect to observe the controllable or semicontrollable attributes. In addition, the upper quadrants include uncontrollable attributes when, as suggested by Tasci and Gartner (2007, p. 421), “they can be interpreted in different ways giving it a semi-controllable feature.”
In the lower quadrants, we expect to find the less dynamic attributes, that is, attributes more related to the broader economic, institutional, historical, social, or cultural factors over the period observed. In particular, in the bottom quadrants of the matrix we can identify the uncontrollable and semicontrollable attributes or even the controllable attributes when they are not subject to destination marketing and management strategies.
Attributes placed on the right-hand-side upper quadrant are worth to be managed with a long-term commitment as they respond to DMOs’ activities showing, over time, a strong direct relationship with the overall satisfaction of the average tourist. Attributes placed in the right-lower quadrant are also “relevant” for the average tourist’s satisfaction even if they are difficult to manage or even not considered (unmanaged) by the DMOs. The attributes placed in the left-hand upper quadrant need a special attention as they can be managed more easily and therefore potentially able to modify the individual component of the overall satisfaction (when marketed with a segmentation logic to increase the satisfaction of particular groups of individuals). Finally, in the left-hand lower quadrant we find attributes hardly manageable (or unmanaged) that do not have a direct effect on overall satisfaction across different groups of tourists (at the system level).
An Empirical Application of the New Method and the DDSM
The values of the estimated coefficients for the trend (γr,h) and the perceived fairness of prices (βr) are reported in Table 2 along with statistics of models’ adequacy. We always report 3 gamma coefficients (h = 3) as all the Akaike information criteria were in favor of the most complex specification among the estimated ones.
Estimated Coefficients for the Dynamic of Tourism Satisfaction With Each Attribute.
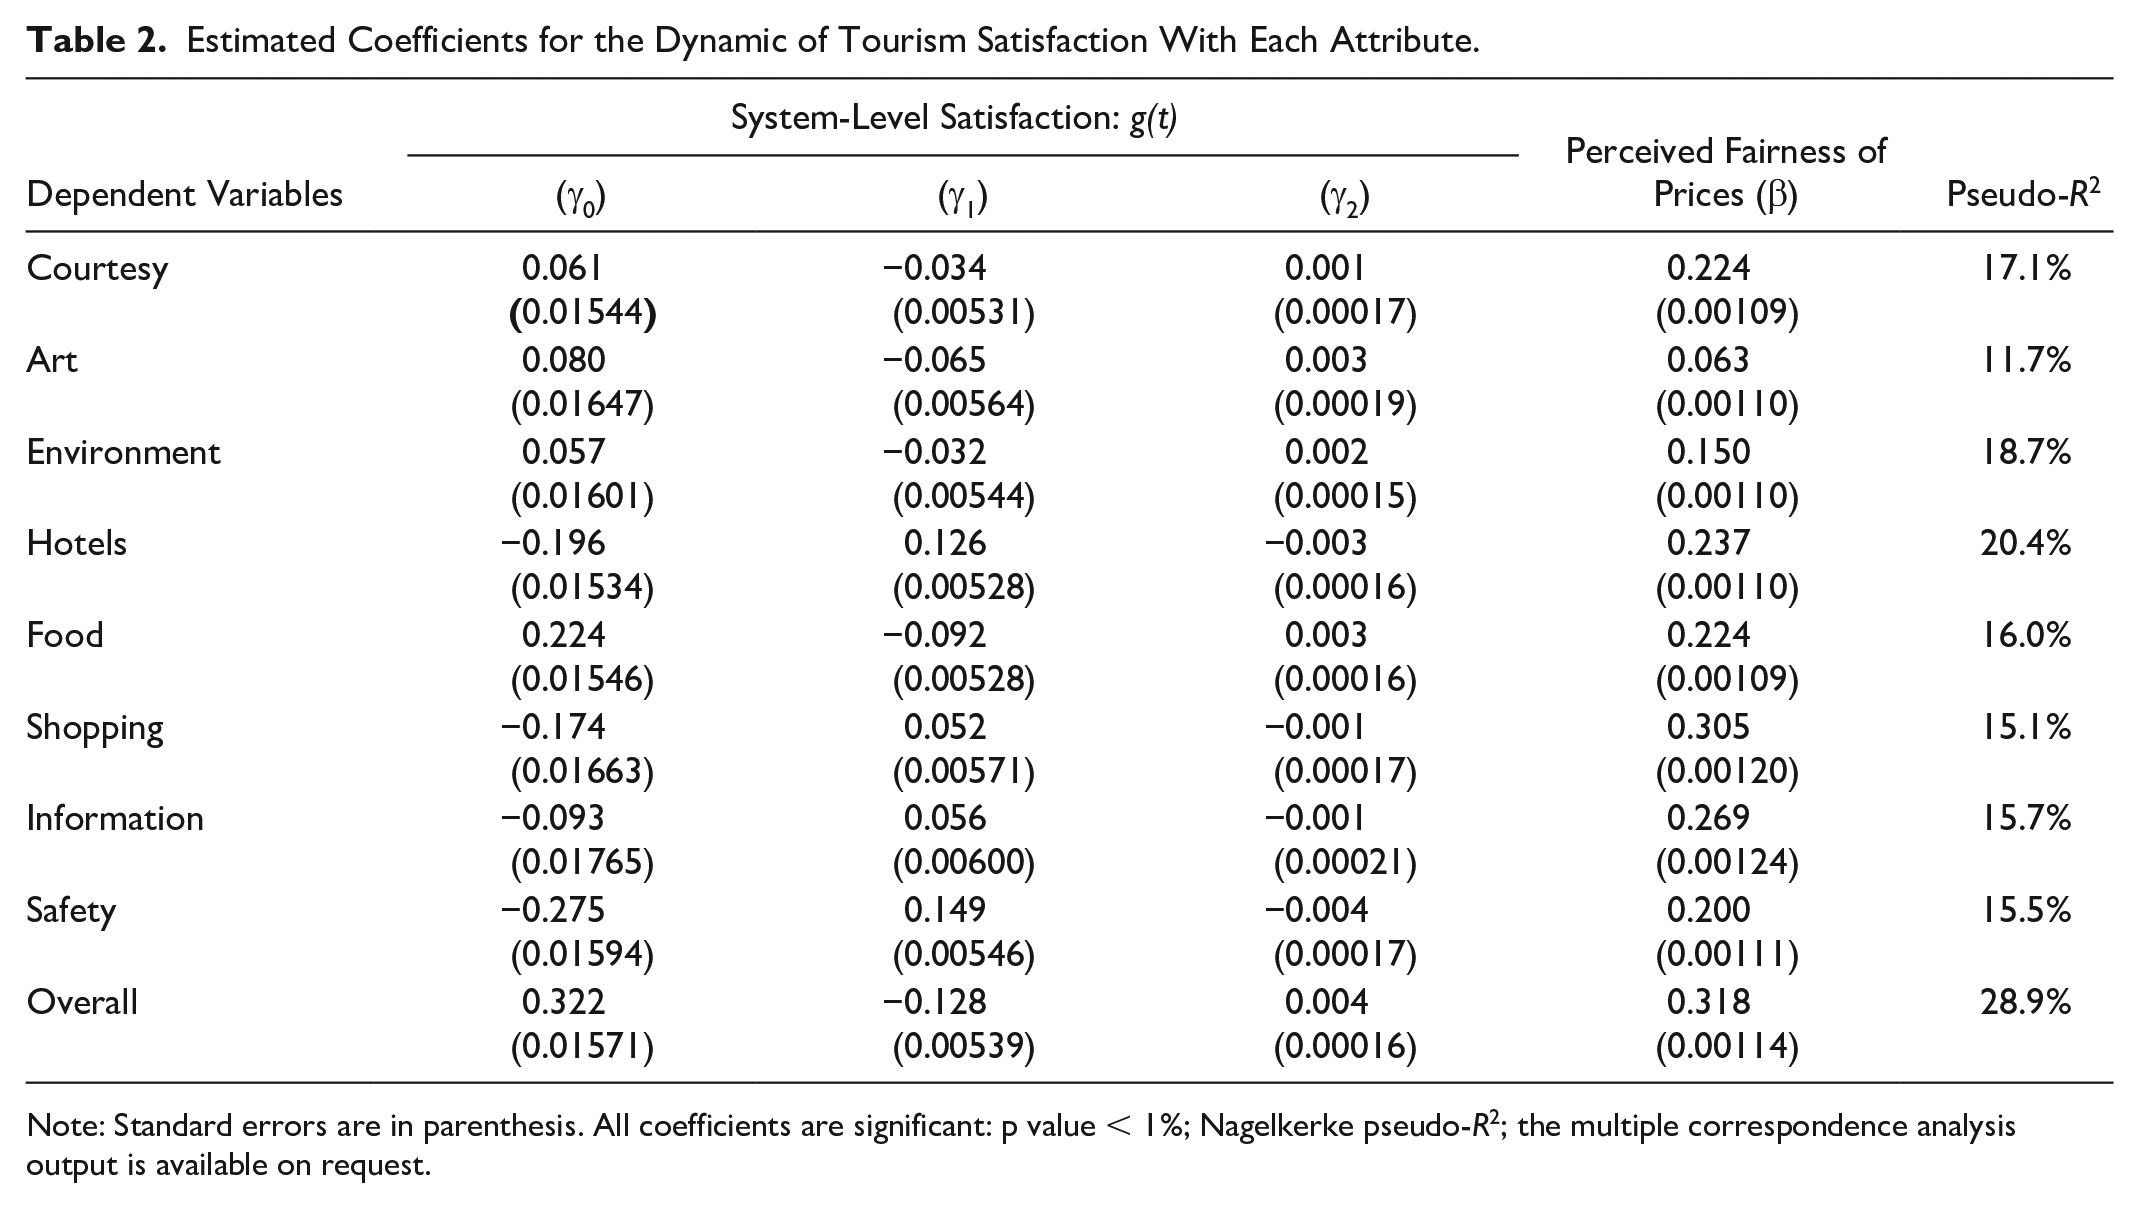
Note: Standard errors are in parenthesis. All coefficients are significant: p value < 1%; Nagelkerke pseudo-R2; the multiple correspondence analysis output is available on request.
All the nine estimated models give better predictions than those based on the marginal probabilities for the outcome categories (p values of the associated χ2 tests are always less than 1%). More importantly, the models including the g(t) trend specification give a significant improvement over the CLM without g(t) for each attribute as shown by the nine analyses of variance carried out (available on request). We conclude that the existence of a significant system-level effect over the 19 years considered is always supported by the data.
The goodness-of-fit statistic reaches a peak of 28.9% in the model for overall satisfaction. As far as the sectors/attributes are concerned, the pseudo-R2 ranges from 11.7% to 20.4%, a differential reflecting different capabilities of the exogenous variables to explain/predict satisfaction with different attributes. In particular, satisfaction with the artistic endowment of the analyzed country destination (i.e., Italy) displays the lowest R2, suggesting that our explanatory variables are not capable to explain much of the variance of the dependent variable over the 19 years considered. On the contrary, the higher the overall fit (R2) when satisfaction with accommodation (and with others nonservice attributes such as landscape and natural environment or the courtesy of local people) is modeled, it indicates a greater responsiveness of these attributes to destination marketing and management efforts.
Consistently with Chen and Tsai (2007), we find a positive (direct) effect of the overall perception of the price fairness on the probability to be satisfied. In fact, the coefficients (βr) are always positive and significant (see Table 2). “Price elasticity” is higher for the overall satisfaction (as expected) given that the evaluation of prices fairness relates to the overall price system. Considering specific sectors/attributes, βr varies from 0.063 to 0.305 reaching these extreme values when satisfaction with Art and Shopping are modeled (respectively). The strong dependence of satisfaction for Shopping on price perception is consistent with previous literature (Wu, Wall, and Pearce 2014; Choi, Heo, and Law 2016). On the contrary, for nonreproducible assets (Art and Environment above all), the overall value-for-money effect is much weaker.
Regarding the dynamic specifications of our models, that is, the systemic component of satisfaction, we suggest to shift the focus from estimated coefficients (that are always significant but not interpretable individually) to their graphical representation
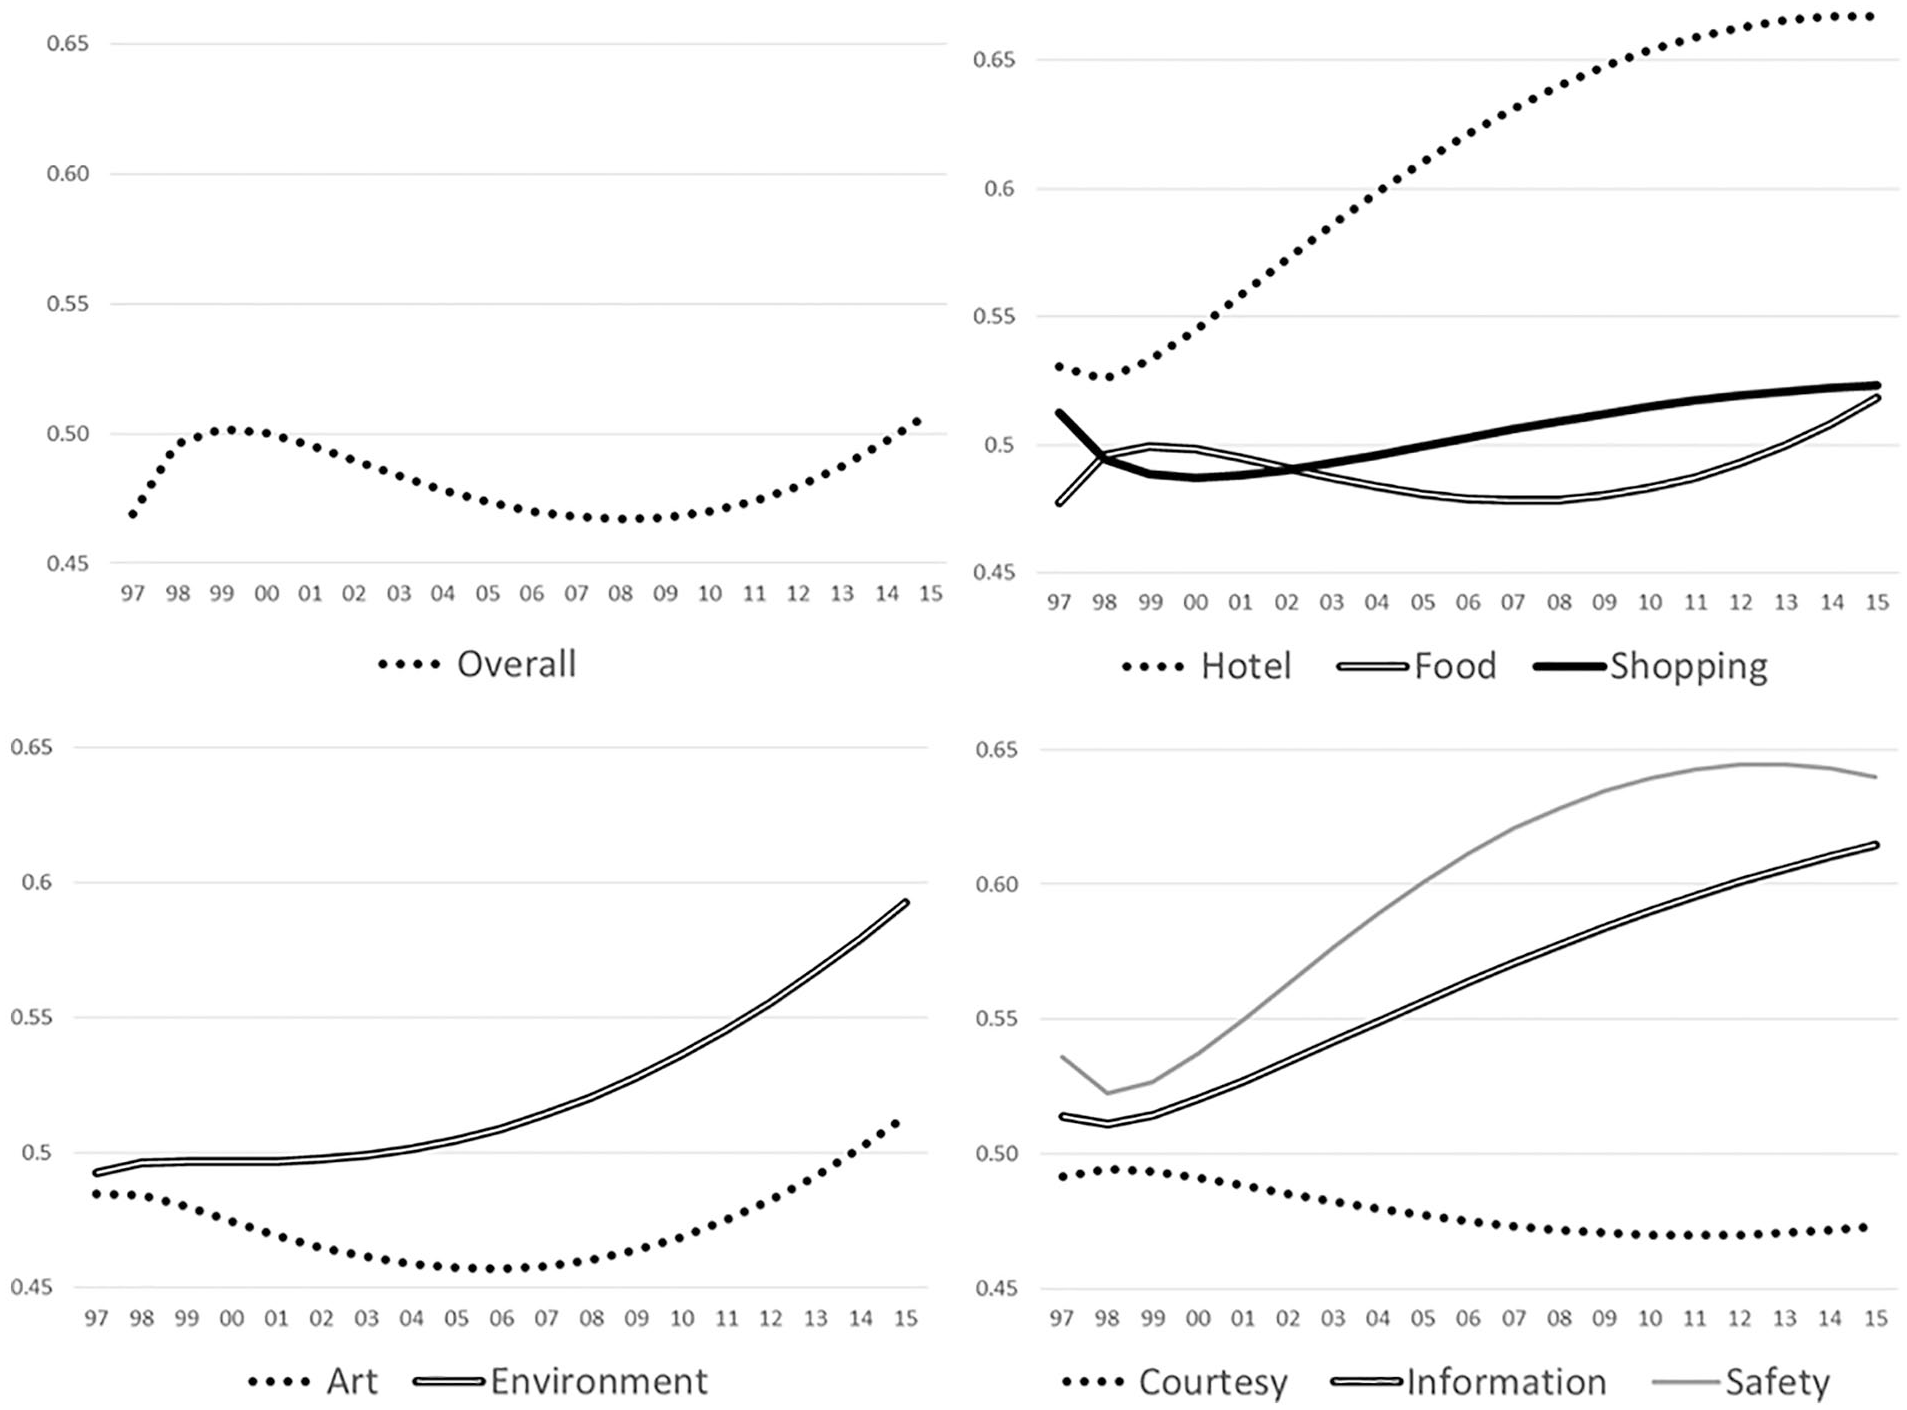
The trends G(t) in overall satisfaction and satisfaction with destination’s attributes.
Focusing on overall satisfaction (see Figure 2 in the upper left-hand-side quadrant), the trend indicates that after the introduction of the Euro currency (1999), the probability of observing higher overall satisfaction levels due to system-level changes decreased. The 2008 crisis represents a turning point whereby the trend modifies its direction and a positive evolution starts. A similar curvilinear convex dynamic with a minimum in the precrisis years (between 2004 and 2007) followed by an increase (with variable speed) is drawn by the system-level effect on satisfaction with Food, Shopping, Art and Environment, Hotels, and Safety represent interesting exceptions, as they grow steeply and almost linearly. Moreover, the probability of observing higher levels of satisfaction with hotels and safety is highly affected by the system-level dynamics (see the Y-axis absolute values) that are in turn significantly affected by long-term tourism destination policies aiming to improve the (objective) quality of the attribute. It is worth noting that both attributes are controllable (dynamic) trough policy actions like quality improvement or land control.
On the contrary, the system-level component for Art, Food, Shopping, and Courtesy give the smallest contribution to the tourists’ attributes of satisfaction. With the exception of Shopping, the aforementioned result is in line with expectations, as it relates to uncontrollable or at least semicontrollable attributes strongly connected with the broader intertwined economic, historical, social, or cultural factors over the period observed. Consequently, tourists’ emotional experiences or perceived image (the subjective components) are expected to play a more important role in determining the attributes’ satisfaction outcomes during the 19 years under analysis. That is, supply differentiation and variety—or the ability to segment the market—is expected to have stronger effects on these attributes’ satisfaction than an untargeted intervention aimed at increasing their (average) quality. Finally, we cannot report a clear distinction between the long-term dynamics of satisfaction with free and for-pay attributes. The result is expected as we consider the individual evaluation of price fairness among the independent variables.
Embedding the aforementioned results within the DDSM generates the matrix reported in Figure 3.
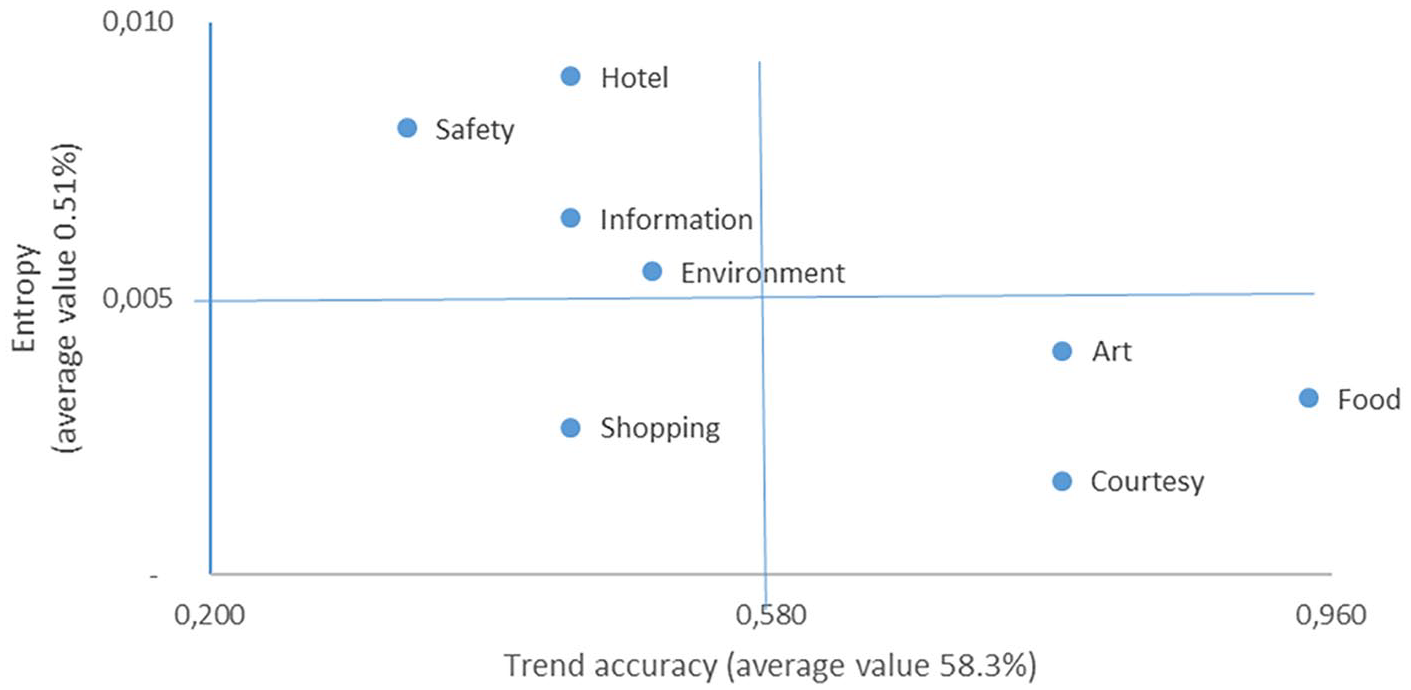
The DDSM matrix: entropy–trend accuracy of attributes’ contribution to overall satisfaction in the case study of Italy.
Apparently, no sectors/attributes regarding Italy as a tourist destination are positioned in the right-upper quadrant (controllable/semicontrollable items displaying a strong association with the system-level overall satisfaction dynamics).
The trends of satisfaction with Courtesy, Art, and above all, Food are those more related to the average-tourist’s overall satisfaction dynamic. Improving the satisfaction of these three attributes through policies affecting large target audiences (e.g., by increasing the average Food quality), is an effective strategy to improve the overall satisfaction trend component. Unfortunately, these attributes appear to be the most uncontrollable/static inputs, that is, the most difficult to manage or market to the “average” tourist. On the other hand, Hotels and Safety are the attributes that give the lowest systematic contribution to the dynamics of overall satisfaction. However, given the strong growth observed in their average evaluation over time (see Table 1), they appear as the most successfully managed although with a segmentation approach whose benefits are more clear at the individual level (e.g., in the satisfaction of a certain group of individuals).
Surprisingly, Shopping falls into the left-hand lower quadrant where we would expect to observe attributes more related to broader socioeconomic or cultural factors (i.e., hardly manageable), or unmanaged. The positioning into the DDSM also reveals that Shopping is the only attribute showing a direct relationship between its long-term suitability to be modified and the efficacy in modifying the average tourist’s overall satisfaction (being both low). On the contrary, the other attributes display an inverse relationship: the higher the entropy of the system-level component satisfaction with an attribute (i.e., the more it appears “managed/marketed” in the long term), the less it influences the trend component of overall satisfaction (and therefore the individual effect becomes important).
Discussion and Conclusions
The information brought about by means of tourist satisfaction surveys are commonly utilized for ex ante design and ex post evaluation of tourism policies in a variety of contexts aimed at improving the level of satisfaction of different segments of tourists (Araña et al. 2013). Similarly, satisfaction changes (or trends) could help identify the impact of strategic decisions regarding both government regulations (Kuentzel and Heberlein 2003) and investments in high-quality infrastructures (Song et al. 2012) as well as the consequences of an unexpected/unmanaged event.
Unfortunately, respondents’ heterogeneity generally prevents from considering a time series of unconditional average satisfaction statements expressed at different moments in time by different tourists as an unbiased proxy of the dynamic of satisfaction. In this article, we suggest a more general method to evaluate satisfaction dynamics from repeated cross-sectional samples drawn from the same context (e.g., the same country destination) at many different moments in time.
We assume that satisfaction statements consist of a subjective component, linked to individual tourists’ perceptions and personal experience (an individual effect), and a system-level component (i.e., a time-dependent effect). More specifically, we conceptualize this latter component as the benchmark against which tourists’ subjective experiences are measured conditionally to price effects. The model is operationalized augmenting a specification expressly conceived to assess the intensity and significance of causal relationships between bounded and ordinal scale variables (a CLM model) with a time-variant component taking the form of a “smooth” deterministic trend. In our conceptualization, the dynamic of this component proxies the dynamic of the “average tourist” satisfaction, allowing to monitor/evaluate the long-term effects of territorial policies and destination marketing actions more consistently vis-à-vis a direct comparison between mere static tourists’ evaluations.
We leverage on the increasing availability of public big data (i.e., open data) (Mariani, Baggio, Fuchs and Höpken, 2018; Mariani, 2019) on tourists’ perceptions and behaviors to observe tourists’ sectoral satisfaction with a destination within a temporal pattern. As such, this conceptual and methodological approach to tourist destination satisfaction is applicable to an increasing number of tourism destinations worldwide that regularly measure tourists’ evaluations and perceptions of their attributes (by means of repeated surveys).
Our approach is also holistic, because it considers the tourism area under analysis as a bundle of both tourism-related sectors and other relevant local attributes and assets that can be either controllable, semicontrollable, or uncontrollable.
We finally suggest to match the holistic and dynamic dimensions of satisfaction into a Dynamic Destination Satisfaction Matrix (DDSM) in order to provide destination marketers and managers with interesting insights. In particular we analyze jointly the satisfaction’s trends with the sectors/attributes under analysis (synthetized by an entropy index), and its association with the trends of the overall satisfaction.
To our knowledge, this is the first study in the tourism-related literature that provides a method to assess the dynamics of tourists’ satisfaction over a long time span. It bears important implications for destination management/marketing actions, especially those that imply a long-term commitment and aim at modifying either the quality attributes or even the demand composition, thus translating into targeting very different groups of tourists in terms of cultural backgrounds, perceptions, and personal experiences.
While our model and matrix are widely applicable, we need to emphasize that there are two relevant applicability conditions. First, it is necessary to gain access to repeated cross-sectional data. The more the “waves” of data collected through a repeated survey, the greater the dynamic power of the model. Second, it is appropriate to gain access to data related to multiple attributes of the destination: indeed, the more the attributes of a destination at hand, the more holistic would the modeling approach be.
Results of the Dynamic Model
The results of the empirical application of the new method, the Dynamic Destination Satisfaction Method, clearly indicate the existence of both significant individual-level and system-level effects over the 19 years considered and for all the considered sectors/attributes. Interestingly, satisfaction with Art appears to be the less affected by both effects. Considering the high level of satisfaction with Art (see Table 1), we can conclude that the quality and variety of nonreproducible assets in Italy is high enough to satisfy those market segments that are also less reactive to temporal dynamics (and prices). On the contrary, satisfaction with hotels, and satisfaction with nonservice attributes such as landscape and natural environment or the courtesy of local people, shows a greater responsiveness to destination marketing and management policies in both the short and medium-long term.
Consistently with extant literature, we find a positive (direct) effect of the overall perception of price fairness on the probability to be satisfied. As expected, the effect is higher for the overall satisfaction while it is not homogenous across destination sectors/attributes. In particular, the frequency of tourists connecting their overall perception of price fairness to their satisfaction with Shopping (and Information) is much higher than the frequency of tourists connecting their general price fairness evaluation to satisfaction with Art and Environment. As pointed out in previous literature (Wu, Wall, and Pearce 2014), shopping can be a major tourism pull factor as “the availability of cheap ‘knock-offs’ is a major attraction to many customers.”
The link between the perceived price fairness and the satisfaction with information has been overlooked so far in existing literature. Our findings seem to indicate that this nonservice item is taken for granted in many situations; that is, tourists have high expectations, except in cases where they perceive to spend very little. In case of nonreproducible assets like Art and Environment, the satisfaction’s “elasticity” to the perceived fairness of prices is much weaker, thus suggesting that there is room to embed Italy’s cultural and environmental unique natural and cultural heritage into novel products, services, and experiences.
As far as the analysis of trend dynamics is concerned, overall satisfaction shows a convex pattern with the 2008 crisis representing a turning point. The probability of observing higher overall satisfaction levels speeded up after 2011, when many Italian regions issued decrees and regulations paving the way for improvement of tourism areas. Satisfaction with Food displays a similar trend highlighting that the link between satisfaction with Food and overall satisfaction with the destination is strong and stable in time as it reflects Italian culture and lifestyle (Ab Karim and Chi 2010).
Environment and Art show a faster and anticipated recovery. The uptrend may have been triggered by the introduction, in 2004, of a new legislative decree, which allocated public contributions to works of preservation of cultural heritage, and a reformed authorization system for the protection of the landscape and urbanization (Italian Government 2004).
The structural dynamics of satisfaction with Hotels and Safety grow almost linearly, besides displaying the highest contribution of system-level dynamics to the probability of observing higher satisfaction levels. In relation to the hotels, the evidence suggests that the (private) hospitality sector improved accommodation infrastructure and services. The increased perception of safety is another aspect worth mentioning although it could result just from the experiential disconfirmation of inbound tourists’ negative expectations about the country (e.g., diffusion of organized crime syndicates).
Satisfaction with Courtesy gets the minimum system-level contribution, confirming an expected high relevance of subjective components in the satisfaction’s evaluation. However, Courtesy can be seen as the Achilles’ heel of the tourism destination, highlighting that perhaps foreign travelers expect Italy to be more tourist “friendly” than it actually is. The structural dynamic displays a very slow recovery in recent years, after showing negative dynamics in the years of economic expansion between 2003 and 2008. The apparent dissatisfaction with Courtesy should not be underestimated as a potential antecedent of tourist overall dissatisfaction. Italian tourism policy makers and destination marketers should address this issue by promoting educational and training initiatives, aimed at improving both residents’ and professionals’ attitudes toward foreign tourists. This is particularly important for the areas attracting the highest number of international tourists, where the demand for certain products and/or services (i.e., Food and restaurant or transportation) could exceed maximum capacity during peak times and seasons. This may lead destination marketers to focus on high-end and wealthy tourists and/or residents to contain tourism overdevelopment (Hunt and Stronza 2014).
The New Method and Matrix: The DDSME and the DDSM
Figure 3 representing the DDSM for Italy as a tourism destination shows that the long-term dynamic in the satisfaction with Courtesy, Art, and, above all, Food are strongly related to the trend in the overall satisfaction with Italy as a tourism destination. At the same time, based on the entropy, they are classified as the hardest attributes to manage (an expected result as they reflect Italian culture and lifestyle) but also possibly those for which marketing/management actions have resulted in a relatively lower long-term effect. Consequently, the high level of satisfaction with these items—recorded in the 19 years covered—seems to highlight a good performance of the activities carried out by Italian policy makers and destination managers in dealing with the subjective component of satisfaction (e.g., segmenting the market).
More generally, all the sectors/attributes (except for Shopping) show an inverse relationship between the entropy of their structural dynamics and the influence on the trend component of overall satisfaction. This implies that the more an attribute is controllable or semicontrollable (i.e., manageable/marketable), the more the subjective component becomes central.
Overall, we argue that there is room to leverage top-range tourism offers and bundles of products and services, which should target specific market segments (e.g., visitors seeking top-quality and exclusive experiences and/or visitors qualifying as High Net Worth Individuals from countries such as China), also considering that art and environment (namely, the cultural and natural heritage) are nonreproducible assets, on which the international competition is less intense. Additionally, we show that attributes like Art (and Environment) are almost “inelastic” to overall price fairness evaluation. Thus, top-quality experiences could also engage and fully satisfy the mass of low- to medium-income and price-sensitive tourists. The latter phenomenon calls for a stronger price diversification in other sectors (i.e., Shopping and Hotels) where satisfaction is highly influenced by the evaluation of prices fairness. However, the DDSM analysis shows an important difference between these two attributes (i.e., Shopping and Hotels). The low entropy in the systemic component of satisfaction with Shopping suggests that Italy allows consumers to engage with a wide range of experiences and goods (e.g., Italy is well renowned for fashion). On the contrary, the high satisfaction entropy of the Hotels attribute shows that in the 19 years under analysis, relevant tourist satisfaction improvements have been obtained through policies and management decisions affecting large target audiences (e.g., increasing accommodation structures’ average quality).
Implications for Tourism Policy Makers and Destination Marketers
The key findings discussed in the previous two subsections allow us to put forward several practical implications for tourism policy makers and destination marketers. First, both tourism policy makers and destination marketers should carefully monitor the dynamic of tourists’ satisfaction with attributes. In fact, attributes specifically tied to broader cultural and historical factors (e.g., Art, Food, and Courtesy) are strongly linked to the long-term component of overall satisfaction with the destination. Second and related to the previous point, destination managers and policy makers should enhance and augment tourism products and the overall quality (given the “steady” trend in the average tourist’s satisfaction) in relation to Art, Food, and Courtesy and should also engage in differentiation strategies aimed at enhancing the visibility of the least-known destinations. Third, the long-term satisfaction with Food and Courtesy could benefit from a more effective control of tourism flows, also through de-marketing strategies, better security, and better interaction with residents not used to high volumes of tourists. Fourth, as far as Art is concerned, tourism policy makers should put in place policies to enhance the least known artistic and environmental attractions that have the potential to affect positively the structural satisfaction with the artistic and cultural endowment. More specifically, policy makers should better exploit the vast numbers of highly valuable assets that are not appropriately promoted internationally (Presidenza del Consiglio dei Ministri 2013) beyond renowned World Heritage Sites (Mariani and Guizzardi 2020) and work with local DMOs and destination marketers to improve promotional activities. Fifth, in light of the increasing environmental awareness, tourism policy makers and destination marketers should increasingly invest in protection and preservation projects (Capacci, Scorcu, and Vici 2015) bringing together environment and art (Mariani and Zan, 2011) to foster long-term tourism development. This would imply also undertaking initiatives to innovate in products and services that should be environmentally sustainable and combine them with the extant rich artistic heritage.
Limitations and Research Agenda
This study displays a few limitations. First, our data set does not include all the determinants of satisfaction, which previous researchers have found to influence satisfaction (Simpson, Cruz-Milán, and Gressel 2014; Yang 2016). Second, the transformation in qualitative variables (MCA factors) of some discrete characters (e.g., trip purpose) could have an influence on the result. Last, even if the time consistency of satisfaction measurement and the survey validity are guaranteed by the fact that data come from an official source, the survey is primarily designed to compute the national balance of trade. Different avenues for future research can be identified. We focused on an entire country, but further research should be targeting smaller areas also, especially those that could benefit from developing the tourism sector as a driver of economic growth. Future studies could extend the analysis to other countries and draw comparisons about the impact of their assets on tourism satisfaction in a longitudinal way. Another interesting development of this work might consist of analyzing the country of origin of the visitors, as extant studies (e.g., Mariani, Di Fatta and Di Felice, 2019; Thrane and Farstad 2012) underlined the importance of this segmentation variable. As part of a wider multiyear research agenda, we would like to encourage future researchers to analyze how the novel proposed methodological approach can be employed consistently within established models of destination competitiveness. Accordingly, the DDSME might be combined effectively with extant established frameworks of destination competitiveness looking at one or more of the dimensions of destination competitiveness such as the economic (e.g., Dwyer, Forsyth, and Rao 2000; Crouch and Ritchie 2012), satisfaction (e.g., Dwyer and Kim 2003; Enright and Newton 2004; Ritchie and Crouch 2003), and sustainability (e.g., Crouch and Ritchie 1999; Mihalič 2000) dimensions of destination competitiveness. More specifically, we believe that further research might enrich frameworks focusing on the satisfaction dimension of tourism destination competitiveness (Dwyer and Kim 2003; Enright and Newton 2004; Ritchie and Crouch 2003), by juxtaposing to the established set of static measures, metrics and indicators, novel dynamic measures, those metrics and indicators that are based on the dynamic nature of the new method proposed in this work. Moreover, based on the DDSME, there is room also to conceptually elaborate and empirically validate a classification or taxonomy of destination (satisfaction) competitiveness indicators that pertain to the individual versus system level: accordingly, extant models of destination competitiveness might differentiate the key success factors of destination (satisfaction) competitiveness (e.g., Dwyer and Kim 2003) based on the newly introduced entropy-index. Furthermore, the novel matrix “entropy/trend accuracy” introduced in this work might shed new light on how to extend static indicators featured in the classical models of destination competitiveness focused on satisfaction (e.g., Dwyer and Kim 2003; Enright and Newton 2004; Ritchie and Crouch 2003) into a dynamic domain, thus providing powerful insights to destination management scholars and practitioners interested in the factors enhancing both the individual-level component and the system-level component of tourism destination satisfaction.
Footnotes
Acknowledgements
We wish to thank sincerely the three anonymous reviewers for their valuable and precious comments and suggestions on earlier versions of the manuscript and the Editor-in-Chief Prof. Crouch for his continued support during the entire revision process.
Declaration of Conflicting Interests
The author(s) declared no potential conflicts of interest with respect to the research, authorship, and/or publication of this article.
Funding
The author(s) received no financial support for the research, authorship, and/or publication of this article.