
Abstract
Cholera remains a significant public health concern in Ethiopia, where recurrent epidemics have been reported for centuries. Despite the launch of the National Cholera Elimination Plan (NCP) aiming to eliminate cholera by 2028, the disease continues to cause substantial morbidity and mortality. This study assessed the national and subnational burden of cholera in Ethiopia from 2019 to 2023 using the Global Burden of Diseases (GBD 2023) estimates. A secondary analysis of GBD 2023 data was conducted to describe temporal trends in cholera mortality, years of life lost (YLLs), years lived with disability (YLDs), and disability-adjusted life years (DALYs) in Ethiopia between 2019 and 2023. The Cause of Death Ensemble model (CODEm) was used to estimate cause-specific mortality, and DisMod-MR 2.1 was used to model non-fatal outcomes. SPSS version 27 was used for the analyses. Nationally, cholera-related deaths decreased from 1.42 (UI: 0.40-3.70) to 1.10 (UI: 0.26-3.22). Total YLLs decreased from 116 593 (UI: 34 140-295 170) to 87 513 (UI: 20 036-244 597), while YLDs declined modestly from 192 (UI: 118-298) to 160 (UI: 97-250). YLLs consistently accounted for more than 99% of total DALYs. Mortality was higher among adults aged ≥50 years, whereas deaths among children under 5 declined. The national Case Fatality Rate (CFR) reached 3.13% in 2022, exceeding the World Health Organization (WHO) threshold of 1%. Subnational analysis of the Amhara region revealed that while deaths and YLLs declined, a 26.7% increase in YLDs led to a net 5.9% rise in DALYs. Cholera remains endemic in Ethiopia, with a gradually decreasing burden over the last 5 years. To achieve the 2028 elimination goal, Ethiopia must strengthen multi-sectoral coordination, scale up sustainable Water, Sanitation, and Hygiene (WaSH) interventions, expand oral cholera vaccine coverage, and reinforce surveillance and health system response capacities.
Introduction
Vibrio cholerae is the bacterium that causes cholera, an acute secretory diarrheal illness. 1 Although half of all cholera deaths occur in children under 5, it can kill an adult within hours if treatment is not received. 2 Inadequate access to facilities for safe water, sanitation, and hygiene (WaSH) is the main cause of it. 3 Even though cholera may be prevented and treated, it nonetheless causes a high rate of morbidity and mortality in areas without these essential services. The World Health Organization (WHO) reported nearly 610 000 cases and 3500 fatalities from cholera in 2023 alone, highlighting the disease’s recent global return and its capacity to trigger widespread outbreaks and crises. 4
Cholera is endemic in Ethiopia and has been a persistent public health concern for many years. 5 Limited access to sanitary facilities, hygiene facilities, and safe drinking water are major contributors to the spread of cholera. 6 The 2020 national WaSH estimates indicate that 49.6% of Ethiopians have access to at least basic sources of drinking water, with notable differences between rural (40.0%) and urban (84.2%) populations. Additionally, 8.2% of people have access to basic handwashing facilities, and 8.9% of people have access to at least basic sanitation. Ethiopian cholera drivers are primarily linked to poor WaSH interventions, exacerbated by climate change (droughts, floods), conflict, malnutrition, and rapid population movement, forcing reliance on unsafe water sources, leading to widespread transmission of Vibrio cholerae. 7
Ethiopia is experiencing a cholera outbreak, with a cumulative of 25 044 cases and 327 deaths in 2022. In 2023, the country experienced one of the largest yearly caseloads in recent years, with almost 30 000 cases reported, suggesting that the threat is growing rather than decreasing. 8 This resurgence is Worsened by a consistently high national Case Fatality Rate (CFR) which in 2022 covered at 3.13%, well over the WHO’s recommended threshold of less than 1% for effective cholera control. 9 The disease can spread from aquatic habitats, like water systems, which can get contaminated during periods of severe rainfall and flooding, which is frequently the source of cholera outbreaks. 10
Approximately 70 million people in Ethiopia are currently at risk of contracting cholera, with an estimated 275 221 cases and 10 458 fatalities (CFR = 0.94%) per year. The country’s most affected areas are Addis Ababa, Afar, Tigray, Oromia, Amhara, and Sidama. A total of 24 903 cases and 234 deaths were reported nationwide between August 26, 2022, and September 22, 2024, yielding a case fatality rate of 0.94%. 11 Additionally, certain clinical and demographic characteristics, such as patients with severe dehydration, older adults (≥45 years), and those who were initially treated as outpatients, have been linked to a markedly increased risk of death, exposing yet another level of vulnerability in the population. 12
Even though outbreak reports and routine surveillance offer vital real-time data, they frequently fall short of capturing the complete, comparative burden of disease, particularly in environments with disjointed health information systems. By using standardized and rigorous approaches to estimate the incidence, mortality, and disability-adjusted life years (DALYs) for illnesses like cholera across all geographies and over time, the Global Burden of diseases, Injuries, and Risk Factors Study (GBD) fill this knowledge vacuum.13,14 A systematic and comparable assessment of disease burden at the national and subnational levels is made possible by the GBD framework, which uses models such as the Cause of Death Ensemble model (CODEm) to synthesize a wide range of data sources. 15 However, there isn’t a thorough examination of Ethiopia’s cholera burden and the most cholera-affected region, Amhara, from 2019 to 2023 using the most recent GBD 2023 data. Despite the high incidence of cholera in the Amhara region, there is a lack of data to accurately describe its burden. Additionally, the Amhara region has been in internal armed conflicts, and there are many internally displaced persons who are at high risk of cholera. This study therefore, aimed to fill this critical knowledge gap by utilizing the findings from the Global Burden of Disease Study 2023 to quantify the national and subnational burden of cholera in Ethiopia between 2019 and 2023.
Methodology
Study Area
The study was conducted using the GBD data of Ethiopia and Amhara region. Ethiopia is located in the Eastern part of Africa and is a Federal Democratic Republic country administratively divided into 10 regional states and 2 city administrations. Amhara National Regional State (ANRS) and the second most populous region in the country, with a total population of about 22.5 million in 2020. The region is divided into 13 zones, namely Bahir Dar special zone, Awi, East Gojjam, West Gojjam, South Gondar, Central Gondar, West Gondar, North Gondar, South Wollo, North Wollo, North Shoa, Oromia and Waghemira zones. The capital city of ANRS is Bahir Dar which is located 564 kms away from northwest of Addis Ababa (capital city of Ethiopia).
This study used the data from the 2023 Global Burden of Diseases, Injuries, and Risk Factors Study (GBD). Both the overarching capstone articles and previous publications have provided a detailed description of the overall methodology for GBD 2023. 16 The following section describes the specific components and modifications utilized to calculate Ethiopia’s national and subnational cholera burden from 2019 to 2023 are described in the section that follows (Figure 1).
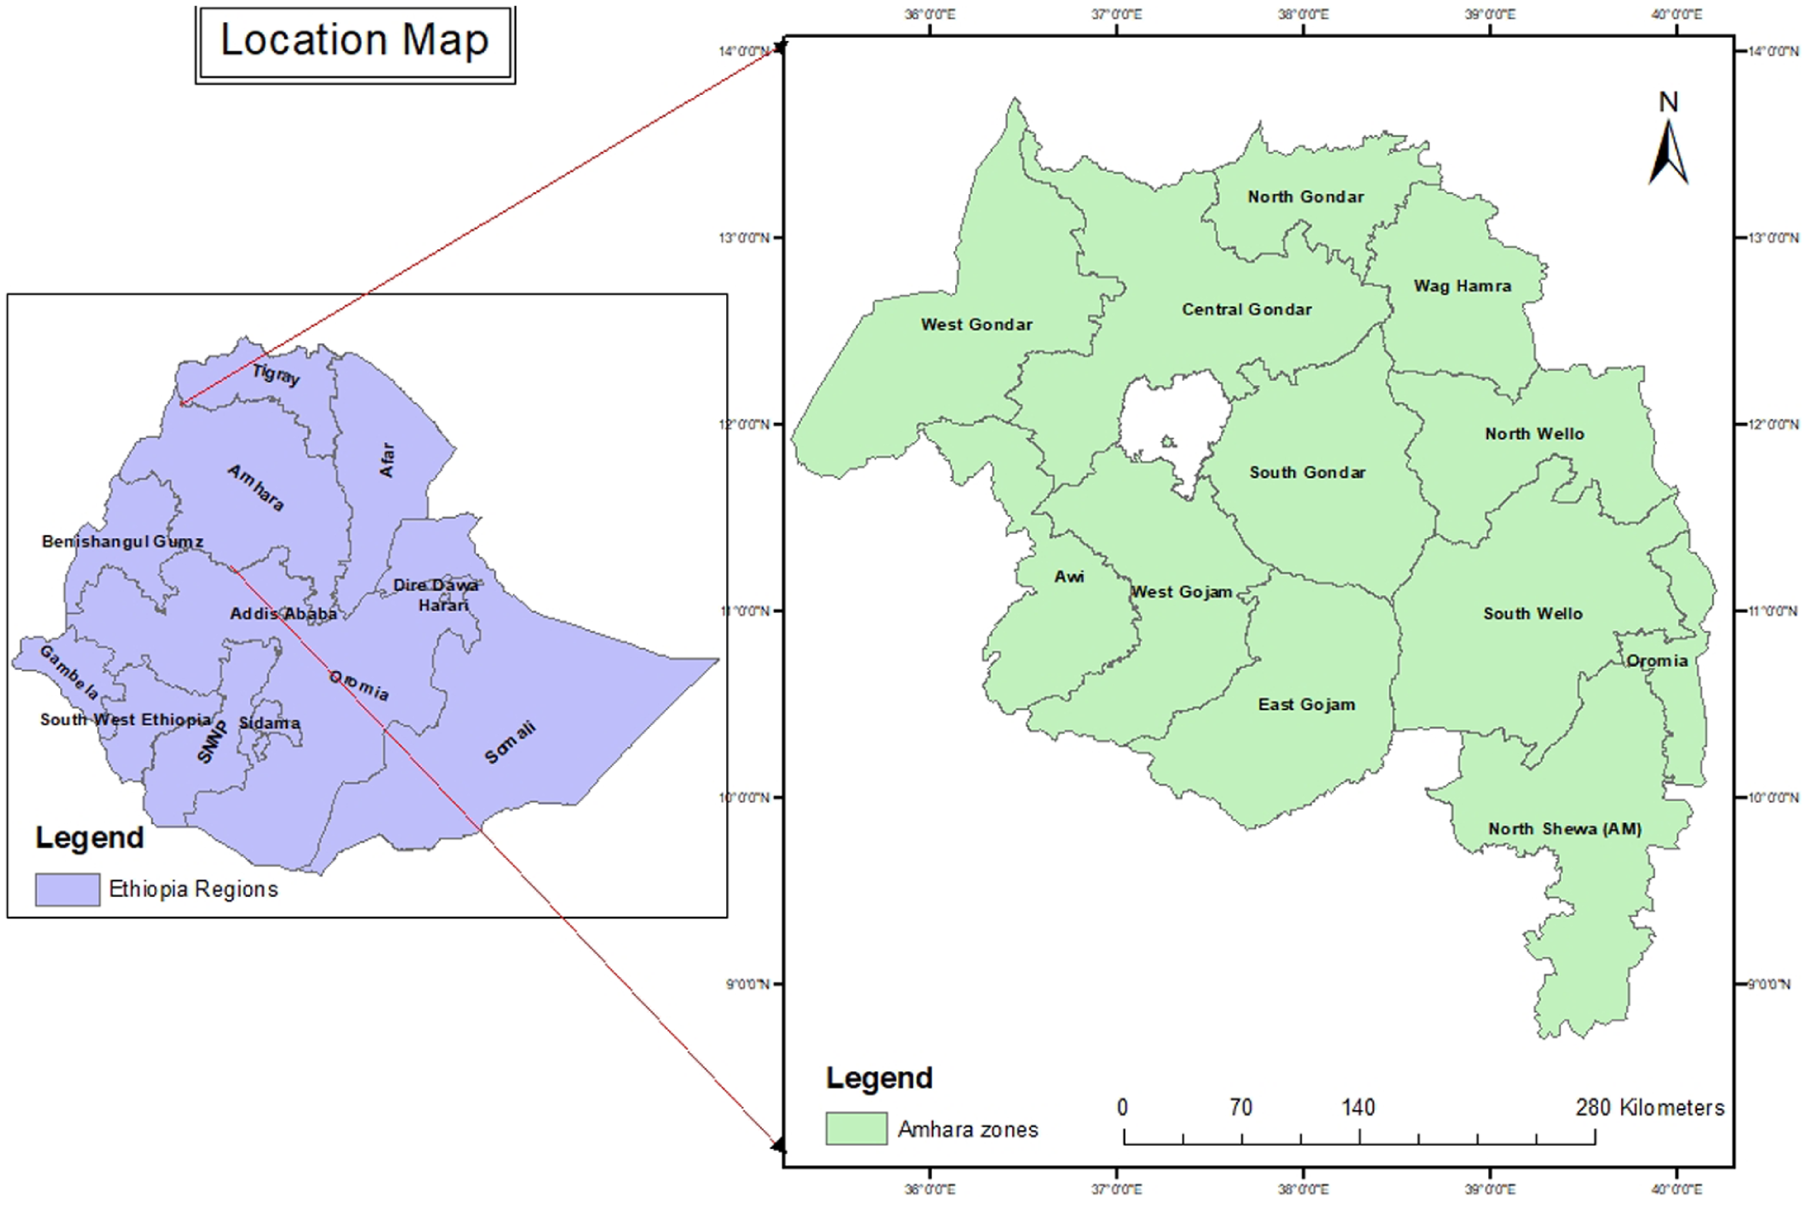
Map of Amhara regional state, Ethiopia.
Study Design and Overview
We conducted a systematic investigation of Ethiopia’s cholera-related deaths, mortality rates, Years Lived with Disability (YLDs), Years of Life Lost (YLLs) and Disability-Adjusted Life Years (DALYs). In order to generate comparable and internally consistent estimates of disease burden, the study used the established Global Burden of disease (GBD) protocol. 16 All available data sources were identified, evaluated critically, and synthesized as part of the core analytical steps. The Cause of Death Ensemble model (CODEm) was used by GBD to model cause-specific mortality. 17 DisMod-MR 2.1 was used to model non-fatal outcomes. 18 and the GBD hierarchical cause list and covariate selection framework. 19 was used to ensure internal consistency across estimates.
Inclusion and Exclusion Criteria
Data were included in the analysis if they met the following criteria: data specific to Ethiopia at national and subnational estimates corresponding to Amhara National Regional State, estimates covering the period 2019 to 2023, all age groups, and both sexes. Estimates prior to 2019 or after 2023 not aligned with GBD 2023 outputs were excluded from the study.
Geographical and Temporal Scope
National Level: The analysis provides estimates for the Federal Democratic Republic of Ethiopia as a whole. Subnational Level: Estimates were generated for the Amhara regional states. Temporal Frame: The primary period of analysis for this paper is 2019 to 2023. The models, however, leverage data from 1990 onward to ensure robust trend estimation and to enhance the predictive validity of the 2019 to 2023 estimates. At the national level, the analysis provides estimates for the entire Federal Democratic Republic of Ethiopia. Subnational Level: Amhara regional state estimates were generated. Temporal Frame: This study primarily analyzes the years 2019 to 2023. However, the models use data from 1990 onward to improve the predictive validity of the 2019 to 2023 estimates and guarantee reliable trend estimation.
Data Sources and Identification
A comprehensive and systematic search was conducted in search of all of the information on cholera in Ethiopia that was available in GDB 2023 outputs (Data of the GBD study. available at: https://www.healthdata.org/results/data-visualizations.
The study’s data can be accessed on the Global Health Data Exchange GBD Results Tool (http://ghdx.healthdata.org/gbd-results-tool). For 369 diseases and injuries, GBD 2019 estimated deaths, mortality rates, years lived with disability (YLDs), years of life lost (YLLs), and DALYs for both males and females, age categories, and 204 nations and territories that were physically divided into 21 regions starting in 1990. Metrics were presented as numbers, percentages, and ratios; they can be selected based on the study’s requirements by sex, age, and location. Data on cholera in all age groups and sexes was taken from 204 nations and 21 GBD regions between 1990 and 2019. The Bayesian meta-regression tool DisMod-MR 2.1 was the main technique used in the GBD 2019 study to guarantee that the deaths, mortality rates, YLDs, YLLs and DALYs were consistent.
Population and Demographic Data
The GBD 2023 population database, which compiles information from censuses, demographic surveillance sites, and the World Population Prospects, provided the population estimates for Ethiopia and its subnational regions, including age and sex distributions. The Cause of Death Ensemble model (CODEm), an efficient algorithmic tool that evaluates a large number of credible statistical models and chooses the top-performing combination based on out-of-sample predictive validity, was used to predict cholera mortality.
Analytic Strategy
This study was a systematic and descriptive trend analysis of the deaths, mortality rate, adjusted life years, years of life lost and years lived with disability of cholera were assessed by age, sex, and location. the deaths of cholera were assessed by age, sex, and location. pre-existing estimates of the GBD Study 2023 framework which provides comprehensive estimates of Ethiopia’s national and regional cholera disease burden. Using multi-year GBD data, burden of cholera and changes in Ethiopia’s cholera burden and prevalence over the course of the study was analyzed. Mortality rates and deaths were among the analysis indices. From 2019 to 2023, the current cholera load as well as subnational and temporal trends was analyzed. Metrics were presented as numbers, percentages, and ratios. The overall change between years was also expressed as a percentage change. The software SPSS v27 was used for all analyses. The study followed the recommendations of the STROBE guideline. 34
Estimation of Cholera Burden by GBD
The GBD data analysis used piecewise regression analysis, as recommended by Boyle and Parkin. 20 to characterize and evaluate the statistical significance of trends across time for the outcomes of interest based on visual analysis of the time trends. Time was divided into intervals for this study, and a separate regression line was fitted to each interval. The overall change between years was also expressed as a percentage change. The software SPSS v27 was used for all analyses.
Ethical Considerations
The study was exempt from institutional review board approval since it used aggregated, anonymized data from databases and publicly accessible sources. Every original source of data used in the GBD study complies with regional ethical standards.
Results
National Cholera Burden and Temporal Trends in Ethiopia, 2019-2023
The overall cholera burden in Ethiopia decreased gradually but steadily between 2019 and 2023. The results are based on estimates from the GBD 2023 framework, which creates internally consistent national and subnational estimates by integrating several data sources using strong Bayesian modeling techniques.
Deaths and Mortality
In 2023, there were 1286.6 (UI: 296.2-3651.3) cholera-attributable deaths, a decrease of roughly 21% from 1628.4 (UI: 469.3-4187.5) in 2019. From 1.42 (UI: 0.40-3.70) deaths in 2019 to 1.10 (UI: 0.26-3.22) in 2023, the mortality rate decreased marginally.
Sex-Specific Burden
Male deaths were greater than female deaths during the study period, accounting for up about 55% of all cholera deaths. Male mortality in 2019 was 890.9 (UI: 237.4-2329.9), while female mortality was 737.5 (UI: 231.9-1857.6). Male mortality dropped to 699.5 (UI: 152.9-1952.4) and female mortality dropped to 587.1 (UI: 143.3-1698.9) by 2023.
Age-Specific Distribution
The cholera burden was highest among those under 5. Between 2019 and 2023, the number of deaths among children under 5 years old decreased by 40%, from 577.5 (UI: 193.4-1302.2) in 2019 to 346.8 (UI: 84.2-869.6) in 2023. Children between the ages of 5 and 14 also demonstrated a consistent decrease, going from 421.2 (UI: 110.3-1165.1) in 2019 to 336.0 (UI: 72.4-968.0) in 2023.
Adults between the ages of 15 and 24 showed a consistent decline, going from 159.2 (UI: 39.5-447.1) in 2019 to 139.0 (UI: 30.3-429.4) in 2023. Between 2020 and 2023, there were moderate decreases in the 25 to 49 age group (from 286.6 to 282.6), and fluctuations in the ≥50 years category, which ended with a slight increase from 161.1 to 182.2 deaths per 100 000 population.
Years of Life Lost (YLLs) and Years Lived With Disability (YLDs)
The YLLs, decreased significantly from 116 593 (UI: 34 140-295 170) in 2019 to 87 513 (UI: 20 036-244 597) in 2023. Nonetheless, YLLs continue to account for more than 99 percent of all DALYs. The non-fatal health loss from symptomatic infection, measured by the YLDs, decreased from 192 (UI: 118-298) in 2019 to 160 (UI: 97-250) in 2023, indicating little change.
Disability-Adjusted Life Years (DALYs)
The total DALYs attributable to cholera decreased from 116 785 (UI: 34 309-295 360) in 2019 to 87 673 (UI: 20 174-244 769) in 2023 a reduction of approximately 25% over 5 years. The details are presented in Table 1 and appendix 1.
National Cholera Burden and Temporal Trends in Ethiopia, 2019 to 2023.

Burden of Cholera in Amhara Region, 2019-2023
Between 2019 and 2023, the regional burden of cholera in Amhara showed a gradual decline in mortality and in disability-adjusted life years (DALYs),
Deaths and Mortality Rate in Amhara Region
The total number of deaths attributable to cholera decreased marginally from 286 deaths (UI: 75-791) in 2019 to 229 deaths (UI: 48-690) in 2023. The mortality rate per 100 000 population remained relatively stable, decreasing slightly from 20.6 (UI: 5.17-56.8) in 2019 to 20.45 (UI: 5.13-56.53) in 2023.
Sex-Specific Trends in Amhara Region
Cholera mortality remained almost equal across sexes, with males accounting for a slightly higher proportion throughout the period. Mortality reduction was observed in both sexes. Male deaths decreased from 161(UI:459-37) in 2019 to 128(UI:39 3-25in 2023, whereas female deaths decreased from 126(UI:332-37) to 101(UI:297-23).
Age-Specific Mortality in Amhara Region
Among children under 5 years, deaths declined steadily from 81 (UI: 27-189) in 2019 to 45 (UI: 11-116) in 2023, representing the most pronounced reduction across all age groups. Similarly, deaths among children aged 5 to 14 years showed a gradual decrease from 70 (UI: 17-213) in 2019 to 53 (UI: 11-165) in 2023. In the 15 to 24 years age group, deaths decreased slightly from 28 (UI: 6-83) in 2019 to 24 (UI: 4-74) in 2023 and remained relatively stable from 2021 onward.
Among adults aged 25 to 49 years, deaths declined from 58 (UI: 12-173) in 2019 to 48 (UI: 10-151) in 2021, followed by an increase to 55 (UI: 11-173) in 2022 and 58 (UI: 11-189) in 2023, returning to levels similar to those observed at the beginning of the study period. Deaths among individuals aged 50 years and above decreased from 49 (UI: 13-134) in 2019 to 40 (UI: 10-122) in 2021, then increased to 45 (UI: 1-135) in 2022 and 49 (UI: 10-146) in 2023.
Years Lived With Disability (YLDs) and Years of Life Lost (YLLs) in Amhara Region
The Years Lived with Disability (YLDs) decreased steadily from 33(UI:51-20) in 2019 to 27(UI:42-16) in 2023. Likewise, the Years of Life Lost (YLLs) due to premature mortality declined significantly from 19 172 (UI:52 408-5089) in 2019 to 14 266 (UI:42 533-3000) in 2023.
Disability-Adjusted Life Years (DALYs) in Amhara Region
The total Disability-Adjusted Life Years (DALYs) attributable to cholera decreased from 19 204(UI:52 459-5109) in 2019 to 14 293(UI:42 575-3015) in 2023. The details are presented in Table 2 and appendix 2.
Burden of Cholera in Amhara by Year, 2019 to 2023.

Discussion
Cholera remains a significant public health threat in Ethiopia, a country that has experienced recurrent epidemics for decades, with the first recorded outbreak dating back to 1634. 21 The disease spreads in places with poor access to safe water, sanitation, and hygiene (WaSH), making it a powerful symbol of inequality. 22 Even though a Multisectoral Cholera Elimination Plan (NCP) was created with the goal of eliminating the disease by 2028, Ethiopia still experiences large outbreaks, with a persistent and changing cholera burden from 2019 to 2023. 23
In this study, deaths decreased from 1.42 (UI: 0.40-3.70) in 2019 to 1.10 (UI: 0.26-3.22) in 2023, while YLLs decreased significantly from 116 593 (UI: 34 140-295 170) in 2019 to 87 513 (UI: 20 036-244 597) in 2023. Nonetheless, YLLs continue to account for more than 99 percent of all DALYs. The non-fatal health loss from symptomatic infection, measured by the YLDs, decreased from 192 (UI: 118-298) in 2019 to 160 (UI: 97-250) in 2023. These patterns align with independent data indicating multiple epidemic waves and a general resurgence of cholera in Ethiopia throughout the same period. Numerous recent studies and national reports corroborate the existence of ongoing endemic transmission, along with sporadic large outbreaks that have contributed to the rising burden at the population level. 24
The GBD-modeled estimates of total cholera mortality and DALYs are higher than these routine surveillance counts According to recent Ethiopian Public Health Institute/Ministry of Health summaries and Ethiopia’s national cholera plans, there were multiple epidemic waves during the 2015 to 2023 period, with approximately 100 000 cases reported and over 1000 fatalities. 25 A difference likely explained by under-reporting of cases and deaths in facility surveillance, differences, in case definitions and attribution methods. The true burden is likely underestimated due to challenges in surveillance, laboratory capacity, and the fact that cases are often reported as Acute Watery Diarrhea (AWD). 26 A comprehensive retrospective analysis revealed that from January 2001 to November 2023, there was a total of 215 205 cholera/AWD cases, 2355 deaths with a cumulative CFR of 1.10% (95% confidence interval [CI], 1.092-1.095), and a mean annual incidence rate of 8.9/100 000 (95% CI, 6.5-11.3). 21
According to spatiotemporal studies, Ethiopian cholera outbreaks happen in dynamic waves. Four separate epidemic waves were found in studies conducted between 2015 and 2021, with a general trend of a shift from north to south over time. Multiple, smaller-scale outbreaks were reported throughout the country during the user’s period of interest (2019-2021, referred to as the “third wave”). These outbreaks occurred in the northern Amhara region, Oromia, Afar, and Addis Ababa. Later, the epidemic spread into the Southern Nations, Nationalities, and Peoples’ (SNNPs) Region and along the borders with South Sudan and Kenya. 6
Our GBD disaggregation revealed in a ≥ 50 years category, which ended with a slight increase from 161.1 to 182.2 deaths. This pattern can occur when comorbidities, delayed care, or poor access increase mortality in older adults, while vaccine campaigns and targeted child health or WaSH interventions decrease severe disease in young children. Targeted use of the oral cholera vaccine (OCV) during reactive campaigns starting in 2019 can lower incidence in priority districts and age groups, but population-level protection remained uneven. The near-equal male and female mortality observed in the 2023 GBD estimates suggests broadly comparable exposure patterns and access to care between sexes at the national level. 27 Even though when raw surveillance counts only slightly change from year to year, the YLL/DALY decomposition can be changed by enhancements in GBD cause-of-death modeling or the addition of new data sources. Interpreting trends should therefore place more emphasis on direction and believable drivers than on exact point estimates, as the large uncertainty intervals in GBD.
In this study, the mortality rate per 100 000 population remained relatively stable, decreasing slightly from 20.6 (UI: 5.17-56.8) in 2019 to 20.45 (UI: 5.13-56.53) in 2023. In 2022, the national CFR alarmingly surpassed the WHO’s acceptable threshold of less than 1%, reaching 3.13%, the highest recorded in the 2024 analysis. The vulnerabilities in the health system’s response capabilities are emphasized by this high CFR. Moreover, regional differences reveal underlying inequities, with the Benishangul Gumuz region reporting a cumulative CFR of 6.07% from 2015 to 2023, while other regions, such as Amhara, reported 1.09%. 28
Recent literature and national documents consistently emphasize several interrelated factors: water, sanitation, and hygiene (WaSH) failures; climate extremes (drought and flooding cycles) that change water quality and mobility; internal displacement and refugee settings (eg, documented outbreaks in refugee camps in 2023). These were due to crowded conditions and limited WaSH amplify transmission; and conflict-related disruptions to the health system that decrease prevention and prompt case management.24,29 According to laboratory investigations, the Ogawa serotype of Vibrio cholerae O1 is the main cause behind outbreaks in Ethiopia. In 2022 to 2023, the O1 serogroup accounted for 90.4% of isolates, while the Ogawa serotype accounted for 86.4%. 10 Global studies also show a more widespread increase in cholera in a number of nations with comparable causes after 2021. The geographic and temporal trends observed in Ethiopia from 2019 to 2023 are in good agreement with these contextual factors. 4
In this study, Amhara region showed a small decline in cholera deaths, YLLs and YLDs and overall DALYs. Deaths attributable to cholera decreased marginally from 286 deaths (UI: 75-791) in 2019 to 229 deaths (UI: 48-690) in 2023.The Years Lived with Disability (YLDs) decreased steadily from 33 (UI:51-20) in 2019 to 27 (UI:42-16) in 2023. Likewise, the Years of Life Lost (YLLs) due to premature mortality declined significantly from 19,172 (UI:52 408-5089) in 2019 to 14 266 (UI:42 533-3000 in 2023. A study conducted in Ethiopia found that while non-fatal cases (and thus YLDs) can increase when surveillance or access to care improves, or when more people survive severe disease but have long-lasting disability or health consequences (eg, malnutrition, dehydration sequelae), mortality decreases as case management, rapid detection, and vaccine use reduce deaths. 21
Significant instability in the Amhara region during the reviewed period, especially from 2021 onward, directly worsened the cholera situation. These systemic failures must be taken into consideration when interpreting the data. In August 2023, a cholera outbreak in Amhara’s Kumer Refugee Camp provided a clear illustration of risk factors cholera outbreak when a humanitarian response fails. With only 1 latrine for 200 people (compared to a standard of 1 per 20) and a water supply of only 10 l per person per day (compared to a minimum of 15 l), the camp conditions were significantly below Sphere minimum standards. These circumstances create an ideal condition for the rapid spread of cholera. 30
Particular cultural practices have been recognized as distinct risk factors, in addition to the typical WaSH-related drivers. Holy water from sites such as the Bermel Giorgis well in the Quara district has been directly linked to infections, according to recent reports. Beginning on July 15, 2023, a cholera outbreak in Amhara’s West Gondar Zone affected 60 woredas (districts) in 16 zones. There were 90 fatalities and 4983 reported cases as of August 29, 2023, yielding a CFR of 1.81%. 31 According to a study conducted in Ethiopia, public health initiatives that are considerate of regional cultural and religious practices are required to lessen the cholera burden. 32 Global efforts to reduce the incidence and mortality of cholera can be greatly supported by the application of the “One Health” framework and the alignment of public health strategies with economic and policy insights. 33
Limitations of the Study
Despite providing a comprehensive overview of cholera burden in Ethiopia from 2019 to 2023, this study has some important limitations that should be considered when interpreting the findings. First, the study relied primarily on GBD-modeled estimates, which synthesize data from multiple sources, including vital registration, surveillance, and literature. While these models adjust for underreporting and misclassification, they may still differ from routine national surveillance counts, as evidenced by higher estimates of deaths and DALYs compared to reported cholera/AWD cases. On the other hand, in Ethiopia, cholera surveillance is affected by under-reporting, incomplete case ascertainment, and limited laboratory confirmation, as many cases are recorded as acute watery diarrhea (AWD). Consequently, the true burden of cholera may be either underestimated or misclassified. Second, temporal trends may be influenced by changes in GBD modeling methods, inclusion of new data sources, or revisions in cause-of-death attribution over time. Finally, subnational and regional analyses, particularly for conflict-affected and humanitarian settings, may mask within-region heterogeneity, as outbreaks are often highly localized. Despite these limitations, the study provides a comprehensive overview of cholera burden and trends in Ethiopia and highlights critical areas for strengthening surveillance, prevention, and response efforts.
Conclusion
Cholera remains a persistent public health threat in Ethiopia despite ongoing elimination efforts. According to an analysis of the GBD 2023 data, there were a moderate national decline in cholera mortality and overall burden between 2019 and 2023; however, the disease continues to impose a substantial health loss, with premature mortality (YLLs) accounting for more than 99% of total DALYs. The disease continues to thrive in settings with inadequate WaSH, recurrent droughts and floods, and humanitarian crises that disrupt public health services.
Ethiopia needs to strengthen multi-sectoral coordination under the NCP, increase sustainable WaSH infrastructure, and improve OCV coverage in high-risk and hotspot areas in order to buck the trend and reach the 2028 elimination target. For precise burden estimation and prompt response, it is essential to enhance surveillance, laboratory capacity, and real-time data use. Achieving long-term cholera control and eventual eradication will require developing resilient health systems that incorporate emergency preparedness, climate adaptation, and culturally informed community engagement.
Supplemental Material
sj-docx-1-inq-10.1177_00469580261437013 – Supplemental material for National and Subnational Burden of Cholera in Ethiopia, 2019 to 2023: Findings From the Global Burden of Diseases Study 2023
Supplemental material, sj-docx-1-inq-10.1177_00469580261437013 for National and Subnational Burden of Cholera in Ethiopia, 2019 to 2023: Findings From the Global Burden of Diseases Study 2023 by Alemayehu Abate, Melkamnesh Azage and Abaineh Munshea in INQUIRY: The Journal of Health Care Organization, Provision, and Financing
Footnotes
Appendix
Burden of Cholera in Amhara by Year, 2019 to 2023.

| Metrics | Category | 2019 | 2020 | 2021 | 2022 | 2023 |
|---|---|---|---|---|---|---|
| Deaths (number) | Total | 286 (UI:791-75) | 247(UI:714-59) | 227(UI:661-51) | 230(UI:679-50) | 229(UI:690-48) |
| Male | 161(UI:459-37) | 138(UI:417-29) | 125(UI:387-25) | 129(UI:397-25) | 128(UI:393-25) | |
| Female | 126(UI:332-37) | 109(UI:297-30) | 102(UI:273-27) | 100(UI:281-25) | 101(UI:297-23) | |
| <5 years | 81(UI:189-27) | 64(UI:155-18) | 57(UI:137-14) | 48(UI:120-12) | 45(UI:116-11) | |
| 5-14 years | 70(UI:213-17) | 62(UI:194-14) | 59(UI:180-12) | 57(UI:177-12) | 53(UI:165-11) | |
| 15-24 years | 28(UI:83-6) | 26(UI:77-5) | 24(UI:71-5) | 24(UI:73-5) | 24(UI:74-4) | |
| 25-49 years | 58(UI:173-12) | 52(UI:162-11) | 48(UI:151-10) | 55(UI:173-11) | 58(UI:189-11) | |
| ≥50 years | 49(UI:134-13) | 43(UI:125-11) | 40(UI:122-10) | 45(UI:135-1) | 49(UI:146-110 | |
| Mortality rate (per 100 000) | 20.6 (UI: 5.17-56.8) | 20.54 (UI: 5.15-56.69) | 20.50 (UI: 5.14-56.61) | 20.47 (UI: 5.13-56.56) | 20.45 (UI: 5.13-56.53) | |
| YLDs (years lived with disability) | 33(UI:51-20) | 29(UI:47-17) | 28(UI:44-16) | 27(UI:43-16) | 27(UI:42-16) | |
| YLLs (years of life lost) | 19 172(UI:52 408-5089) | 16 358(UI:46 733-3909) | 14 994(UI:42 761-3359) | 14 651(UI:42 696-3127) | 14 266(UI:42 533-3000) | |
| DALYs (number) | 19 204(UI:52 459-5109) | 16 387(UI:46 779-3927) | 15 022(UI:42 805-3376) | 14 678(UI:42 739-3143) | 14 293(UI:42 575-3015) |
Acknowledgements
The authors appreciate the works by the GBD Study 2023 collaborators.
Ethical Considerations
The study was exempt from institutional review board approval since it used aggregated, anonymized data from databases and publicly accessible sources. Every original source of data used in the GBD study complies with regional ethical standards.
Consent for Publication
The authors have reviewed and approved the manuscript for submission and publication
Authors’ Contributions
The corresponding author (AA) was involved in the conception, design, drafted the present manuscript and data analysis. All authors (AA, MA and AM) were involved in analysis and interpretation of data. AA (corresponding author) and AM have been involved in critically revising the manuscript for important intellectual content.
Funding
The authors received no financial support for the research, authorship, and/or publication of this article.
Declaration of Conflicting Interests
The authors declared no potential conflicts of interest with respect to the research, authorship, and/or publication of this article.
Data Availability Statement
All the generated data in this article are included in the manuscript. The original data can be obtained from the corresponding author upon request Alemayehu Abate :
Supplemental Material
Supplemental material for this article is available online.