
Abstract
To investigate the predictive value of the C-reactive protein–triglyceride–glucose index (CTI) for liver disease events in a community-based middle-aged and older population. Based on data from 5 waves of the China Health and Retirement Longitudinal Study (CHARLS) database, this study utilized data from the 2011 and 2015 waves, which included blood samples. A time-dependent Cox regression model was employed to analyze the association between CTI and the risk of liver disease events. Rigorous model testing, along with robustness and heterogeneity analyses, were conducted. A total of 733 incident liver disease events were documented during the follow-up period. After full adjustment for confounding factors, each 1-unit increment in CTI was significantly associated with a 21.0% increased risk of liver disease (Hazard Ratio [HR] = 1.210, 95% Confidence Interval [CI]: 1.109-1.321). In addition, each quartile increase in baseline CTI was associated with a statistically significant 12.2% elevated risk of incident liver disease. This association remained robust in sensitivity analyses after excluding events with potential reverse causality and replacing biomarkers. Subgroup analyses further identified consistent patterns of this association across different populations. This study is the first to demonstrate, within a nationally representative community-based cohort of middle-aged and older adults, that the CTI is an independent and robust predictor of incident liver disease. As a composite metabo-inflammatory marker, the CTI model exhibited slightly better model fit (lower AIC/BIC) and marginally higher discriminatory ability (C-index) than the single-marker models of TyG index and CRP alone. It can be utilized to identify high-risk individuals in middle-aged and older populations, providing a novel epidemiological tool for the early warning of liver disease.
Keywords
Introduction
Liver disease represents a major global public health issue, contributing significantly to morbidity and mortality worldwide. A range of liver conditions, including viral hepatitis, 1 cirrhosis, 2 drug-induced liver injury, autoimmune liver diseases, alcohol-related liver disease,3,4 and metabolic dysfunction-driven non-alcoholic fatty liver disease (NAFLD),5,6 collectively impose a substantial global health burden.7,8 Therefore, early identification of high-risk individuals in the general population and effective primary prevention are critical components of current liver disease control strategies.
The onset and progression of liver disease constitute a multifactorial and multi-step process, involving dyslipidemia, insulin resistance, and the interplay of genetic and environmental factors.9-11 These factors collectively promote abnormal hepatic fat accumulation and activate inflammatory responses, 12 which in turn drive hepatic steatosis and fibrosis.13,14 Among these, chronic inflammation and metabolic dysregulation are recognized as core driving mechanisms.
C-reactive protein (CRP), a classic inflammatory marker, has garnered significant attention for its role in liver diseases. In non-obese populations, elevated serum high-sensitivity CRP (hs-CRP) levels have been positively associated with NAFLD prevalence, suggesting its role as a risk factor. 15 Furthermore, CRP may influence the onset and progression of metabolic dysfunction-associated steatotic liver disease (MASLD) by modulating inflammatory responses.16,17 Other studies have revealed that elevated CRP levels are closely associated with the occurrence of cirrhosis 18 and hepatocellular carcinoma, implying that CRP may play a significant role in the progression of chronic liver diseases.
The triglyceride-glucose (TyG) index, recognized for its strong association with insulin resistance and cardiovascular risk, has been extensively investigated in liver disease research. Studies have demonstrated that the TyG index outperforms traditional liver function indicators like alanine aminotransferase (ALT) in predicting NAFLD risk. 19 Its modified versions (eg, TyG-BMI and TyG-WC) also show high predictive value for metabolic dysfunction-associated steatotic liver disease (MASLD) and metabolic syndrome in specific populations such as obese youth.20,21 These findings underscore the potential value of the TyG index in the diagnosis and management of liver diseases.
The role of platelets in liver disease is a complex and multifaceted subject. Some studies highlight a restorative role for platelets in liver disease. They participate in liver regeneration and fibrosis regulation by releasing growth factors and cytokines. 22 For example, platelet transfusion has been shown to improve liver function parameters in chronic liver disease and cirrhosis. 23 Additionally, platelets may attenuate fibrosis by inhibiting hepatic stellate cell activation and collagen production.24,25 Conversely, other studies present opposing findings. In NAFLD patients, platelets exhibit pro-inflammatory effects that positively correlate with the degree of liver inflammation and fibrosis.26,27 Antiplatelet therapy is considered potentially beneficial for improving NAFLD by reducing intrahepatic platelet aggregation and inflammatory responses.28,29 Additionally, in patients with chronic hepatitis B, platelet activation is associated with the progression of liver inflammation and fibrosis. 30 Antiplatelet agents such as aspirin and clopidogrel have demonstrated potential in preventing hepatocellular carcinoma in animal models. 31
The C-reactive protein–triglyceride–glucose index (CTI) integrates C-reactive protein, which reflects systemic inflammation levels, with the triglyceride-glucose index, representing the state of insulin resistance and glucose-lipid metabolism. 32 The CTI is thus considered a robust tool for quantifying the “metaboinflammatory” status 33 and has demonstrated excellent predictive value for cardiovascular disease and diabetes. 34 However, despite metabolic abnormalities and inflammation being common pathological bases for liver diseases, the predictive role of CTI for non-tumorous liver diseases in the general population remains underexplored. In particular, evidence from large-scale prospective community-based cohorts is lacking.
China is facing the dual challenges of an aging population and a rising prevalence of metabolic diseases, alongside a rapidly evolving spectrum of liver diseases. This study utilizes the nationally representative CHARLS community cohort to prospectively investigate the association between the C-reactive protein–triglyceride–glucose index (CTI) and the risk of new-onset, non-tumorous liver disease among middle-aged and older adults. It aims to determine whether CTI can effectively identify high-risk individuals, which could provide a simple and effective strategy for the early screening and primary prevention of liver disease.
Study Design
Data Source
The data for this study were obtained from the publicly available database of the China Health and Retirement Longitudinal Study (CHARLS). CHARLS is a large-scale, community-based cohort study targeting the Chinese population aged 45 years and older. It employs a multi-stage sampling method, covering 28 provinces (autonomous regions, municipalities) across China, making it nationally representative. The baseline survey was performed in 2011, with follow-up surveys conducted every 2 years until 2020. Participants are followed longitudinally, with detailed information collected on sociodemographics, lifestyle, clinical examinations, and blood samples. The outcome events for this study utilized all 5 waves of CHARLS data (2011, 2013, 2015, 2018, 2020). Blood test data from the 2011 and 2015 waves were used, providing the basis for calculating the core independent variable. The CHARLS project received ethical approval from the Biomedical Ethics Committee of Peking University (IRB Approval Number: IRB00001052-11015). All participants in the original CHARLS study provided written informed consent. The present study is a secondary analysis of publicly available, anonymized CHARLS data. Since this study did not involve direct contact with human subjects or collection of individual identifiers, separate ethical approval and additional informed consent were not required.
Sample Selection
The sample selection process was as follows: From the 96 628 participants in the 5 waves of CHARLS panel data, we first excluded 3018 participants who were not fasting before blood draw to ensure the accuracy of biochemical indicator measurements. Secondly, the study was restricted to individuals aged ≥ 45 years, leading to the exclusion of 2249 participants under 45, ensuring the sample met the basic requirement of focusing on a middle-aged and older population. Subsequently, a survival analysis framework was constructed by creating baseline survival records (1 record per individual), retaining 25 525 sample records (excluding 65 836 records). Based on this, time segmentation was performed using the 2015 wave to create a time-dependent covariate. This resulted in 2 observation records per participant: for the period 2011 to 2014, variables from the 2011 wave were used, and for 2015 onward, variables from the 2015 wave were used. The sample size was expanded to 45 856 records (adding 20 331 new records). Finally, the complete-case analysis principle was applied, excluding 28 405 records with any missing values in the analysis variables. Consequently, 17 451 participants were included in the final analysis. The sample selection flowchart is detailed in Figure 1.
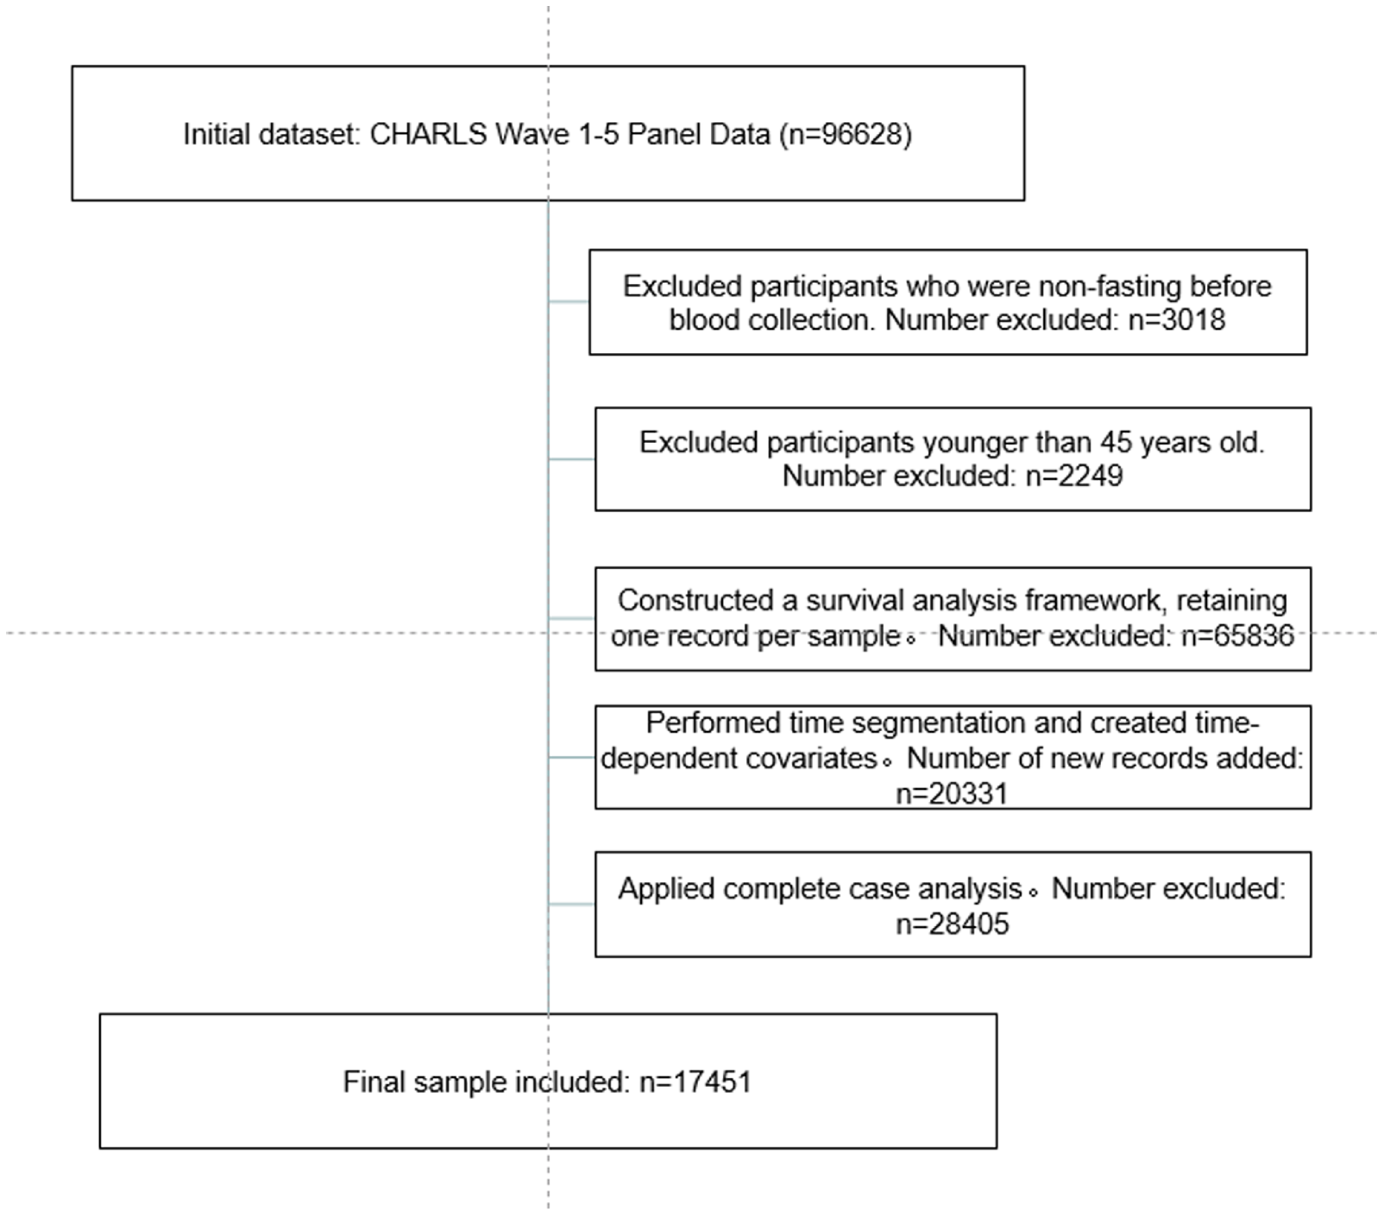
Flowchart of participant selection.
Variable Definition
Dependent Variable
Liver disease events. This was a binary variable. It was determined based on affirmative responses to the survey questions: “Has a doctor ever told you that you have a liver disease (Including: viral hepatitis, alcoholic liver disease, autoimmune liver disease, liver cirrhosis, and excluding fatty liver, tumors, or cancer)?” and “Are you currently taking medication for a liver disease?.” Otherwise, it was defined as not having occurred.
Survival time: Defined as the duration (in years) from the baseline survey time point to the first occurrence of a liver disease event. For censored individuals, survival time was calculated from enrollment to the last follow-up (2020) or the time of loss to follow-up.
Core Independent Variable
C-reactive protein–triglyceride–glucose index (CTI). This index was a continuous variable. Utilizing blood sample test results from the 2011 and 2015 waves, CTI values were calculated separately for each of these years. The formula was: CTI = 0.412 × ln(CRP) + ln(triglycerides × fasting glucose/2).34,35 Here, CRP is measured in mg/L, and both triglycerides and fasting glucose are measured in mg/dL. This index comprehensively reflects the body’s inflammation and insulin resistance levels.
Control Variables
All control variables were obtained from the 2011 and 2015 survey waves, respectively.
Demographic characteristics: Age (continuous), gender (male/female), education level (junior high school and below/high school or vocational school/college degree or above), marital status (with spouse/without spouse), residence (urban/rural).
Lifestyle factors: Current smoker (yes/no), current drinker (yes/no).
Physical examination indicators: Body mass index (BMI, continuous), systolic blood pressure, diastolic blood pressure (continuous).
Blood biomarkers: Serum creatinine, total cholesterol, hemoglobin, platelet count, uric acid (all continuous). Cystatin C (as a substitute for creatinine), high-density lipoprotein cholesterol, and low-density lipoprotein cholesterol (whose sum was used to substitute for total cholesterol) were also collected for subsequent robustness analyses.
It should be noted that the CTI may predispose individuals to various chronic diseases, which themselves could lie on the causal pathway between CTI and the incidence of liver disease. Furthermore, treatments for these conditions may also confound the association between CTI and liver disease outcomes. Therefore, to avoid potential over-adjustment bias or masking of the true effect, this study did not include other pre-existing chronic diseases or medication history as control variables in the analysis.
Statistical Methods
First, descriptive statistics were used to summarize the baseline characteristics of the study participants. Continuous variables are presented as mean ± standard deviation, and categorical variables are presented as frequency and percentage.
Time-dependent Cox proportional hazards models were applied in this study. All variables were updated once in 2015. Variables with the suffix “_td” represent time-dependent covariates: measurements from the 2011 baseline were used for the follow-up period 2011 to 2014, and the second measurements obtained in 2015 were used for the follow-up period 2015 to 2020. Therefore, the statistics presented in the tables (mean ± standard deviation or frequency/percentage) reflect the pooled distribution across all person-time observations during the entire study period (2011-2020), rather than pure baseline characteristics. For instance, the mean value of “age_td” represents the overall average age across all time points during follow-up. Variables measured at the original baseline (2011) are denoted with the suffix “_2011.”
Second, to fully utilize the blood test data collected in both the 2011 and 2015 waves and dynamically assess the impact of the CTI on the risk of incident liver disease, a time-dependent Cox regression model was employed to analyze the association between CTI and liver disease risk. To control for potential confounding, 4 models were constructed: Model 1 included only CTI; Model 2 added demographic variables to Model 1; Model 3 further added lifestyle factors and physical examination indicators (BMI, blood pressure) to Model 2; and Model 4 additionally included all blood biomarkers. Results are presented as hazard ratios (HRs) with their 95% confidence intervals (CIs). Additionally, to clarify the clinical significance of the results, CTI values at the 2011 baseline were categorized into quartiles, and a conventional Cox regression model was used to evaluate the risk of incident liver disease across different quartile groups.
Third, rigorous model testing and sensitivity analyses were performed: (1) Variance inflation factors (VIFs) were calculated to test for multicollinearity; (2) The proportional hazards assumption was tested using Schoenfeld residuals, and variables violating this assumption (current smoking) were handled by stratification; (3) Multiple sensitivity analyses were conducted to assess the robustness of the results, including excluding reverse causality events, analyzing using alternative blood biomarkers (cystatin C, HDL, LDL), and winsorizing continuous variables.
Finally, to explore the heterogeneity of the association, subgroup analyses were performed stratifying by sex, age (dichotomized at 65 years), marital status, residence, and clinical platelet count groups. Interaction effects were tested, and grouped analyses were conducted for marital status and platelet count.
All statistical analyses were performed using Stata software version 17.0. A 2-sided significance level of α = .05 was used.
Results
Descriptive Statistics
A total of 17 451 participants were included in this study. The mean age was 59.90 ± 9.39 years, and the mean body mass index (BMI) was 24.29 ± 21.91 kg/m2. Regarding sociodemographic characteristics, females (54.13%) slightly outnumbered males (45.87%). The vast majority of participants had an education level of junior high school or below (90.02%), resided in rural areas (63.69%), and were married (87.58%). In terms of lifestyle factors, most participants were non-smokers (71.53%) and non-drinkers (65.62%). Clinical and biochemical indicators showed that the mean systolic and diastolic blood pressures were 128.26 ± 20.29 mmHg and 75.32 ± 11.70 mmHg, respectively. The mean C-reactive protein–triglyceride–glucose index (CTI) was 8.77 ± 0.85, and total cholesterol was 189.15 ± 37.47 mg/dL (4.90 ± 0.97 mmol/L). Other indicators, such as serum creatinine, hemoglobin, platelet count, and uric acid levels, are all listed in Table 1.
Descriptive Statistics.

Note. Variables with the suffix “_td” represent time-dependent covariates: measurements from the 2011 baseline were used for the follow-up period 2011 to 2014, and the second measurements obtained in 2015 were used for the follow-up period 2015 to 2020. Therefore, the statistics presented in the tables (mean ± standard deviation or frequency/percentage) reflect the pooled distribution across all person-time observations during the entire study period (2011-2020), rather than pure baseline characteristics.
Association Between CTI and Liver Disease Events
As shown in Table 2, we constructed 4 time-dependent Cox regression models to assess the association between the C-reactive protein–triglyceride–glucose index (CTI) and liver disease events, with sequential adjustment for different sets of confounding factors. In Model 1, which included only CTI, a significant independent risk effect was observed (HR = 1.185, 95% CI: 1.093-1.286, P < .001). After adjusting for demographic characteristics (age, sex, education level, marital status, and residence) in Model 2, the hazard ratio for CTI unchanged (HR = 1.185), indicating that its effect was not confounded by these basic sociodemographic factors. Additionally, Model 2 identified male sex (HR = 1.169, P < .05) and higher education level (compared to junior high school or below; HR = 1.879, P < .01) as significant risk factors. After further incorporating lifestyle factors (smoking, drinking) and basic clinical indicators (BMI, systolic and diastolic blood pressure) in Model 3, the association strength for CTI increased (HR = 1.199, 95% CI: 1.104-1.303, P < .001). Concurrently, current smoking showed a protective effect (HR = 0.796, P < .05), while the hazard ratio for male sex increased further (HR = 1.278, P < .01). In Model 4, which additionally included serological indicators (creatinine, cholesterol, hemoglobin, platelet count, uric acid), the association between CTI and the outcome event remained robust and reached its maximum effect size (HR = 1.210, 95% CI: 1.108-1.321, P < .001). In the final model, besides CTI, higher education level (HR = 1.785, P < .05) and higher platelet count (HR = 0.998, P < .01) were significant predictors, whereas the previously significant associations for sex and smoking became non-significant after including the serological indicators. The model chi-square (chi2) value increased significantly from 16.783 in Model 1 to 62.7 in Model 4, indicating that the sequentially added variable sets substantially improved the model’s explanatory power. In summary, these results demonstrate that CTI an independent risk factor for incident liver disease, and this association remained robust across varying degrees of adjustment for confounding factors.
Time-Dependent Cox Regression Model for the Correlation Between CTI and Liver Disease Events.

Note. Exponentiated coefficients; 95% confidence intervals in brackets. This table presents the overall distribution of time-dependent covariates during the study period. “Var_td” in variable names indicates time-varying characteristics: baseline values were used from 2011 to 2014, and the second measurements were used after 2015. Therefore, the statistics reflect the characteristics during the follow-up period rather than the baseline.
P < .05. **P < .01. ***P < .001.
To examine potential non-linear associations and threshold effects, we categorized baseline CTI into quartiles based on its distribution in the study population (Q1: ≤8.16, Q2: 8.16-8.67, Q3: 8.67-9.25, Q4: >9.25). We conducted a traditional Cox proportional hazards model analysis based on the 2011 baseline data (with a sample size of n = 7855). Participants in higher CTI quartiles exhibited progressively worse metabolic and inflammatory profiles, including higher BMI, blood pressure, cholesterol, and uric acid levels (all P for trend < .001).
In Cox proportional hazards models fully adjusted for demographic characteristics, lifestyle factors, and biomarkers, a significant dose-response relationship was observed between CTI quartiles and incident liver disease (P for trend = .003). Compared to the lowest quartile (Q1), participants in Q2, Q3, and Q4 had hazard ratios of 1.12 (95% CI: 0.88-1.43, P = .353), 1.23 (95% CI: 0.96-1.57, P = .099), and 1.42 (95% CI: 1.12-1.81, P = .004), respectively. These findings suggest that the association between CTI and liver disease risk is approximately linear, with particularly elevated risk in the highest quartile. As shown in Table 3.
Association Between Baseline CTI Quartiles and Incident Liver Disease.

Note. Exponentiated coefficients; 95% confidence intervals in brackets.
Reference group: CTI Q1 (lowest quartile).
All models are Cox proportional hazards models with robust standard errors.
The fully adjusted model controlled for age, gender, education, marital status, residence, smoking, alcohol drinking, BMI, blood pressure, creatinine, cholesterol, hemoglobin, platelet count, and uric acid.
“Var_2011” indicates variables measured at baseline.
P < .05. **P < .01. ***P < .001.
Trend tests further indicated that after adjustment for all covariates, each quartile increment in baseline CTI was associated with a statistically significant 12.2% increase in the risk of incident liver disease. As shown in Supplemental Table S1.
Model Testing
To ensure the reliability of the time-dependent Cox regression model, a series of diagnostic tests were conducted. Firstly, multicollinearity testing revealed that the variance inflation factor (VIF) for all variables was well below 10, with a mean value of 1.4, indicating no severe multicollinearity issues in the model.
Secondly, the proportional hazards assumption was tested using Schoenfeld residuals. The initial global test result was not significant (P = .3459), but the variable “current smoking” (smoken_td) was found to violate the proportional hazards assumption (P = .019). To address this, “current smoking” was included as a stratification variable in the model. Subsequent re-testing showed a non-significant global test result (P = .6415), confirming that all variables now met the proportional hazards assumption.
Finally, to examine potential non-linearity in the relationship between the core independent variable, the C-reactive protein–triglyceride–glucose index (cti_td), and the risk of the outcome, a likelihood ratio test was performed by adding a quadratic term for CTI to the model. The quadratic term for CTI was not significant (P = .6652, >.05), justifying the treatment of the relationship between CTI and incident liver disease as linear (see Supplemental Tables S2-Table S5).
Based on these diagnostics, the Cox regression model building upon Model 4, but stratified by the “current smoking” (smoken_td) variable, was deemed robust and reliable. This model was adopted as the primary model (Model 5) for subsequent robustness checks.
Robustness Analysis
To assess the robustness of the association between the C-reactive protein–triglyceride–glucose index (CTI) and the risk of liver disease, a series of sensitivity analyses were performed (Table 4). The fully adjusted stratified model (Model 5, HR = 1.210, 95% CI: 1.109-1.321) served as the primary reference model for comparison.
Robustness Analysis.

Note. Exponentiated coefficients; 95% confidence intervals in brackets.
All models are Cox proportional hazards models with robust standard errors.
Main model: full adjustment for demographics, lifestyle, and biomarkers.
Exclude Early Events : exclusion of liver disease events within first 2 years of follow-up.
Alternative Biomarkers: replaced creatinine with cystatin C, replaced total cholesterol with HDL and LDL.
Winsorized: continuous variables winsorized at 1st and 99th percentiles.
P < .05. **P < .01. ***P < .001.
First, to exclude reverse causality, cases of liver disease occurring within the first 2 years of follow-up were excluded (Model 6). The effect size of CTI, although slightly attenuated, remained highly significant (HR = 1.171, 95% CI: 1.067-1.285), indicating that the main findings were not substantially influenced by reverse causality.
Second, key laboratory indicators were substituted. In Model 7, serum creatinine was replaced with cystatin C, and total cholesterol was replaced by the high-density lipoprotein cholesterol (HDL-C) and low-density lipoprotein cholesterol (LDL-C). The strength of the association for CTI was largely consistent with the primary model (HR = 1.215, 95% CI: 1.102-1.341), suggesting that the results were insensitive to the choice of these alternative biomarkers.
Finally, continuous variables were winsorized at the 1st and 99th percentiles to control for the influence of extreme values (Model 8). CTI continued to show a significant risk effect (HR = 1.175, 95% CI: 1.071-1.289).
Furthermore, higher education level and platelet count also demonstrated significant and consistent associations across the different models. For each 1-unit increase (1 × 10⁹/L) in platelet count, the risk of incident liver disease decreased by 0.2%. Compared to individuals with an education level of junior high school or below, those with higher education had a 77.8% increased risk of liver disease.
Under this series of different analytical settings, the positive association between CTI and the risk of incident liver disease remained significant with stable effect sizes, providing strong evidence for the robustness of the primary findings of this study. As shown in Table 4.
Heterogeneity Analysis
To investigate whether the association between the C-reactive protein–triglyceride–glucose index (CTI) and incident liver disease differed across population subgroups with varying characteristics, interaction tests were conducted (see Table 5). Platelet count was categorized into three groups based on clinical cut-off values (<150, 150-400, >400 ×109/L). The analysis showed that the main effect of CTI was significant across gender, age groups, and residential location (urban/rural). The interaction terms for sex, marital status, residence, and platelet count were not statistically significant, suggesting that the positive association between CTI and incident liver disease was relatively stable across these subgroups, with no clear evidence of effect modification. However, age group (dichotomized at 65 years) was identified as a significant effect modifier, with age ≥ 65 years being a strong independent risk factor.
Heterogeneity Analysis.

Note. Exponentiated coefficients; 95% confidence intervals in brackets.
All models are Time-dependent Cox model.
The interaction terms test the heterogeneity of the CTI association among different subgroups.
Platelets were clinically classified into three groups according to WHO criteria: <150, 150–400, and >400 ×10⁹/L.
P < .05. **P < .01. ***P < .001.
To further explore specific patterns where the overall interaction test was non-significant, stratified Cox regression analyses were performed for marital status and platelet count groups (see Table 6). The results indicated that the positive association between CTI and incident liver disease remained significant and robust in the married subgroup (HR = 1.227, 95% CI: 1.118-1.346) but did not reach statistical significance in the unmarried subgroup (HR = 1.103, 95% CI: 0.835-1.458), although the point estimate was in the same direction. This difference might be partly attributable to the relatively smaller sample size (N = 2125) and fewer incident cases (N_fail = 87) in the unmarried subgroup, leading to insufficient statistical power. Similarly, subgroup analysis based on clinical platelet categories showed that the association of CTI was significant only in the normal platelet count group (150-400 × 109/L; HR = 1.228, 95% CI: 1.110-1.358). In the thrombocytopenia group (<150 × 109/L), the hazard ratio point estimate for CTI was 1.159 (95% CI: 0.969-1.387), which was not statistically significant. Notably, the thrombocytosis group (>400 × 109/L) had a very small sample size (N = 185, events = 7), resulting in highly unstable risk estimates (eg, HR for CTI = 1.289, 95% CI: 0.504-3.298) and extreme values for other variables’ hazard ratios; therefore, the results for this subgroup should be interpreted with caution.
Grouped Time-Dependent Cox Regression Model Test.

Note. Exponentiated coefficients; 95% confidence intervals in brackets.
P < .05. **P < .01. ***P < .001.
The stratified analyses suggest that the strength of the CTI association might differ numerically between married and unmarried individuals, as well as across different platelet count levels. However, due to sample size limitations in the unmarried and abnormal platelet count subgroups (especially the thrombocytosis group), a definitive conclusion regarding the presence of effect modification cannot be drawn. These findings indicate that the evidence for the association between CTI and incident liver disease is most robust in individuals with normal platelet counts and those who are married.
Comparison of Model Prediction Capabilities
To compare the predictive performance of CTI, CRP, and TyG index, 3 time-dependent Cox models were constructed following the same structure as the main CTI model (Model 5), with the core independent variable replaced by CRP or TyG, respectively. The log-likelihood, AIC, and BIC values of the 3 models are presented in Table 7.
Comparison of Predictive Capabilities of CTI, CRP, and TyG, Models.

Note. Exponentiated coefficients; 95% confidence intervals in brackets.
Harrell’s C-index could not be computed for the time-dependent Cox models. Therefore, to evaluate and compare the discriminative ability of the models, a fixed-covariate Cox model was fitted using the 2015 data to predict incident liver disease in 2018 and 2020. The model was stratified by smoken_td and clustered by pid.
P < .05. **P < .01. ***P < .001.
As shown, the CTI model achieved the highest log-likelihood value (–6166.86) and the lowest AIC (12 365.72) and BIC (12 489.71) among the 3 models, indicating that the CTI model (Model 5) provided the best goodness-of-fit. This suggests that, when adjusted for the same set of covariates, the CTI model fits the data more closely than the models containing only CRP or TyG.
Harrell’s C-index is a widely used measure of predictive discrimination in survival analysis. Because it cannot be computed directly from time-dependent Cox models, a fixed-covariate Cox model was employed using the 2015 measurements to predict liver disease occurring in 2018 and 2020. The resulting C-index for the CTI model was 0.585, which was higher than those of the CRP model (0.573) and the TyG model (0.579), implying that CTI offers superior predictive accuracy.
Continuous net reclassification improvement (NRI) analysis showed that the NRI of CTI compared with the CRP model was 0.000 (95% CI: −0.085 to 0.085, P = 1.000), and the NRI of CTI compared with the TyG model was also 0.000 (95% CI: −0.085 to 0.085, P = 1.000), indicating that CTI failed to provide effective improvement in risk reclassification.
Integrated discrimination improvement (IDI) analysis further confirmed this finding: the IDI of CTI relative to CRP was +0.0021, and the IDI relative to TyG was 0.0013. Both values were far below the clinically meaningful threshold of 0.01, suggesting that the improvement in the discriminatory ability of CTI was negligible.
Although CTI did not show statistically significant improvements in discrimination metrics (C-index, NRI, IDI), its better model fit (lower AIC and BIC values) indicated that as a composite marker integrating metabolic and inflammatory information, CTI provided a more parsimonious model expression. This finding supports the theoretical value of CTI as a “metaboinflammatory” marker.
Discussion
This study is the first to prospectively investigate the association between the C-reactive protein–trlyceride–glucose index (CTI) and the risk of liver disease events within a large-scale cohort. Through multivariable adjustment, rigorous model diagnostics, and robustness testing, we derived the following core conclusions.
CTI is an Independent Risk Factor for Liver Disease Events
The TyG index has garnered considerable attention in recent clinical studies evaluating both acute and chronic hepatobiliary diseases. Evidence indicates a close association between the TyG index and the risk of metabolic dysfunction-associated steatotic liver disease (MASLD) and significant liver fibrosis. 36 Its predictive performance is notably superior to other non-invasive models, particularly in individuals with obesity or metabolic unhealth. 37 Simultaneously, in the context of acute hepatobiliary conditions, CRP levels serve as one of the indicators reflecting hepatic inflammatory status and assessing injury severity. When combined with other inflammatory and immunonutritional markers, CRP can enhance the predictive capability for disease prognosis. Moreover, in patients with acute liver failure, changes in CRP levels can serve as an important prognostic indicator. 38 In chronic liver disease, CRP is closely linked to the progression of liver fibrosis. Elevated CRP levels in patients with chronic liver disease may signal disease worsening. 39 Furthermore, combining CRP with other biomarkers can improve the accuracy of assessing liver disease severity. For example, the CRP-to-albumin ratio (CAR) has demonstrated significant prognostic value in patients with hepatocellular carcinoma. 40
The C-reactive protein–triglyceride–glucose index (CTI) includes C-reactive protein (CRP), a well-recognized biomarker of systemic inflammation. Elevated CTI may reflect a combined state of metabolic disturbance and persistent low-grade inflammation, which together contribute to liver injury and the occurrence of liver disease events. Therefore, inflammation may serve as an important biological link between CTI and the risk of liver disease.
The primary finding of this study is that CTI is an independent and robust predictor of incident liver disease. In the fully adjusted model, each 1-unit increase in CTI was associated with a 21.0% increase in the risk of liver disease. This association remained stable in sensitivity analyses excluding early events and substituting biomarkers, confirming the reliability of the results.
In terms of predictive performance, the CTI model showed slightly better model fit (lower AIC/BIC) and marginally higher discrimination (C-index) than models using TyG or CRP alone. However, no significant improvement in risk reclassification (NRI) was observed. The quartile analysis revealed a clear dose-response relationship, with participants in the highest CTI quartile experiencing a 42% increased risk of incident liver disease compared to those in the lowest quartile. This graded association, coupled with the significant trend test (P = .003), supports the utility of CTI as a continuous risk predictor. The findings also suggest potential clinical thresholds, as risk elevations became statistically significant in the highest quartile (CTI > 9.25).
The CTI integrates C-reactive protein, reflecting systemic inflammation, and the triglyceride-glucose index, representing insulin resistance. Insulin resistance leads to excessive hepatic fat deposition, and the subsequent chronic low-grade inflammation drives the progression from simple steatosis to steatohepatitis, liver fibrosis, and even cirrhosis.20,21 This finding has strong biological plausibility. Therefore, CTI can be regarded as a comprehensive “metabo-inflammatory” marker that effectively captures the key pathophysiological state preceding the onset of liver disease. Our study confirms that this simple index can be used to identify individuals at high risk for liver disease early within the general community population, providing an important tool for the primary prevention of liver disease.
Platelet Count Exerts a Protective Effect Against Incident Liver Disease
Platelet count demonstrated a dual significance in liver disease risk assessment in this study. Firstly, in the fully adjusted primary model, platelet count as a continuous variable showed an independent protective effect (HR = 0.998, P < .01), indicating that higher platelet levels were associated with a lower risk of liver disease. This aligns with the clinical consensus that thrombocytopenia is a marker of advanced liver disease (eg, cirrhosis).24,25 Secondly, subgroup analysis further refined this finding: the significant association between CTI and liver disease risk was primarily concentrated in the normal platelet count group, whereas it was not significant in the thrombocytopenia subgroup. This strongly suggests that for the broad community population with normal platelet counts, CTI, as an initiator of “metaboinflammation,” has excellent predictive value in the early stages of liver disease pathogenesis. However, when individuals progress to advanced stages characterized by thrombocytopenia (eg, preclinical cirrhosis), the disease process may be dominated by complications such as portal hypertension, and the role of CTI could be relatively attenuated or masked. Therefore, platelet count is not only an important predictor but also a key effect modifier, collectively defining the most valuable application scenario for CTI: early screening for liver disease risk in community-dwelling individuals with normal platelet counts.
Potential Explanations for the Association With Education Level and the Interaction With Age
The findings from the sociodemographic subgroups provide another layer of insight. Firstly, the “paradoxical” association between higher education level and increased liver disease risk might reflect specific behavioral patterns within this group. One plausible explanation is that individuals with higher education may possess greater health awareness and better access to follow-up using electronic medical records, leading to higher detection rates of asymptomatic early-stage liver disease (eg, fatty liver), thereby inflating the “incidence” in this group. Alternatively, the increased risk could be attributed to lifestyle factors more common in this group, such as specific dietary patterns, work-related stress, sleep disorders, or sedentary behavior, all of which are known risk factors for MASLD. This highlights the need for targeted research into the social determinants of liver disease.
Secondly, although the predictive effect of CTI was consistent across age groups, advanced age (≥65 years) itself was a strong independent risk factor. This aligns with the “multiple-hit” hypothesis of liver disease pathogenesis. With aging, the liver’s regenerative capacity and metabolic reserve decline, while susceptibility to various injurious factors increases. Consequently, in older individuals, even a relatively moderate “metaboinflammatory hit” as indicated by CTI might be more likely to trigger liver disease due to the inherent vulnerability of the liver. This suggests that liver disease prevention strategies for the elderly need to be more aggressive and comprehensive.
Conclusion
In this large-scale prospective cohort study, we demonstrate for the first time that the C-reactive protein–triglyceride–glucose index (CTI) is an independent risk factor for incident liver disease among middle-aged and older adults. The positive association between CTI and liver disease risk remained significant and stable after adjustment for multi-dimensional confounding factors and a series of robustness tests. The superior predictive ability of this index underscores its value as a comprehensive “metaboinflammatory” marker capable of effectively capturing the core pathophysiological state preceding the onset of liver disease. Furthermore, the study found that the predictive value of CTI is particularly prominent in early-stage populations with normal platelet counts and revealed potential unique patterns between liver disease risk and socioeconomic factors, such as education level. The findings indicate that CTI, as an easily accessible and simple metric, holds significant potential for application in the primary prevention and early risk stratification of liver disease within community populations.
Limitations and Prospects
Although this study was rigorously designed and yielded insightful findings, several limitations should be acknowledged. Firstly, as an observational study, despite extensive adjustment for known confounders, the influence of unmeasured residual confounding factors (eg, detailed dietary patterns, work stress) cannot be entirely ruled out. Secondly, incident liver disease was identified based on self-reported and physician-diagnosed information, a method susceptible to information bias. Asymptomatic individuals or those who did not seek medical care might be underreported, potentially resulting in underdiagnosis bias. Thirdly, this study was based on the single Chinese CHARLS cohort, which limits the generalizability and external validity of our findings. Further validation in other ethnicities and younger populations is needed in future research.
Based on these limitations, future research could proceed in the following directions: First, validate the predictive efficacy of CTI for liver disease in independent cohorts with greater diversity. Second, further differentiate its predictive value for various liver disease subtypes, such as fatty liver disease, viral hepatitis, and alcohol-related liver disease, to develop more accurate predictive models for liver disease progression. Third, investigate the underlying behavioral and environmental mechanisms behind the association between higher education level and liver disease risk, providing a basis for formulating precise public health intervention strategies.
Supplemental Material
sj-docx-1-inq-10.1177_00469580261433444 – Supplemental material for The C-reactive Protein–Triglyceride–Glucose Index in Relation to Liver Disease
Supplemental material, sj-docx-1-inq-10.1177_00469580261433444 for The C-reactive Protein–Triglyceride–Glucose Index in Relation to Liver Disease by Jinming Fang and Ling Liu in INQUIRY: The Journal of Health Care Organization, Provision, and Financing
Footnotes
Ethical Considerations
The CHARLS has been cleared by Peking University Biomedical Ethics Review Board (IRB Approval Number: IRB00001052-11015).
Consent to Participate
All participants provided written informed consent.
Author Contributions
Jinming Fang developed the study framework and drafted the manuscript. Ling Liu participated in the statistical analysis, performed the literature review and conducted manuscript editing and review. All contributors endorsed the final draft.
Funding
The authors received no financial support for the research, authorship, and/or publication of this article.
Declaration of Conflicting Interests
The authors declared no potential conflicts of interest with respect to the research, authorship, and/or publication of this article.
Supplemental Material
Supplemental material for this article is available online.