
Abstract
Obesity among Turkish women remains a major public health challenge, with Turkiye ranking first in women obesity rates across Europe. Despite national health promotion efforts, obesity prevalence continues to rise, emphasizing the need to identify its socioeconomic and behavioral determinants. This study analyzes data from the 2017 Turkish Nutrition and Health Survey (TNHS), a nationally representative sample of approximately 6900 women aged 18 to 85. Missing data for daily walking time were addressed using multiple imputation by chained equations, and the survey’s multi-stage design was incorporated through survey-adjusted Generalized Ordered Logit Models. Socioeconomic predictors include age, education, employment, and marital status, while behavioral variables cover nighttime snacking and daily walking duration. Age and marital status significantly increase the probability of obesity, whereas higher education and employment reduce it by 15 to 19 and 5% points, respectively. “Night snack” and “Walk” variables display the expected signs but limited statistical significance, suggesting that lifestyle behaviors alone cannot explain obesity variation. The overweight category exhibits mostly insignificant marginal effects, indicating that determinants exert stronger influence at the normal and obese thresholds. Findings highlight that structural socioeconomic factors, rather than individual behaviors, primarily drive obesity among Turkish women. Effective interventions should therefore combine educational and workplace programs with culturally sensitive public health strategies. This study provides robust, nationally representative evidence to inform gender-responsive obesity prevention policies in Turkiye and comparable societies undergoing rapid socioeconomic change.
Highlights
Socioeconomic factors are strong predictors of obesity in Turkish women.
Finds that age and marital status increase, while education and employment reduce, obesity risk.
Behavioral variables like walking and snacking show limited statistical impact.
Findings support the need for gender-sensitive and integrated obesity interventions.
Introduction
Obesity is one of the most pressing public health challenges of the modern age, driven by shifts in nutritional behaviors, socioeconomic structures, and lifestyle norms. 1 Among the numerous determinants of obesity, socioeconomic status (SES) plays a pivotal role in shaping individuals’ access to health-promoting resources, such as nutritious foods, healthcare services, and opportunities for physical activity. 2 Lower SES has been consistently associated with higher obesity risk due to intersecting factors including economic constraints, health literacy gaps, and environmental conditions that favor sedentary behaviors and calorie-dense diets. 3
Although obesity affects diverse population groups, women from socioeconomically disadvantaged backgrounds are particularly vulnerable due to gendered social roles, income inequality, and cultural dietary norms. 3 In many societies, including Turkiye, women bear disproportionate responsibility for domestic labor and caregiving, often at the expense of their participation in physical activity or structured health programs.4,5 Additionally, limited financial autonomy and access to healthy food options, combined with sociocultural pressures around body image and femininity, may lead to disordered eating patterns, such as emotional eating or restrictive dieting cycles.6,7
These interlocking social, economic, and cultural mechanisms contribute to a heightened risk of obesity among Turkish women. According to the World Health Organization’s 2022 European Regional Obesity Report, Turkiye has the highest prevalence of female obesity among 52 European countries. 8 National data indicate that 23.6% of Turkish women are classified as obese, compared to 16.8% of men. 9 This disparity, alongside unique gender-specific barriers, motivates a focused analysis on women’s obesity as a distinct public health issue requiring tailored policy solutions.
Turkiye’s rapid urbanization and socioeconomic transition over recent decades have introduced major changes in dietary behavior, work routines, and mobility patterns, all of which are closely tied to rising obesity trends. 10 Yet women’s lived experiences are further shaped by structural inequalities and normative expectations that influence their food choices, time allocation, and mental well-being.11,12 These factors warrant an integrative, gender-sensitive framework that acknowledges both material deprivation and cultural context.
Despite growing concern, limited empirical work has systematically investigated the combined effects of socioeconomic and behavioral factors on women’s obesity in Turkiye.13,14 Moreover, most existing studies rely on simplistic classifications or overlook contextual behavioral variables.15,16 This study addresses this gap by analyzing nationally representative data from the 2017 Turkish Nutrition and Health Survey (TNHS), incorporating both structural indicators (education, employment, marital status) and individual-level factors (eg, night snacking, walking frequency). Grounded in the social determinants of health framework, the study avoids causal claims and instead explores associations between these variables and women’s Body Mass Index (BMI) categories using a Generalized Ordered Logit Model. This approach allows for a nuanced investigation of how intersecting determinants interact in a middle-income, culturally transitional setting. The findings aim to inform gender-sensitive and context-specific public health strategies that go beyond conventional behavioral recommendations and acknowledge deeper socioeconomic and cultural dimensions of women’s health in Turkiye.
Socioeconomic Factors and Women’s Obesity in Turkiye
In the context of Turkiye, the intersection of socioeconomic status (SES) and women’s obesity remains underexplored, despite its clear relevance to public health. While prior research16,17 has identified associations between SES and obesity, studies 18 specifically focused on Turkish women—accounting for their unique social, cultural, and economic circumstances—are limited. The multifaceted interaction between income, education, employment, and cultural norms necessitates a more nuanced analysis to better understand women’s elevated obesity risk in Turkiye.
Global evidence has shown that low income is consistently associated with higher obesity prevalence among women, and Turkiye follows this pattern. For instance, Santas and Santas 19 demonstrated that women with lower income levels are more likely to experience obesity, which may stem from restricted access to healthy food, healthcare, and recreational opportunities. Economic limitations often force reliance on inexpensive, energy-dense foods, while time poverty—resulting from labor market precarity or caregiving obligations—can constrain physical activity. These conditions, rather than individual choices alone, structure the obesogenic environment many women face.
Education is another key dimension. Demirkan et al 20 found that women with lower educational attainment are at heightened risk of obesity, likely due to reduced health literacy and awareness of nutrition, physical activity, and long-term health risks. Education can empower women to adopt healthier behaviors and navigate healthcare systems more effectively. It is also positively associated with labor force participation, income, and social networks—all of which may indirectly influence health behavior and access to health-promoting resources.
Employment status, while less studied in Turkiye’s obesity literature, adds another layer of complexity. On one hand, employment may facilitate access to health services and provide financial security, both potentially protective. On the other, working women may face sedentary job conditions, high stress, and long working hours, all of which can increase obesity risk. Prior studies21,22 that highlight employment as a protective factor may overlook the heterogeneous impact of job type, sector, and work intensity. A more refined approach that incorporates working conditions, not just employment status, is needed.
Cultural and social norms further shape obesity risk. Traditional gender roles assign women primary responsibility for domestic labor, often limiting time and energy for physical activity. Cultural ideals around body image also influence behavior—while some regions may normalize or even idealize fuller body types, others increasingly reflect Western beauty standards that equate thinness with attractiveness. This duality can create psychological tension and conflicting pressures that drive emotional or restrictive eating behaviors.23 -25
Additionally, Turkiye’s rapid urbanization and economic transition have led to substantial lifestyle changes. Diets have shifted from traditional, nutrient-rich patterns to increased consumption of processed foods and sugary beverages. Urban women, in particular, are exposed to sedentary lifestyles driven by motorized transport and screen-based work. The widespread availability and marketing of unhealthy foods in urban centers compounds the issue. 18
Given this complex backdrop, obesity among Turkish women cannot be attributed to isolated behavioral choices alone. Instead, it reflects a convergence of structural, cultural, and individual-level influences. This study addresses the research gap by using data from the nationally representative 2017 Turkish Nutrition and Health Survey (TNHS) to examine the association between socioeconomic and behavioral factors and BMI categories among women. By applying a Generalized Ordered Logit Model, the analysis captures heterogeneity across BMI outcomes and accounts for non-linear relationships between determinants and obesity status. This approach offers a more comprehensive understanding of the pathways through which SES and lifestyle interact—providing new empirical evidence to inform culturally sensitive, gender-aware public health interventions in Turkiye.
Methods
Data
This study is a cross-sectional, observational, and quantitative analysis based on secondary data from the 2017 Turkish Nutrition and Health Survey (TNHS), a nationally representative dataset collected by the Turkish Ministry of Health. The survey includes detailed information on individuals’ socioeconomic characteristics, lifestyle behaviors, and health indicators. The survey employed robust survey methods, including a representative sample, standardized questionnaires, and rigorous data collection protocols. The survey included a representative sample of the Turkish population across different age groups and geographical regions. The multistage cluster sampling technique was used to select the study participants. The sampling strategy aimed to ensure that the sample accurately represented the overall population. More than 12,000 participants from all over Turkiye participated in the survey. Also, sampling weights provided by the TNHS were applied in all analyses to account for the complex survey design, including stratification and clustering. This ensures that our estimates accurately represent the population of Turkish women. For the purposes of this analysis, only female participants aged between 18 and 85 years were included to ensure the reliability and comparability of the results. After applying the exclusion criteria, the final analytical sample consisted of approximately 6900 women aged 18 to 85 years. No separate a priori sample size or power calculation was conducted, as the study relied on a pre-existing nationally representative dataset with a sufficiently large sample to ensure adequate statistical power for multivariate analyses.
The TNHS questionnaire included sections on demographic information, socioeconomic status, dietary intake, physical activity levels, health behaviors, and health outcomes. The questions were carefully designed to capture relevant information related to the study objectives and were based on established measures and indicators commonly used in nutrition and health research. Additionally, anthropometric measurements, such as height, weight, and waist circumference, were taken to assess body composition and obesity prevalence. Blood samples were also collected to analyze biochemical markers related to nutrition and health.
Statistical Analysis
Discrete choice models are often preferred in studies26 -29 that analyze the relationships between obesity and socioeconomic variables. In this context, in accordance with the literature, estimation will be made with logit/probit models and ordered logit or ordered probit models. In this study, the generalized ordered method will be used to detect individual heterogeneity. The Generalized Ordered Logit Model is chosen due to its ability to capture heterogeneity across BMI categories, unlike simpler multinomial logit or probit models. This approach allows us to identify varying relationships between predictors and different BMI categories, offering greater flexibility and insight into the determinants of obesity.
Moreover, this study prefers the Generalized Ordered Logit (GOL) Model over the Ordinal Logit Model because the parallel regression (proportional odds) assumption—a key requirement of the Ordinal Logit Model—does not hold for all independent variables. The assumption was formally evaluated, and the detailed diagnostic results are presented in Supplemental Appendix A1. The findings indicate that the relationship between certain explanatory variables and the dependent variable (BMI category) varies across obesity thresholds, thereby violating the proportionality condition.
The analysis follows a partial proportional odds specification, which permits variables that violate the proportional odds assumption to vary across outcome thresholds while constraining others that meet the assumption to remain constant. In the final model, age and marital status (never married) were identified as non-proportional variables, whereas employment status, marital status (widowed), education, walking, and night snacking satisfied the proportional odds assumption and were treated as constrained. This flexible modeling structure allows the GOL framework to accommodate differential effects across BMI categories while preserving parsimony and interpretability. Consequently, the model captures the heterogeneous influence of socioeconomic and behavioral factors on obesity outcomes more accurately than the conventional ordered logit approach.23,29,30
Results
Descriptive Statistics
Approximately 12 553 individuals (aged 15 and above) participated in the nationwide survey conducted across Turkiye. For the purposes of this study, in order to obtain accurate and reliable results, data was specifically utilized from participants aged over 18 and fewer than 85. As a result of this age restriction, the gender distribution among the survey respondents was 45% male (5637 individuals) and 55% female (6916 individuals).
The age variable for women was compiled as a continuous variable in the survey form, and it is also treated as a continuous variable, as defined as the first variable in Table 1.
Descriptive Statistics of Women (Ages 18-85).

In order to accurately evaluate the age distribution of the women participating in the survey, the “Age” variable is presented categorically in the table.
In the survey form, under the “marital status” variable, participants were provided with options such as never married, married, widowed, divorced, and lives separately. Divorced and lives separately were evaluated in the same category and the marital status variable was defined as 4 categories. As shown as the second variable in Table 1, approximately 13% of the female respondents (904 individuals) were never married; while around 70% (4845 individuals) were classified as married. The number of women in the widowed category is 916 (13.2%), while there are 251 women (3.75%) in the divorced and lives separately categories.
The educational statuses of the participants were categorized into 4 groups as the third variable in Table 1. The first group included those who were illiterate or literate without a diploma. The second group comprised individuals who had completed primary school, elementary school, or middle school. High school and equivalent school graduates were placed in the third group, while the fourth group consisted of those who had completed higher education, including undergraduate, graduate, and postgraduate degrees.
The employment status variable, which was examined in detail in the survey, has been simplified into 2 groups as the fourth variable in Table 1. The “Not participating in the workforce” (nonworking) group includes housewives and retirees, while the “Participating in the workforce” (working) group comprises civil servants, workers, students, and those seeking employment (unemployed). The purpose of this categorization is to classify women based on their participation in socioeconomic life. It is assumed that housewives and retirees are less likely to participate in socioeconomic activities. As shown in the fourth variable in Table 1, a significant proportion of the women surveyed, about 74% (5143 individuals), fall into the non-working group. In contrast, the percentage of women in the workforce was approximately 26% (1773 individuals).
In alignment with the study’s objectives, the BMI of each participant was calculated. The survey form included measurements of the participants’ height (in centimeters) and weight (in grams), recorded by the pollsters. Using this information, the BMI for each participant was calculated following the World Health Organization’s (WHO) calculation method in equation (1):

Based on the calculated BMI values, the weight statuses of the women’s were categorized. In accordance with the criteria set by the World Health Organization (WHO), the women’s weight statuses were divided into 3 categories (details provided in Table 2; The underweight category (BMI < 18.5) was not taken into account in the study because it represented a small proportion of the sample (approximately 3%)).
Weight Status of Women.

Using the criteria outlined in the second column of Table 2, the calculations generated the results presented in the third column of Table 2. Accordingly, approximately 26% of the women participants (1834 individuals) fell into the “Normal” category. Around 29% of the women (1988 individuals) were classified as overweight, while approximately 45% (3094 individuals) were categorized as obese.
The survey participants were asked extensive questions under the “Physical Activity Status” section of the questionnaire. To align with the study’s objectives and assess the participants’ level of physical activity, the question “On average, how many minutes do you walk from one place to another in a day for a week?” was used as the “Walk” variable in the analysis. This variable was treated as a continuous measure, representing the self-reported average number of minutes spent walking per day. Although the measure does not include information on walking intensity, pace, or total distance, it provides a meaningful indicator of overall physical activity and captures variation in individuals’ everyday movement patterns. A numerical summary of this variable according to the categories is presented in Figure 1.

Average daily walking time for women (minutes).
The conducted survey included detailed questions regarding the participants’ dietary habits. In line with the study’s objectives, the question “Do you snack on healthy or unhealthy foods before bed (late in the evening or at night)?” was selected for analysis. The conducted survey included detailed questions regarding the participants’ dietary habits. In line with the study’s objectives, the question “Do you snack on healthy or unhealthy foods before bed (late in the evening or at night)?” was selected for analysis. The responses were used to construct a binary variable indicating whether the participant reported engaging in late-night snacking behavior. Although this measure does not capture the frequency, portion size, or caloric content of the snacks consumed, it provides a useful behavioral indicator of late-night eating patterns. The binary specification reflects the design of the national survey and ensures comparability across respondents. The responses provided by the female participants to this question according to the categories are presented in Figure 2.

Women’s night snacking habits.
Findings
The statistical and econometric analyses related to the study were conducted using STATA 13. Before commencing the econometric analysis, it is important to note that each observation in the TNHS represents an individual drawn from a multistage, cluster-based sampling framework designed to yield nationally representative estimates of the Turkish population. Each respondent is assigned an adjusted sampling weight that corrects for unequal selection probabilities and potential nonresponse bias. The empirical analysis explicitly incorporated the survey’s complex design features, including probability weights and household-level clustering, to obtain design-consistent parameter estimates and variance-adjusted standard errors. Treating households as primary sampling units (PSUs) corrects for intra-cluster correlation and ensures that the resulting inferences appropriately reflect the survey’s hierarchical sampling structure. This approach enhances the external validity of the findings and ensures that the reported estimates are representative of the national population while remaining robust to potential biases arising from the sampling design. The variables used in the study and their definitions are shown in Table 3.
The Variables Used in the Study.

The econometric analysis of the study was conducted using the Generalized Ordered Logit Model. The “BMI category” variable in Table 3 was used as the dependent variable in the Generalized Ordered Logit Model. Before performing the Generalized Ordered Logit Model, collinearity diagnostics were conducted to assess whether correlations among explanatory variables could bias the estimates. An auxiliary ordinary least squares (OLS) regression was carried out, using Body Mass Index (BMI) as the dependent variable and all predictors from the ordered logit model as independent variables. The resulting Variance Inflation Factors (VIFs) ranged from 1.03 to 1.87, with a mean VIF of 1.36, which is well below the conventional threshold of 5. These results indicate that multicollinearity was not a concern and did not influence the statistical significance of the estimated coefficients.
The Generalized Ordered Logit Model was run in 2 separate models. In the first model, the “Walk” variable, listed in Table 3, was excluded because not all participants responded the question about the “walk” variable. In the second model, the “Walk” variable was included in the estimation. However, the number of observations decreased by approximately 1400 participants, as those who did not respond to the “Walk” question was excluded from the model.
The results of Model 1, which was run without the “Walk” variable, are presented in Table 4. In the regression model, the “Obese” category, which is the third category in the “BMI Category” variable, was chosen as the base group. The “Obese” category was selected as the base group because it represents the group with the highest proportion of participants in the survey (44.74%).
Generalized Ordered Logit Estimates (Model 1).
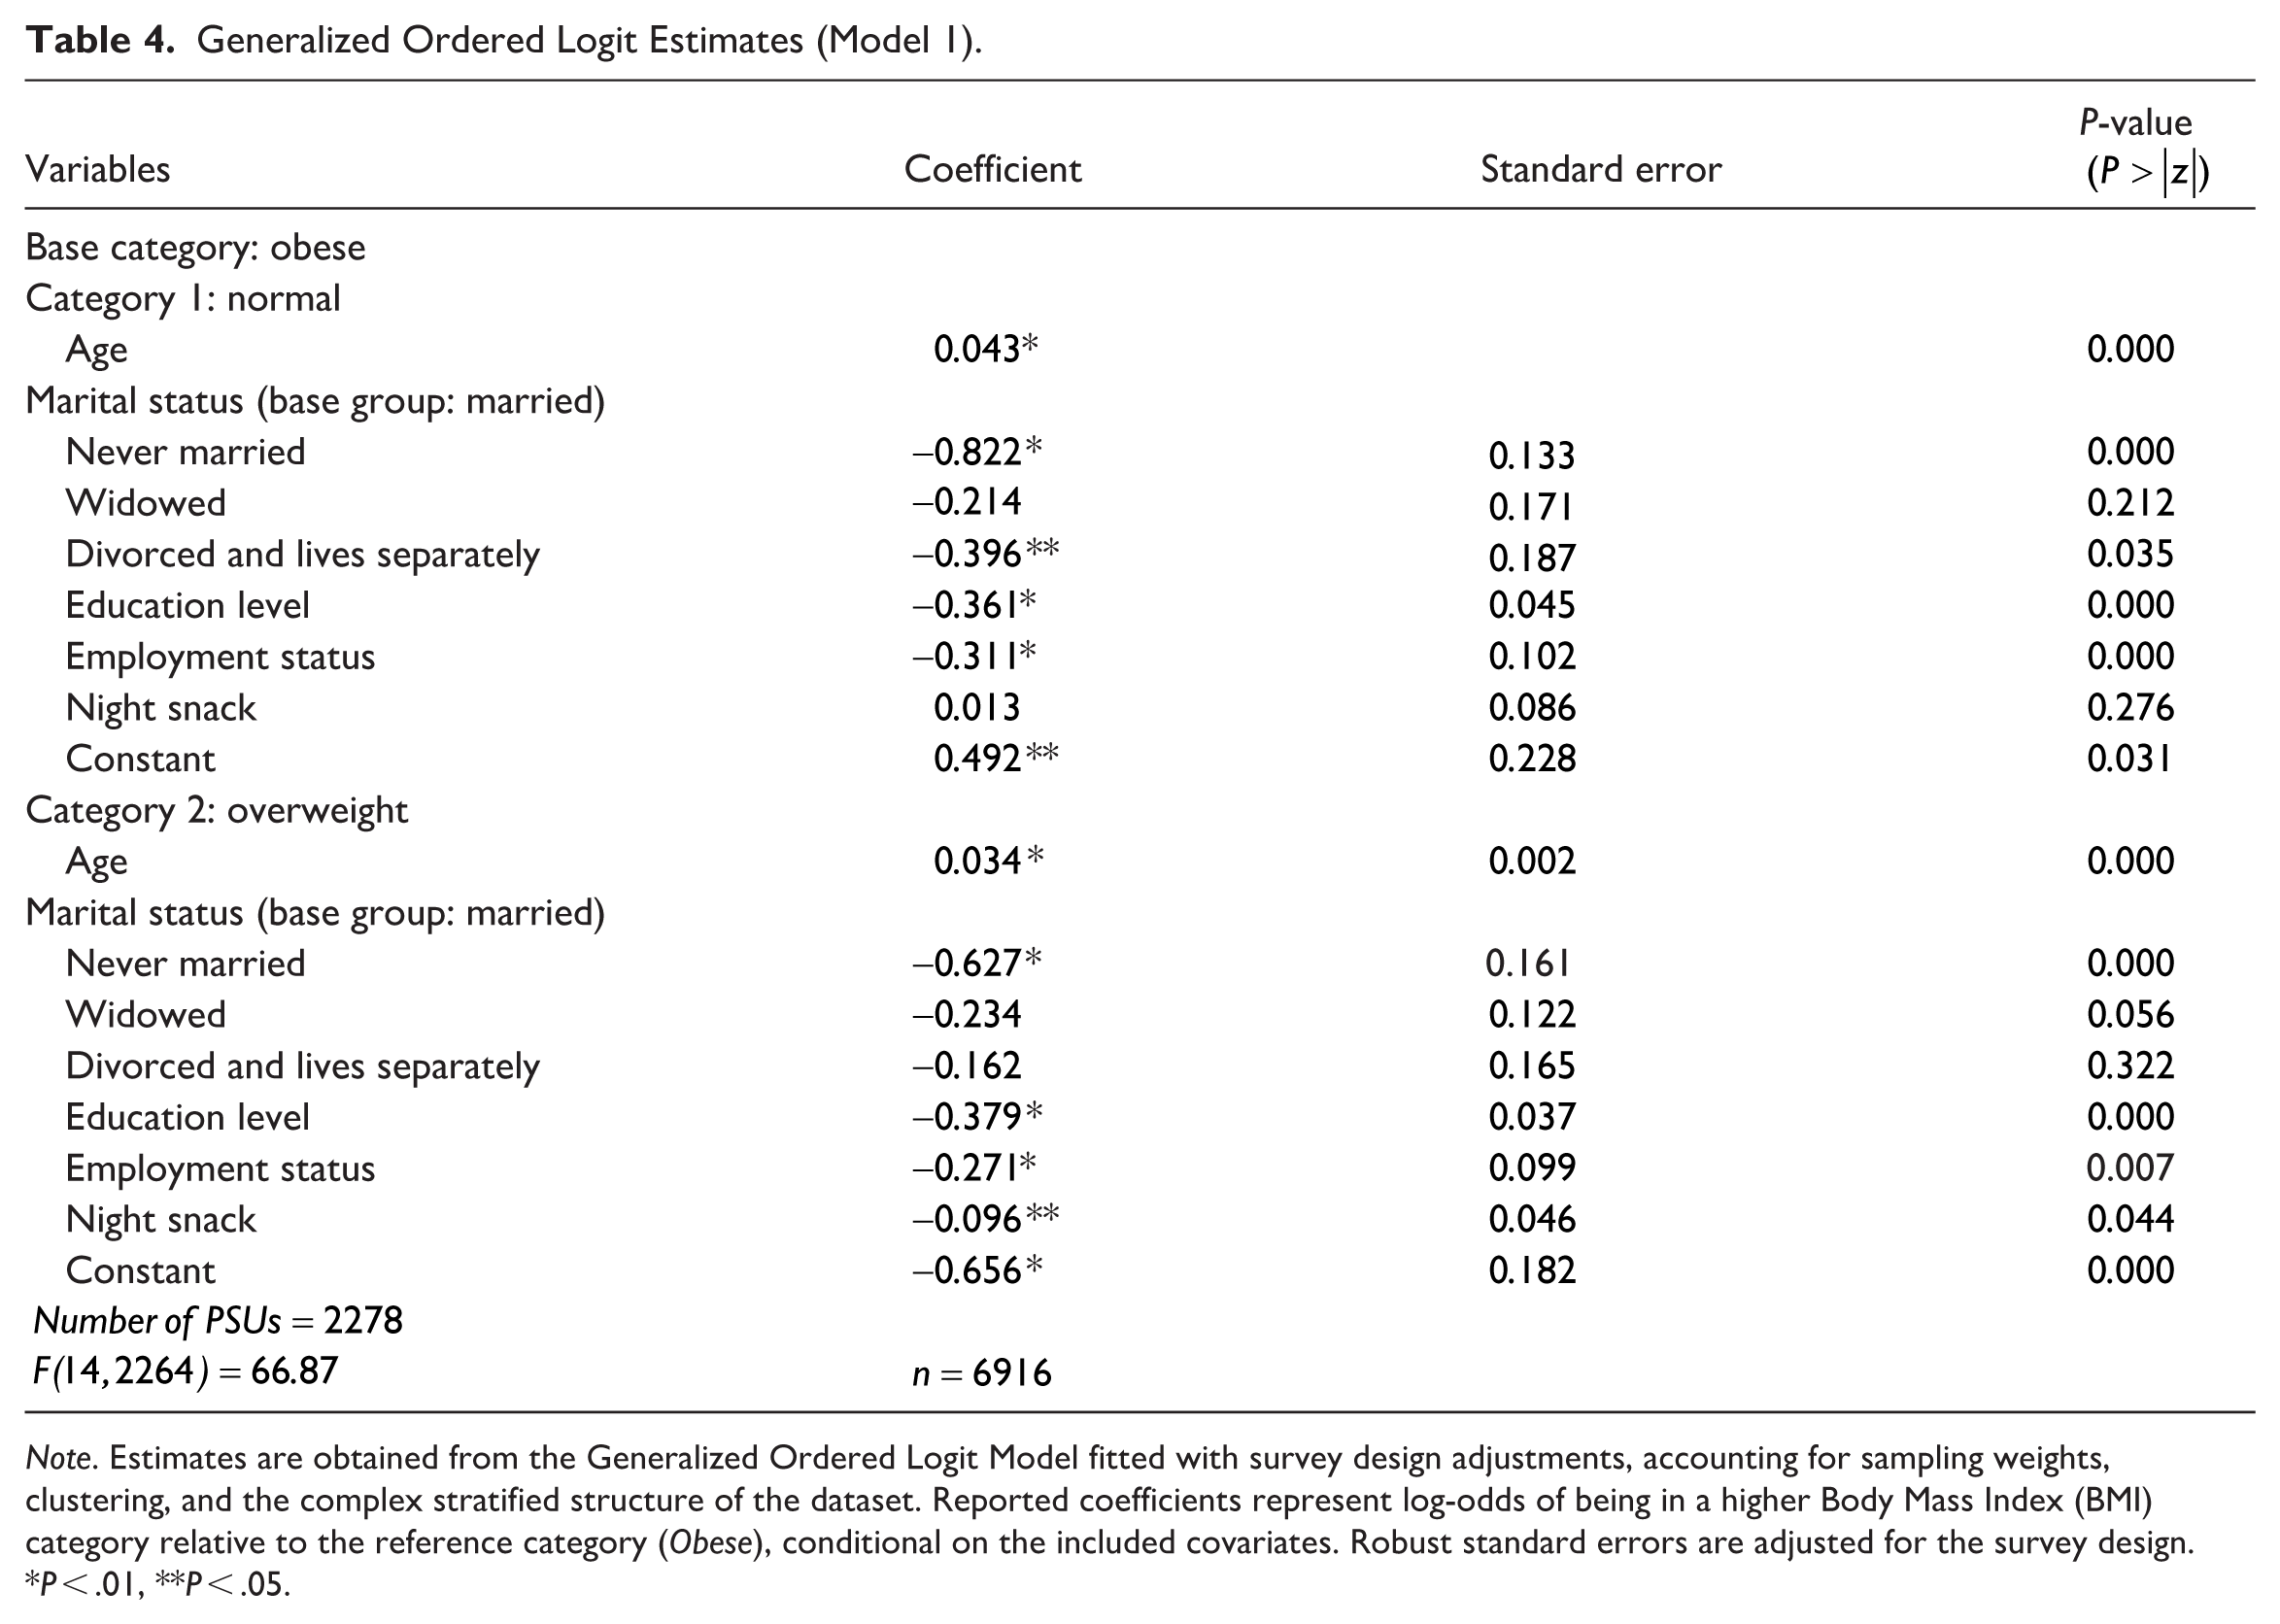
Note. Estimates are obtained from the Generalized Ordered Logit Model fitted with survey design adjustments, accounting for sampling weights, clustering, and the complex stratified structure of the dataset. Reported coefficients represent log-odds of being in a higher Body Mass Index (BMI) category relative to the reference category (Obese), conditional on the included covariates. Robust standard errors are adjusted for the survey design.
P < .01, **P < .05.
In Table 4, the second variable examined under the “Normal” category is “Marital Status.” Within this variable, the “Married” category was selected as the base group. The estimated coefficients for the “Never married,” “Widowed,” and “Divorced and lives separately” categories are negative. While the coefficients for the “Never married” category and the “Divorced or lived separately” category are statistically significant at the 1% and 5% levels, respectively, the coefficient for the “Widowed” category is statistically insignificant.
In Table 4, the third and fourth variables analyzed under the “Normal” category are the “Education Level” and “Employment status” variables. The estimated coefficients for these variables are negative and both of them are statistically significant. The final variable analyzed under the “Normal” category is the “Night Snack” in Table 4. The estimated coefficient for the “Night Snack” variable is positive, and the estimated coefficient is statistically insignificant.
In the second part of Table 4, the estimated coefficients for the likelihood of being categorized as “Overweight” compared to the base category of “Obese” are presented. The first variable analyzed under the “Overweight” category is the “Age” variable. The sign of the estimated coefficient for the “Age” variable is positive, and also statistically significant. The second variable analyzed under the “Overweight” category is “Marital Status.” The sign of the estimated coefficients for the “Marital Status” categories are negative. However, results are statistically insignificant except for the coefficient of the “Never married” at the 1% level.
In Table 4, the third and fourth variables examined under the “Overweight” category are the “Education Level” and “Employment Status” variables. The estimated coefficients for the both of them are negative and statistically significant. The final variable analyzed under the “Overweight” category is the “Night Snack” in Table 4. The estimated coefficient for the “Night Snack” variable is negative and statistically significant at the 5% level.
The results of Model 2, which includes the “Walk” variable, are presented in Table 5. As in Model 1, the “Obese” category, the third category of the “BMI Category” variable, has been selected as the base group in the regression model.
Generalized Ordered Logit Estimates (Model 2).

P < .01, **P < .05.
In the first part of Table 5, the estimated coefficients for the probability of belonging to the “Normal” category compared to the base “Obese” category are provided. The signs and the significance levels of the variables “Age,” “Marital Status” categories, “Educational Level,” and “Employment Status” are the same as in the first model. Another variable examined under the “Normal” category in Table 5 is “Night Snack.” The sign of the estimated coefficient for the “Night Snack” variable is positive; however, this result is not statistically significant. The final variable added to the model for the “Normal” category is “Walk.” The coefficient for the “Walk” variable is positive, and the result is statistically significant at the 5% level.
In the second part of Table 5, the coefficients estimated for the probabilities of being categorized as “Overweight” versus “Obese” are presented. The signs and statistical significances of the variables “Age,” “Marital status” categories, “Educational level,” and “Employment Status,” are consistent with the first model. However, in the second model, only the statistical significance of the variables “Widowed” and “Divorced or lived separately” changed. The coefficient of the “Night snack” variable is positive and statistically insignificant. The final variable added to the model in Table 5 is “Walk.” The coefficient for “Walk” is positive, and this result is statistically significant at the 5% level.
Table 6 reports the average marginal effects (AMEs) derived from Model 2, which includes “Walk” variable, as the results are nearly identical to those in Model 1. The AMEs provide a clearer interpretation of the estimated effects shown in Tables 4 and 5. With the “Obese” group serving as the reference category, the results for the “Overweight” category reveal that most explanatory variables are statistically insignificant, suggesting that the transition from overweight to obesity is less systematically associated with the socioeconomic and behavioral characteristics examined.
Average Marginal Effects (Model 2).

Note. Survey-adjusted generalized ordered logit estimates. 95% confidence intervals in parentheses.
P < .01, **P < .05, *P < .10.
The marginal effect of age indicates that, on average, each additional year of age decreases the probability of being in the “Normal” category by approximately 0.6% points. As expected, the probability of being classified as the obese category increases with age by 0.6% points. In other words, as the numerical value of the “Age” variable increases, the likelihood of being in the “Normal” category decreases when compared to the “Obese” category. This result is consistent with economic reasoning, as the average person’s metabolism and daily physical activity tend to slow down with age, leading to an increase in BMI. Furthermore, this result is statistically significant.
The marginal effect of marital status indicates that, relative to married women, those who have never married are 15.4% points more likely to be in the “Normal” category. Compared to married women, being widowed has no statistically significant association with the probability of being in the “Normal” category, whereas women who live separately from their spouses are about 7.4% points more likely to have normal weight. In the obese category, never-married women are 11.4% points less likely to be obese compared with married women.
Higher education has a significant protective effect: as education level increases, the probability of being classified as the “Normal” category increases by 6% points, while the probability of being classified as the obese category decreases by approximately 7.4% points. Similar results can be seen in the “employment status” variable. Participation in working life increases the probability of being included in the “Normal” category by approximately 4.6% points, while it decreases the probability of being included in the obese category by approximately 5.4% points. This result aligns with economic logic. Women’s increased participation in socioeconomic life not only encourages them to pay more attention to their physical appearance but also increases their daily physical activity.
When “Night snack” and “Walk” variables were added to the models, the estimated coefficients and significance levels of other explanatory variables—such as age, marital status, education, and employment—remained virtually unchanged, indicating that these variables do not substantially mediate the observed relationships between socioeconomic factors and body weight for all BMI categories. The variable capturing “Night snack” behavior shows that the probability of being included in the “Normal” category decreases by approximately 8% points, and just only this coefficient is statistically significant. Although the sign of the coefficients of the variables are consistent with the expectation that “Night snack” may contribute to excess weight and “Walk” may contribute to lose weight, the lack of statistical significance suggests that, within this sample, “Night snack” and “Walk” do not exert a measurable independent effect on BMI categories once other socioeconomic and behavioral factors are controlled for.
Discussion
The most striking finding in the descriptive statistics of this study is undoubtedly the high rate of obesity among Turkish women. When the report of the TNHS data set used is examined, it will be seen that an interesting piece of information is shared. On page 62 of the report, the following information is shared regarding the BMI categories of the women who participated in the survey
31
:
Among females, 2.1% of those in the age group of 15 years and over were underweight, 31.2% were of normal weight, 27.6% were overweight, 32.7% were obese, and 6.4% were morbid obese. 2.1% of females in the age group of 19 years and over were underweight, 26.0% were of normal weight, 29.2% were overweight, 35.6% were obese, and 7.0% were morbid obese. 2.3% of females in the age group of 19-64 years were underweight, 30.0% were of normal weight, 28.5% were overweight, 33.1% were obese, and 6.2% were morbid obese. 1.0% of females in the age group of 65 years and over were underweight, 9.6% were of normal weight, 28.2% were overweight, 50.1% were obese, and 11.0% were morbid obese.
The obesity frequency varies significantly according to the selected age group in the same data set. Since the age range of women in this study was selected as 18 to 85, the obesity rate may have been high.
Moreover, when other studies analyzing the relationship between women’s obesity and socioeconomic variables in Turkiye are examined, it will be seen that the data sets used in the studies and the BMI values calculated based on these data sets show significant differences. For example, Selçuk et al 23 used the data from the Turkey Health Survey conducted by the Turkish Statistical Institute (TSI) in his study and found the women’s obesity rate to be 27.44%. In addition, Pekkurnaz 22 used the data set from the Turkey and Demographic Health Survey conducted by Hacettepe University calculated the women obesity rate as 32%. One reason for the calculation of different obesity rates in this study and other studies in the literature may be the differences in the way the heights and weights of the participants were recorded in surveys. While the declarations of the participants were considered as the basis in the studies conducted by TSI, the measurements were made by pollsters in the studies conducted by Hacettepe University and the Ministry of Health.
Another reason for the differences in obesity rates may be the age limits taken into account in the studies. As can be understood from the information shared in the TNHS report, women’s BMI values vary very quickly depending on age changes. In this context, Selçuk et al 23 calculated the obesity rate of all women aged 15 and over in his study; Pekkurnaz 22 used the obesity rate in women aged 18 and over.
Although the women obesity rates show significant differences in studies conducted in Turkiye, the impacts of socioeconomic factors affecting women obesity are almost the same. The findings indicate that higher education levels are associated with lower obesity rates among Turkish women. This suggests that incorporating health education into school curriculums could help instill healthy lifestyle habits at an early age. Furthermore, employment was found to be a protective factor against obesity, highlighting the need for policies that improve women’s access to the labor market, such as flexible work hours and childcare support. As in other studies, the probability of being obese increases as the age level increases in this study. This highlights the need for age-specific public health strategies, such as targeted nutritional counseling and physical activity programs for older populations, to mitigate the risks associated with obesity.
Moreover, marital status also emerges as an important determinant of obesity outcomes among Turkish women. Women who are never married, widowed, or divorced are more likely to have a normal BMI than married women, while the association with the overweight category is positive but statistically insignificant. These findings align with existing literature suggesting that marriage is linked to higher obesity risk due to lifestyle changes, reduced physical activity, and increased caloric intake. Additionally, childbearing contributes to long-term weight retention among married women. Conversely, unmarried women may maintain more active lifestyles and place greater emphasis on personal health. A systematic review found that married individuals have a 70% higher risk of obesity than unmarried individuals. 32 Social and cultural norms also shape these associations, influencing dietary habits and exercise patterns. The observed associations between marital status and BMI categories underscore the importance of considering marital status in obesity research and interventions. Recognizing the nuanced impacts of different marital statuses can aid in developing targeted strategies to address obesity risk among women.
In this study, it was concluded that, unlike the literature, the effect of walking was insignificant and the relationship between night snacking and BMI was weak. On the other hand, in line with expectations, Selçuk et al 23 concluded that healthy nutrition and physical activity had a positive effect on BMI values. In this study, one possible reason why night snacking and daily walking did not significantly affect BMI values, contrary to expectations, might have been that the variables in the dataset failed to accurately capture healthy nutrition and physical activity. Secondly, assuming that the variables are sufficient, there is no difference in women’s nutrition or physical activity preferences.
It is widely acknowledged that the most effective approach to combating obesity involves integrating a balanced diet and regular physical activity into daily life. Furthermore, researches33 -35 have demonstrated significant progress in addressing obesity and promoting weight loss through the implementation of physical activity interventions combined with structured nutritional guidance. In addition, some studies36 -38 have demonstrated that even in the absence of nutritional guidance, physical activity alone has been effective in achieving favorable outcomes in addressing obesity.
However, the findings of this study suggest that physical activity, specifically walking, and behavioral factors, such as night snacking, do not have a significant effect on BMI categories among Turkish women. This may indicate that broader cultural and societal factors mediate these behaviors, thereby diminishing their impact on obesity. For example, walking in the Turkish context may lack the necessary intensity or consistency to produce measurable effects on weight outcomes. Similarly, night snacking may be closely linked to broader cultural eating practices, such as the consumption of substantial evening meals, which could obscure its independent association with BMI. These findings underline the multidimensional nature of obesity determinants and emphasize the importance of culturally specific interventions that address these complex behavioral and societal influences.
Limitations
Although missing data can introduce bias into empirical analyses, this study addressed the issue using multiple imputation by chained equations rather than single regression-based imputation. This approach generates several plausible datasets by estimating missing values through predictive models that exploit observed relationships among variables. The results from these datasets were then combined using Rubin’s rules, which appropriately account for both within- and between-imputation variability, thereby producing more reliable standard errors and confidence intervals. To verify robustness, estimates from the multiply imputed data were compared with those from the original dataset, and no substantial differences were observed. These procedures ensure that the study’s conclusions are not artifacts of missing data. A detailed description of the imputation process and diagnostic checks is provided in Supplemental Appendix A2.
Since this study primarily focuses on socioeconomic factors, it does not explore behavioral and psychological determinants of obesity, such as cultural norms around weight and beauty standards, emotional eating, or stress-related weight gain. Although these factors are acknowledged in the introduction, our dataset does not include direct variables related to psychological well-being or weight perception. Future research should integrate comprehensive datasets that capture behavioral and psychological factors to provide a more holistic understanding of obesity outcomes. Additionally, qualitative research methods, such as in-depth interviews and focus groups, could offer valuable insights into how mental health, societal expectations, and stress-related eating behaviors interact with socioeconomic determinants of obesity.
Another challenge in this study is the potential endogeneity arising from omitted variables, such as residential area (urban/rural, or region) and income level. The absence of these variables in the dataset could introduce bias, as they may influence both the independent variables and BMI outcomes. Despite this limitation, the inclusion of a broad set of socioeconomic and behavioral factors supported by the literature mitigates the risk of significant bias. It should also be noted that regional and urban–rural identifiers are not available in the publicly accessible version of the 2017 TNHS dataset due to confidentiality restrictions, which prevents their inclusion in the analysis.
In addition, the study relies on data from the 2017 Turkish Nutrition and Health Survey (TNHS), which represents the most recent nationally representative micro-level dataset available in Turkey containing detailed individual information on nutrition, lifestyle, and socioeconomic status. Although more recent aggregate obesity statistics 9 have been released by the Turkish Statistical Institute, these data do not provide the individual-level variables required for multivariate analysis. Consequently, the TNHS 2017 remains the only appropriate dataset for examining the socioeconomic and lifestyle determinants of obesity among Turkish women. Nevertheless, the time lag between data collection and publication should be acknowledged as a limitation, as it may affect the immediate policy relevance of the findings.
Finally, the cross-sectional design of this study limits the interpretation of results to associations rather than causal relationships. The observed correlations between socioeconomic, behavioral, and psychological factors and obesity outcomes should not be interpreted as evidence of causality. Longitudinal or panel data would be required to establish causal pathways and to observe temporal changes in obesity risk. Nevertheless, identifying these associations provides valuable guidance for policy discussions and highlights priority areas for further research.
Conclusion
Despite sustained national initiatives to promote healthy nutrition, obesity among Turkish women remains persistently high. Using nationally representative data, this study reveals that education and employment significantly reduce obesity risk, whereas behavioral factors such as night snacking and walking exert limited influence. This suggests that unhealthy habits may be culturally normalized across social strata rather than solely shaped by material conditions. While the analysis provides valuable insights, its cross-sectional design and limited behavioral measures preclude causal inference, and the absence of regional and income variables remains a limitation. Future research should integrate longitudinal and mixed-method approaches to explore the interaction between socioeconomic, cultural, and gendered dimensions of obesity. Policy efforts should move beyond uniform interventions, focusing instead on culturally grounded, gender-sensitive strategies that address both structural inequalities and deeply embedded lifestyle norms influencing women’s health in Turkiye.
Supplemental Material
sj-pdf-1-inq-10.1177_00469580251398379 – Supplemental material for Socioeconomic and Lifestyle Determinants of Obesity Among Turkish Women: Evidence From a Cross-Sectional Study
Supplemental material, sj-pdf-1-inq-10.1177_00469580251398379 for Socioeconomic and Lifestyle Determinants of Obesity Among Turkish Women: Evidence From a Cross-Sectional Study by Sayin San and Nurbanu Beyenal in INQUIRY: The Journal of Health Care Organization, Provision, and Financing
Supplemental Material
sj-pdf-2-inq-10.1177_00469580251398379 – Supplemental material for Socioeconomic and Lifestyle Determinants of Obesity Among Turkish Women: Evidence From a Cross-Sectional Study
Supplemental material, sj-pdf-2-inq-10.1177_00469580251398379 for Socioeconomic and Lifestyle Determinants of Obesity Among Turkish Women: Evidence From a Cross-Sectional Study by Sayin San and Nurbanu Beyenal in INQUIRY: The Journal of Health Care Organization, Provision, and Financing
Footnotes
Ethical Considerations
This study is based on secondary data obtained from the Turkish Ministry of Health as part of the 2017 Turkish Nutrition and Health Survey (TNHS). The Turkish Ministry of Health received ethical approval from the Clinical Research Ethics Committee of Zekai Tahir Burak Women’s Health and Research Hospital, Ministry of Health, Republic of Turkey (2011-KAEK-19) to conduct this survey in 2017.
Contest to Participate
An Informed Consent Form was obtained from the individuals who participated in the survey by the Turkish Ministry of Health. However, neither the Patient Rights Regulation (1998) nor the Scientific Research and Publication Ethics Directive (2016) issued by the Council of Higher Education require ethical approval for studies utilizing secondary data. This study was conducted in full accordance with the Declaration of Helsinki.
Consent for Publication
Since this study utilized secondary data from the 2017 Turkish Nutrition and Health Survey (TNHS), all personally identifiable information was removed prior to data access. Therefore, obtaining informed consent from individual participants was not applicable. According to the Patient Rights Regulation (1998) and the Scientific Research and Publication Ethics Directive (2016) issued by the Council of Higher Education, studies using anonymized secondary datasets do not require explicit informed consent.
Author Contributions
All authors contributed to the study conception and design. Material preparation, data collection and analysis were performed by Sayin San, and Nurbanu Beyenal. The first draft of the manuscript was written by Sayin San and all authors commented on previous versions of the manuscript. All authors read and approved the final manuscript.
Funding
The authors disclosed receipt of the following financial support for the research, authorship, and/or publication of this article: Open access funding provided by Sakarya University.
Declaration of Conflicting Interests
The authors declared no potential conflicts of interest with respect to the research, authorship, and/or publication of this article.
Data Availability Statement
The data that support the findings of this study are available from the Turkish Ministry of Health, but restrictions apply to the availability of these data, which were used under license for the current study and so are not publicly available. The data are, however, available from the Turkish Ministry of Health.
Supplemental Material
Supplemental material for this article is available online.
References
Supplementary Material
Please find the following supplemental material available below.
For Open Access articles published under a Creative Commons License, all supplemental material carries the same license as the article it is associated with.
For non-Open Access articles published, all supplemental material carries a non-exclusive license, and permission requests for re-use of supplemental material or any part of supplemental material shall be sent directly to the copyright owner as specified in the copyright notice associated with the article.