
Abstract
Patient satisfaction is a key indicator of healthcare quality, influencing patient adherence, health outcomes, and service utilization. This study evaluated patient-satisfaction in outpatient maternity and child hospitals, considering demographic factors such as age, gender, and regional differences. Findings were compared with international healthcare systems to identify strengths and areas for improvement. A cross-sectional survey was conducted using a validated electronic questionnaire distributed to patients attending outpatient maternal and child clinics. Data from 14 718 respondents were analyzed to assess satisfaction across service domains and identify demographic determinants. Statistical analyses included ANOVA, correlation, and regression to explore associations between satisfaction scores and gender, age, and regional differences. A total of 14 718 participant surveys were analyzed of which 72.8% were females. The mean age was 22.4 ± 16.5 years, with 46.4% aged ≤ 18 years, and 93.5% were Saudi nationals. The overall satisfaction score was 75.9 ± 26.4 with Pharmacy services (83.3%) and Laboratory services (82.5%) scoring highest and Moving Through (waiting times) the lowest (67.5%). Males reported higher satisfaction (77.9 ± 26.2%) compared to females (75.1 ± 26.4%; P < .0001). Elderly patients (≥65 years) had the highest satisfaction (82.6%), 13.9 points higher than young adults (P < .001). Regionally, the Central region had the highest satisfaction (80.6 ± 22.7%), outperforming the Northern region by 8.73 points (P < .001). The findings highlighted disparities in patient-satisfaction across different demographic and regional groups emphasizing the need to improve waiting times, communication, and digital services. Limitations included potential response bias and varying expectations. Future research should focus on digital transformation and policy reforms to support Vision-2030 goals and international standards.
Keywords
Previous research highlights moderate patient satisfaction in Saudi maternity outpatient care, with concerns about physician communication, long waiting times, and gender disparities. International studies emphasize the role of clear communication, reduced wait times, and patient involvement in improving satisfaction.
This study quantifies patient satisfaction in Saudi maternity outpatient care is relatively fair, revealing key issues such as poor communication, long waiting times, and gender differences in satisfaction. It underscores the need for targeted improvements, particularly in communication and efficiency.
This study quantifies patient satisfaction in Saudi maternity outpatient care is relatively fair, revealing key issues such as poor communication, long waiting times, and gender differences in satisfaction. It underscores the need for targeted improvements, particularly in communication and efficiency.
Introduction
Patient satisfaction (PS) is a key indicator of healthcare quality, reflecting patients’ experiences, expectations, and perceptions of care. 1 Globally, research has indicated variations in PS due to factors such as healthcare system structure, digital integration, and provider communication. Studies from the United Kingdom have shown that shorter waiting times and comprehensive digital health services contribute to higher PS in maternity outpatient care. 2 In Canada, integrated maternal healthcare models and midwifery services were associated with improved patient experiences. 3
Several studies have explored PS across different healthcare settings in Saudi Arabia. Munassar et al highlighted that although most patients were satisfied with outpatient and primary healthcare services. However, issues remained related to waiting times and communication with healthcare providers. 4 Similarly, Alaneazy et al found that younger patients and females reported lower satisfaction due to long appointment scheduling times and inconsistent provider-patient interactions. Another study by Daajani et al suggested that while medical infrastructure and staff competency were generally well-rated, patient engagement and responsiveness required improvement. 5
Maternal and child health is a top priority, recognizing its role in enhancing community health and well-being. 6 Results of a study conducted in maternity and children’s hospitals in Jeddah showed that 16.2% of pediatric patients left the hospital against medical advice. This was due to dissatisfaction with their medical teams, highlighting the need for targeted improvements and recommended targeted interventions to reduce discharge against medical advice rates (DAMA).7 -9 This would include improved communication and caregiver education, as DAMA was associated with significantly higher readmission rates (28.5% vs 11.5%) within 30 days.7 -9 Dissatisfaction with staff attitudes has also been a significant reason for missed appointments at antenatal care (ANC) clinics across the Kingdom.5,10 Improved patient compliance resulting from better satisfaction levels leads to improved prognoses and a reduction in medical malpractice cases. 11
A descriptive cross-sectional study conducted in Al-Ahsa assessed satisfaction with ANC services among pregnant women across government facilities, including Ministry of Health (MOH) Hospitals. The results showed an average satisfaction score of 80% with the National Guard Hospital reporting the highest satisfaction rate at 82%. However, waiting times remained a challenge, with only 45.5% of respondents expressing satisfaction, resulting in a mean score of 3.3 ± 1.4. 12 A systematic review of patient satisfaction in primary care centers (2005-2017) found that education and income levels influenced satisfaction, though discrepancies existed between survey responses and actual experiences. 13
The healthcare system is undergoing a major transformation under the Saudi Vision 2030 initiative, which prioritizes improving maternal and child healthcare by enhancing quality, accessibility, and efficiency.14,15 This initiative has driven substantial investments in infrastructure, digital health technologies, and workforce development, all aimed at achieving a more patient-centered healthcare system. While progress has been made in evaluating patient experiences and satisfaction, most existing studies focus on primary healthcare centers, leaving a gap in research on maternal and child hospitals.13,16,17
This study aims to assess PS in maternity and child outpatient hospitals across various regions of the country, with a particular focus on demographic factors such as gender, age, and regional disparities. By identifying key areas influencing PS, the study seeks to uncover best practices and provide evidence-based insights to inform policy recommendations aimed at enhancing patient experiences within the healthcare system. Notably, this study is among the first to evaluate PS in maternal and child outpatient hospitals under the MOH, offering a comprehensive analysis of demographic and regional variations to guide improvements in healthcare policy and practice.
Methodology
This study is a secondary data analysis of PS survey data collected from outpatient maternity and children’s hospitals between 1st Jan 2023 and 30th Dec 2023. The data was gathered using an electronic structured survey developed by Press Ganey, a well-established tool for assessing patient experiences.as per agreed contract. 18
Data collection was conducted by third-party organizations to ensure consistency and minimize bias. Patients were approached electronically via their registered mobile phone numbers and invited to complete the survey, which included a brief description of the study’s objectives and methodology and was made available in both Arabic and English Consent was obtained implicitly through voluntary participation. The research team received anonymized raw data from the third-party vendors, with no access to personal identifiers.
The survey was distributed across different regions of the kingdom. Saudi Arabia is divided into 5 main regions for healthcare administration: Central, Eastern, Western, Southern, and Northern. Each region varies in terms of population density, infrastructure, and healthcare accessibility. The Central region includes the capital Riyadh and is known for its advanced healthcare facilities. The Eastern region is industrially developed and includes cities like Dammam. The Western region, home to Jeddah and Makkah, serves a diverse population including pilgrims. The Southern region is more rural and mountainous, while the Northern region has dispersed populations and limited access to specialized care.
The study was approved by the Institutional Review Board Research Committee at the participating institution (IRB approval number: 25-36M), and consent was obtained implicitly from participants who agreed to complete the survey, including a statement about the study’s objectives and methodologies.
Operational definitions were applied for those under the age of 18 and for males attending appointments in women and children’s clinics. Individuals under 18 were considered pediatric or adolescent patients, and the survey was typically completed by their accompanying parent or legal guardian, as it was sent to the mobile number registered in the patient’s health record. However, in some cases, particularly among adolescents with personal mobile devices, it is possible that the patient completed the survey themselves. Male respondents were assumed to be guardians accompanying female patients or children and were included in the analysis accordingly.
Exclusion Criteria
Surveys with less than 50% of questions completed were excluded to ensure data quality and analytical validity. Incomplete responses may introduce bias and limit the reliability of domain-specific satisfaction scores and subgroup comparisons.
Survey description and statistical analysis: The survey consisted of 10 key domains: registration, moving through nursing services, physician services, laboratory services, radiology services, pharmacy services, personal issues, disability and general assessment. A total of 32 questions were included, each designed to capture different aspects of patient experience. Responses were recorded using a 5-point Likert scale, with responses converted into a 0 to 100 scale, where 0 represented “very poor” and 100 represented “very good.” This transformation facilitates clearer interpretation, enables comparison across domains, and supports standardized reporting of satisfaction scores.
Assuming a 95% confidence level and a margin of error of 5%, the calculated sample size was approximately 385 participants. To account for potential non-response, an additional 10% to 20% was recommended, bringing the target sample to about 460 respondents. Satisfaction percentages were calculated by averaging individual scores across respondents and converting them into a percentage. All continuous variables were summarized using descriptive statistics, mean and standard deviation (SD), and categorical variables were presented by number (n) and percentage (%). One-way analysis of variance (ANOVA) was performed to compare satisfaction levels by gender, age, and region. For ANOVA, normality was not formally tested as the large sample size and the robustness of ANOVA reduce sensitivity to this assumption. Homogeneity of variances was assessed and violated; therefore, Welch’s ANOVA was applied. Independence was satisfied since each observation represented a unique participant. For regression, assumptions of linearity, independence, and homoscedasticity were checked visually using residual plots, and multicollinearity was assessed using variance inflation factors; all were within acceptable limits. Tukey’s post hoc tests were conducted to determine specific between-region differences. Pearson correlation analysis was used to assess the relationships between overall satisfaction and individual domain scores. Regression analysis was performed to identify significant predictors of overall PS. All statistical analyses were conducted using SPSS version 27.0 (IBM Corp, Armonk, NY) with a significant threshold set at P < .05. This study was done in accordance with Strobe criteria. This study adhered to the CROSS (Consensus-Based Checklist for Reporting of Survey Studies) reporting guideline for survey-based research. 19 Internal consistency of the survey domains was assessed using Cronbach’s alpha, which yielded a mean of .92, indicating acceptable reliability across the included items.
Results
Patient Population
A total of 16 595 surveys were collected, of which 14 718 surveys had more than 50% completed survey and included in the analysis. Satisfaction data was collected with demographics outlined in Table 1. Gender data were available for 11 001 participants, with a majority of females (72.8%) compared to males (27.2%). Age data were available for 12 016 participants, with a mean age of 22.4 ± 16.5 years. Age distribution indicated that 46.4% of participants were 18 years or younger, 41.4% were aged 30 to 64, 11.6% were aged 19 to 29, and 0.6% were 65 years or older.
Demographic Characteristics of Survey Respondents (N = 14 718).

Regional distribution showed that the Central Region had the highest proportion of participants (33.1%), followed by the Southern (19.4%), Northern (17.8%), Western (17.6%), and Eastern (12.2%) regions. Nationality data were available for 12 477 participants.
Overall Satisfaction Scores for Various Aspects of Outpatient Services in Maternity and Child Hospitals
The overall satisfaction score across all participants was 75.9 ± 26.4, with variations observed across domains. The overall satisfaction scores for various aspects of outpatient services in maternity and child hospitals are presented in Figure 1. The highest satisfaction was observed in the Pharmacy (83.3%) followed by Laboratory (82.5%) domains. Supplemental Table 1 displays satisfaction score obtained within the subdomains.

Overall satisfaction score by domain.
Pharmacy Domain
Among the Pharmacy subdomains, the highest-rated aspect was the pharmacist’s explanation of prescriptions (68.5%), followed by the availability of prescribed medications (62.3%), with the least for the waiting time for medications (63.8%).
Laboratory Domain
The skill of the person drawing blood received the highest rating (68.0%), followed by concern for patient comfort during blood draw (65.3%), while the waiting time to get blood drawn (58.8%) was rated lower.
Nurse and Physician Domains
Similarly, Physician (78.5%) and Nurse (77.7%) interactions received high ratings (Figure 1). As shown in Supplemental Table 1, among the Physician subdomains, the highest satisfaction was with the physician’s concern for patient questions (64.3%), followed closely by the explanations given about conditions (63.5%). The physician’s effort to include patients in decision-making (62.3%) and discussion of treatment options (61.9%) scored slightly lower.
In the Nurse subdomains, the friendliness and courtesy of nurses (59.4%) received the highest score, followed by how well nurses listened to patients (58.6%) and the concern shown for patient problems (58.8%; Supplemental Table 1). Moderate satisfaction levels were found in Registration (74.0%), Personal Issues (76.9%), General Assessment (76.1%), and Disability Services (75.2%; Figure 1). Within the Registration subdomains, the ease of registration upon arrival (60.2%) was rated the highest, while ease of contacting the hospital (43.8%) scored the lowest.
Moving Through Domain
The lowest satisfaction was reported in the Moving Through category (67.5%), which includes waiting times at clinics and communication regarding delays. Among its subdomains, comfort of the waiting area (44.2%) was rated higher, whereas wait time at the clinic (43.0%) and degree to which patients were informed about delays (45.6%) had lower ratings.
Personal Issues Domain
In the Personal Issues category, concern for patient privacy (62.6%) and clinic cleanliness (62.4%) received high ratings, while availability of parking (43.9%) had 1 of the lowest satisfaction scores.
Disability Service
Among Disability Services, the ease of commuting in the facility (59.6%) received the highest score, while the clarity of signs and availability of designated disability parking (52.4%) was rated lower (Supplemental Table 1).
Patient Satisfaction Across Service Domains by Gender
Males showed higher overall satisfaction scores (77.9 ± 26.2) compared to females (75.1 ± 26.4), The comparative analysis of satisfaction across gender revealed statistically significant differences in most service domains between male and female respondents (Table 2). Males reported higher satisfaction scores than females in nearly all domains, including registration (76.9 ± 28.9 vs 74.9 ± 29.1), moving through the system (70.5 ± 32.5 vs 66.7 ± 33.0), and interactions with nurses (80.2 ± 30.5 vs 76.5 ± 32.3) and physicians (81.7 ± 30.8 vs 77.3 ± 32.8).
Mean Satisfaction Scores (±SD) Across Healthcare Service Domains by Region, Age Group, and Gender.

Radiology also showed a marked gender difference (81.2 ± 28.8 in males vs 74.7 ± 31.7 in females). Notably, the personal issues domain and general assessment also reflected higher male satisfaction (78.3 ± 26.1 vs 75.6 ± 26.4 and 77.6 ± 31.5 vs 75.2 ± 32.3, respectively).
However, satisfaction levels for the pharmacy (83.2 ± 24.5 for males and 83.2 ± 23.8 in females) and laboratory services (83.2 ± 26.4 in males and 81.9 ± 26.3 in females) showed similar satisfaction between genders. Finally, females reported significantly higher satisfaction in the disability services domain (79.7 ± 28.4 in females vs 69.7 ± 30.9 in males) as shown in Table 2.
Age Group Satisfaction With Outpatient Clinics in Maternity and Child Hospitals Across
Overall PS in the maternity and child hospital was highest in the elderly group, 82.6%. Table 2 presents with outpatient services and different domains varied significantly across age groups. The elderly group (≥65 years) reported the highest satisfaction across most domains, including registration (86.6 ± 19.5%), physician services (85.5 ± 29.6%), and general assessment (82.0 ± 27.4%). Conversely, the young adult group (19-29 years) had the lowest satisfaction scores in nearly all domains, with particularly low ratings for moving through (58.2 ± 34.4%), physician services (69.8 ± 35.8%), and general assessment (67.2 ± 35.5%).
The pediatric and adolescent group (≤18 years) had moderately high satisfaction, especially for nursing (81.4 ± 29.3%) and radiology services (82.3 ± 27.7%), but reported lower scores for disability-related services (72.8 ± 30.2%) compared to other groups. The middle-aged group (30-64 years) had intermediate satisfaction levels, generally higher than the 19 to 29 age group but lower than the elderly and pediatric groups (Table 2). Furthermore, satisfaction with pharmacy services was relatively stable across all age groups, with a slight decrease in the 19 to 29 age group. In contrast, satisfaction with moving through the hospital, physician interactions, and overall assessment was significantly lower in younger adults compared to other groups.
The post-hoc analysis of satisfaction scores across age groups revealed significant differences between most age categories (Supplemental Table 2). The ≤ 18 age group consistently reported higher satisfaction compared to both the 19 to 29 and 30 to 64 groups. It showed a 10.25-point higher mean score than the 19 to 29 group and a 3.55-point advantage over the 30 to 64 group (P < .001). However, the difference between ≤18 and ≥65 was not statistically significant (P = .241). On the other hand, the 19 to 29 age group reported the lowest satisfaction overall, scoring significantly lower than all other age groups. It was 13.90 points below the ≥65 group, 6.70 points below the 30 to 64 group, and significantly lower than the ≤18 group (P < .001). The 30 to 64 group falls in the middle, scoring higher than the 19 to 29 group but lower than the ≤18 and ≥65 groups. The difference with the ≥65 group was statistically significant (mean difference = −7.20, P = .021). Finally, the ≥65 age group showed the highest satisfaction overall, particularly when compared to the 19 to 29 and 30 to 64 age groups (Supplemental Table 2).
Overall Satisfaction With Outpatient Clinics in Maternity and Child Hospitals Across Regions
The overall satisfaction with outpatient clinics in maternity and child hospitals across regions showed relevant variation (Table 2). The highest satisfaction was reported in the Central region (80.6 ± 22.7%), followed by the Eastern (75.6 ± 25.2%), Southern (74.3 ± 28.3%), Western (73.6 ± 27.4%), and Northern regions (71.9 ± 28.9%). Among individual domains, registration satisfaction was highest in the Central region (81.1 ± 24.8%) and lowest in the Eastern region (73.1 ± 28.5%). Moving Through, which includes waiting times and communication of delays, was rated highest in the Central region (72.9 ± 30.2%), whereas the Northern region had the lowest score (63.6 ± 34.8%). Satisfaction with nursing care followed a similar pattern, with the Central region scoring the highest (83.4 ± 27.1%), while the Northern region had the lowest rating (71.0 ± 35.3%). Likewise, physician services were rated highest in the Central region (83.4 ± 28.3%) and lowest in the Northern region (71.9 ± 35.6%).
As reported in Table 2, laboratory services had the highest satisfaction in the Central region (88.0 ± 21.1%), while the Northern region had the lowest rating (77.3 ± 30.1%). Radiology services showed a more balanced distribution, with the Southern region scoring the highest (81.9 ± 28.2%) and the Western region the lowest (72.2 ± 34.1%). Satisfaction with pharmacy services was highest in the Southern region (85.2 ± 23.0%), whereas the Eastern region reported the lowest rating (80.4 ± 25.3%). Personal issues, including cleanliness, privacy, and safety, were rated highest in the Central region (79.5 ± 23.3%), while the Western region had the lowest score (74.5 ± 26.8%). General assessment, reflecting overall hospital experience, followed a similar pattern, with the Central region scoring highest (82.3 ± 27.3%), while the Northern region had the lowest satisfaction (69.6 ± 35.5%). Disability-related services also varied significantly, with the Central region reporting the highest satisfaction (79.8 ± 27.1%), while the Eastern region had the lowest rating (67.2 ± 31.0%).
Pairwise post-hoc comparisons across regions revealed notable disparities in satisfaction levels (Supplemental Table 3). The Central region consistently demonstrated the highest satisfaction scores, showing statistically significant differences when compared to all other regions. Specifically, it scored 8.73 points higher than the Northern region, 7.01 points higher than the Western region, 6.32 points more than the Southern region, and 4.95 points above the Eastern region (P < .001).
In contrast, the Northern region ranked lowest, with negative score differences compared to Central, Eastern, Southern, and Western regions. The Eastern region performed moderately, scoring significantly higher than the Northern and Western regions, but the difference with the Southern region was not statistically significant (P = .083). Meanwhile, no significant differences were observed between the Western and Southern regions (Supplemental Table 3).
Correlation Between Overall Satisfaction and Domains
The correlation analysis of overall satisfaction revealed significant insights into the factors influencing patient contentment across various domains (Table 3). The highest correlations with overall satisfaction were found in the General Assessment domain (r = .933). Other domains with strong correlations included Moving Through the System (r = .893), Nurse Interactions (r = .891), and Personal Issues (r = .890). Physician interactions (r = .849) also played a significant role. On the other hand, the Pharmacy domain had a slightly lower correlation with overall satisfaction (r = .741).
Correlation Between Overall Satisfaction and Scores of Domains and Subdomains of Highest and Least Correlated Domains.
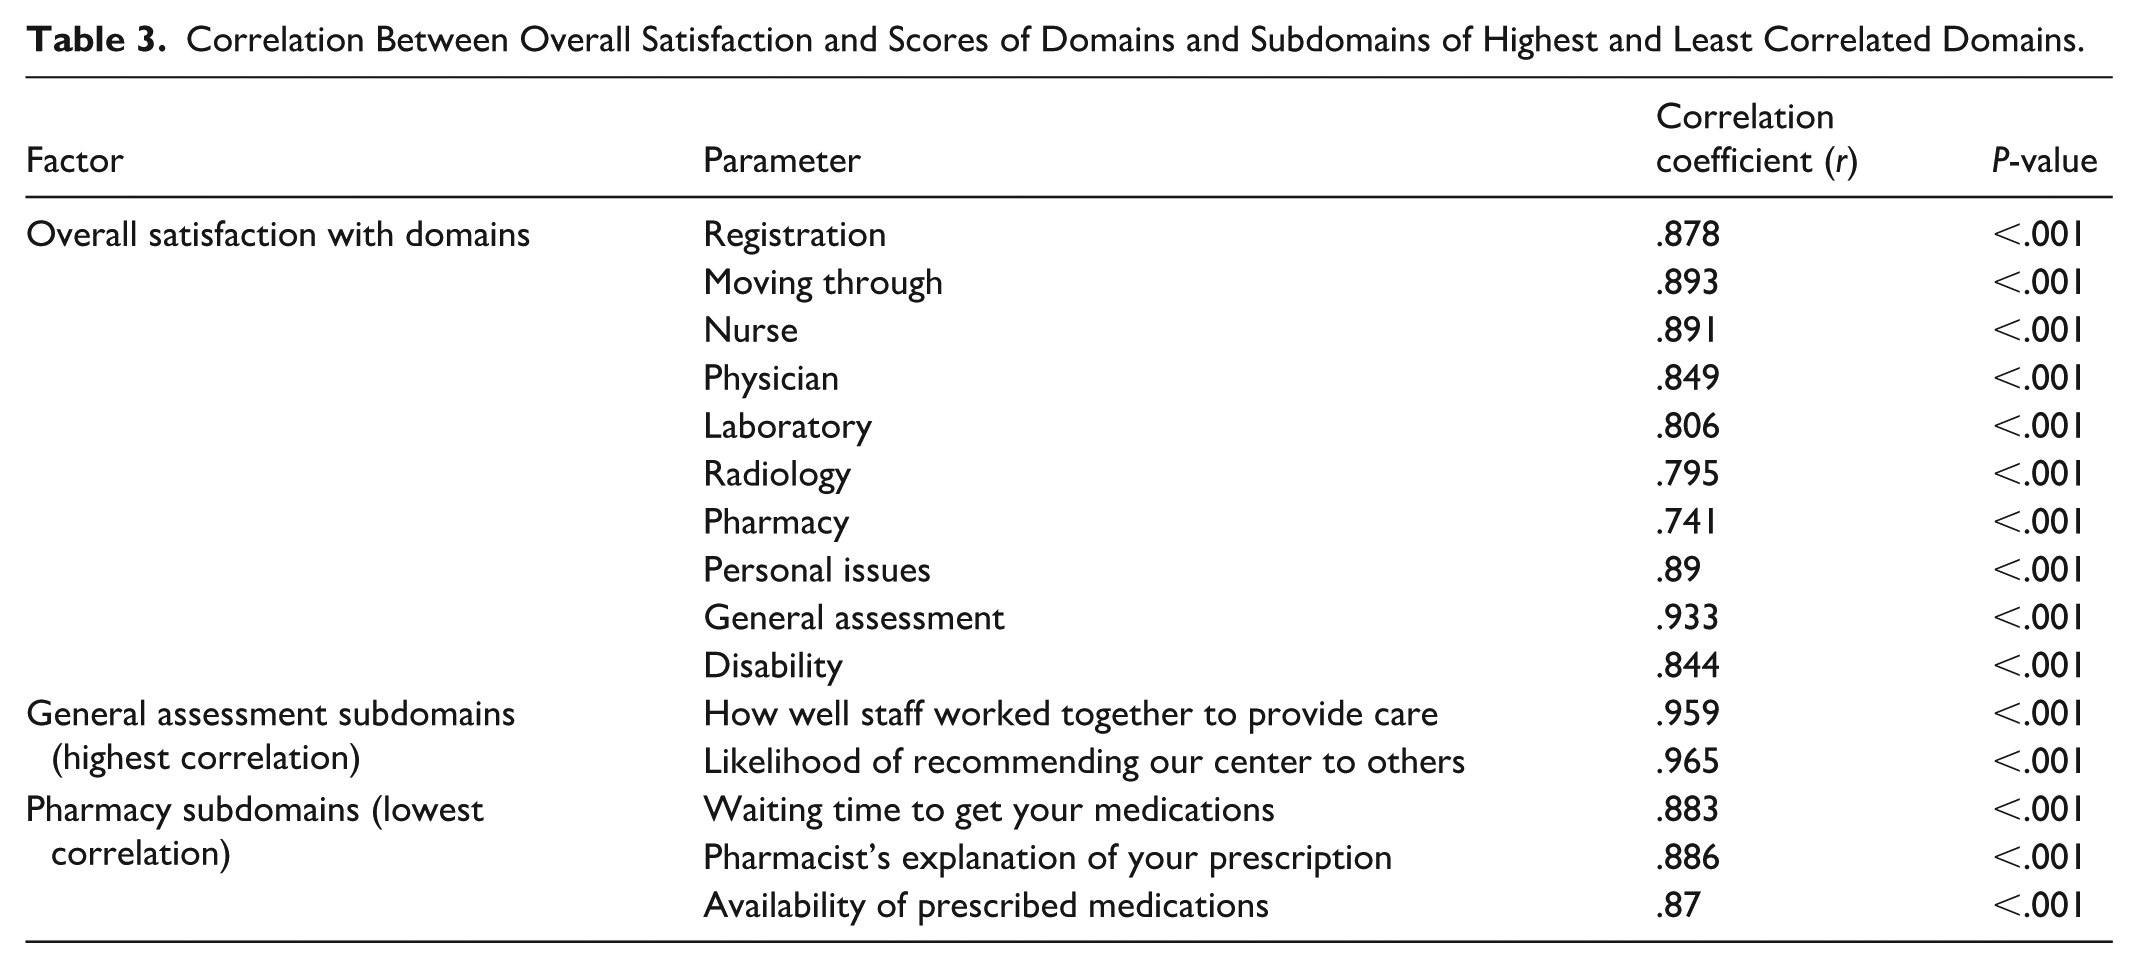
Further analysis of the General Assessment domain, it was found that 2 factors, Staff Collaboration (r = .959) and Likelihood of Recommending the Center (r = .965), were the most strongly correlated with satisfaction. Similarly, within the Pharmacy domain, factors such as Waiting Time for Medications (r = .883), Pharmacist’s Explanation of Prescriptions (r = .886), and Availability of Prescribed Medications (r = .870) were closely associated with higher satisfaction (Table 3).
Predictors of Patient Satisfaction
The subgroup analysis revealed notable disparities in overall patient satisfaction across different genders, age groups and regions in maternal and children’s hospitals (Supplemental Table 4).
The analysis of satisfaction scores by gender and age group revealed significant trends across all regions (Supplemental Table 4). Gender differences showed that, in general, males tend to report higher satisfaction levels compared to females which was consistent across all regions. In particular, males in the Central region exhibited a slightly higher satisfaction score (83.0 ± 22.4) compared to females (80.8 ± 21.9), and similar patterns emerged in the Northern and Western regions. The overall analysis for males (77.9 ± 26.2) showed consistently significant higher satisfaction than females (75.1 ± 26.4; P < .001).
Considering age groups, the data indicated that younger age groups generally reported lower satisfaction scores. The ≤ 18 age group reported lower satisfaction across most regions, particularly in the Eastern region (74.9 ± 24.3 for males and 71.2 ± 28.4 for females), where their scores were significantly lower compared to older age groups. The 19 to 29 age group also reported lower satisfaction than older age groups in several regions, but their scores were still significantly higher than the ≤18 group. Interestingly, the ≥65 age group showed higher satisfaction levels in the Central region (87.5 ± 16.4 for females; Supplemental Table 4).
Finally, significant regional differences in satisfaction were observed as shown in Supplemental Table 4. In the Central region higher satisfaction levels across genders and age groups, with females scoring 80.8 ± 21.9 and males scoring 83.0 ± 22.4 were reported. The Eastern region generally showed lower satisfaction scores, particularly among the younger age groups, with females scoring 65.8 ± 28.4 and males at 74.8 ± 24.2. In the Northern region, satisfaction levels were more moderate, but males (73.0 ± 30.3) reported significantly higher satisfaction than females (70.1 ± 28.7). The Western region also displayed variation, with males (75.1 ± 26.6) and females (68.1 ± 28.7) reporting significant differences in satisfaction levels. Finally, an increase in satisfaction scores were seen in the Southern region, especially in the ≥65 age group (81.1 ± 10.4 for females).
The regression analysis, data not shown, assessed the influence of age and gender on overall satisfaction scores in outpatient maternity and child hospitals. Data indicated that as age increases, overall satisfaction slightly decreases; however, this effect was not statistically significant (β = −.026, P = .165). In contrast, gender showed a significant effect on satisfaction scores (β = −2.382, P = .001).
Discussion
The evaluation of PS in outpatient maternity and child hospitals provided valuable insights into healthcare service quality and identifies areas for improvement. The overall satisfaction score of 76.2 ± 26.4 suggested a moderate level of patient approval, with notable differences based on gender and age.
Our findings reinforced the insights drawn from international comparisons, further emphasizing the moderate level of satisfaction observed in maternity outpatient care. With an overall satisfaction score of 76.2 ± 26.4, the results aligned with those reported internationally. For example, Adams et al (2024) analyzed 19 228 patient responses in Australia and found that older adults consistently reported higher satisfaction scores than younger adults. 20 In the United States, where patient satisfaction with maternity care ranges between 70% and 80%, as highlighted by recent Centers for Disease Control and Prevention (CDC) reports.21,22 This is slightly below the levels observed in the United Kingdom, where systematic reviews indicated satisfaction rates of approximately 88%, and Canada, where national health surveys reported satisfaction levels close to 81%.2,3,21,23,24 These international studies consistently highlight clear communication, reduced waiting times, patient involvement in decision-making, and the use of digital health services as major contributors to elevated satisfaction levels.
Similar to our study, previous studies have identified similar trends in PS, with concerns primarily revolving around physician communication, waiting times, and access to care.4,5,25 In contrast to our findings, it was reported that the Qassim Health Cluster, located in the Al-Qassim Province of Saudi Arabia, found that 71% of patients reported that physicians did not introduce themselves, and 76% felt that providers failed to disclose their specialty, negatively impacting their overall experience. 4 This indicates that communication is a critical factor influencing satisfaction, and efforts to enhance provider-patient interaction could significantly improve patient experiences in maternity outpatient settings.
Long waiting times have also been consistently reported as a major concern in Saudi healthcare, affecting PS in various regions. 5 Saudi healthcare system has been addressing this issue through initiatives such as Vision 2030, which aims to improve healthcare efficiency and reduce waiting times through the implementation of digital solutions and streamlining healthcare processes.14,15,26 These efforts are aligned with our findings that suggest waiting times significantly affect PS, and continuous improvement in this area remains a priority. Moreover, a study by Daajani et al also examined the impact of waiting times on PS in outpatient settings. 5 The study concluded that prolonged waiting times significantly reduce satisfaction scores, particularly in specialized clinics. It was found that patients attending family medicine clinics were generally more satisfied due to shorter waiting times compared to other specialized clinics. 5 This is consistent with our own observations, where waiting time emerged as a critical factor influencing overall satisfaction, and interventions aimed at reducing waiting times are likely to improve patient experiences.
In comparison, our study identified long waiting times, inconsistent provider communication, and gender and region-based disparities as key factors negatively affecting satisfaction. The significant positive correlation between overall satisfaction and domains such as physician interaction, nurse care, and general assessment in our results supports the idea that effective patient-provider communication and coordinated care are crucial drivers of satisfaction, mirroring international best practices.
Moreover, the low correlation between satisfaction and pharmacy services in our data echoes similar issues identified in American studies, where delays and limited access to care were major sources of dissatisfaction. 27 This suggest that targeted interventions in communication training, appointment flow management, and digital service integration could meaningfully elevate satisfaction levels in Saudi outpatient settings and help position maternity outpatient care within the upper tiers of international satisfaction benchmarks.
Eggermont et al conducted a multinational survey across 34 European countries and found that age and gender concordance between patients and providers influenced patient-reported experiences, though not always satisfaction scores directly. 28 These findings support the demographic disparities observed in our study. significant gender disparity was observed in satisfaction scores, with male patients reporting a higher satisfaction rate (77.9 ± 26.2) compared to female patients (75.1 ± 26.4). This discrepancy might be influenced by multiple factors, including gender-based differences in healthcare experiences and expectations. Female patients often have higher expectations regarding maternal healthcare and may be more critical of service quality, particularly in areas such as provider empathy, waiting times, and accessibility.29 -31 Additionally, while male respondents were operationally considered as guardians accompanying patients, it is possible that some participants under the age of 18 completed the survey themselves, particularly adolescents with access to mobile devices. This may explain the discrepancy between the proportion of respondents aged ≤ 18 and the percentage of male participants. The survey did not explicitly capture the role of the respondent (patient vs guardian), which limits the ability to distinguish between these groups in the analysis. Additionally, cultural and logistical barriers, such as restrictions in mobility and gender-segregated healthcare environments, might contribute to lower satisfaction scores among female patients.25,31 Furthermore, women tend to express more critical views on healthcare services due to their heightened engagement with healthcare processes and their role in family health decisions25,30 while male patients may underreport dissatisfaction either due to lower expectations, less frequent interactions with the healthcare system, or sociocultural norms discouraging expression of dissatisfaction, especially with emotional or interpersonal aspects of care.32,33
This study identifies key factors influencing patient satisfaction in maternity and child outpatient hospitals. Elderly patients reported the highest satisfaction, possibly reflecting cultural norms that value respect for age and lower expectations for speed or technology. Females consistently scored lower than males across most domains. Regional differences were evident: the Central region led, while the Northern region had the lowest scores. Pharmacy and Laboratory services ranked highest, whereas the Moving Through domain—covering wait times and delay communication—was lowest, signaling a critical improvement area. These findings call for targeted efforts to enhance communication, reduce waiting times, and address demographic, cultural, and regional gaps. Future research should examine cultural drivers more deeply and assess the impact of digital health and policy reforms aligned with Vision 2030.
Limitations
Despite the valuable insights provided by this study, several limitations must be acknowledged. First, the use of secondary data imposes constraints, as researchers had no control over the data collection process, response rates, or handling of missing data. The exclusion of incomplete surveys (less than 50% answered) may have introduced bias by systematically omitting certain patient experiences. Additionally, response bias remains a concern since participation was voluntary, and the exclusive use of electronic surveys may have underrepresented individuals without mobile access or with limited digital literacy, skewing the sample toward younger, more technologically adept patients. Sampling bias may also exist, as the study may not fully represent all maternity outpatient clinics, particularly in rural or underserved regions. The gender distribution was heavily skewed toward female respondents, which reflects the nature of maternity services but raises the possibility of selection bias if dissatisfied male guardians were less likely to respond. Consequently, the observed higher satisfaction among male participants should be interpreted with caution. Furthermore, satisfaction scores reflect patient perceptions rather than objective measures of care quality, which may vary based on cultural expectations and personal experiences. Finally, cross-sectional design limits the ability to assess changes over time and recall bias may have influenced responses.
Future research should address these limitations by employing longitudinal designs, integrating qualitative methods, and exploring intervention-based approaches to evaluate the impact of digital health initiatives and policy reforms aligned with Vision 2030.
Conclusion
This study provides actionable insights into improving patient satisfaction in maternity and child outpatient hospitals. Findings highlight critical areas for intervention, including reducing waiting times, enhancing communication about delays, and expanding digital service delivery. Addressing these gaps is essential for improving patient experience and health equity. Enhancing outpatient satisfaction is also pivotal for achieving Vision 2030 targets and advancing broader health system reforms. Further research should adopt longitudinal designs to track satisfaction trends and assess intervention impact over time, and guide future interventions such as implementing digital health solutions, optimizing appointment systems, and developing culturally sensitive communication strategies to ensure equitable and patient-centered care.
Supplemental Material
sj-docx-1-inq-10.1177_00469580251398362 – Supplemental material for Patient Satisfaction and Its Determinants in Outpatient Clinics of Ministry of Health Maternal and Child Hospitals in Saudi Arabia: A Survey Analysis
Supplemental material, sj-docx-1-inq-10.1177_00469580251398362 for Patient Satisfaction and Its Determinants in Outpatient Clinics of Ministry of Health Maternal and Child Hospitals in Saudi Arabia: A Survey Analysis by Mervat M. El Dalatony, Majidah A. Aldawsari, Khaled M. Alghamdi, Lamis M. Alabdullatif, Nada M. Fussi, Norah A. Alothman, Randah M. Alalweet, Sanaa S. Alrahily and Mohammed S. Aldossary in INQUIRY: The Journal of Health Care Organization, Provision, and Financing
Footnotes
Acknowledgements
The authors would like to thank CTI Clinical Trial and Consulting Services for their counseling and publication support.
Ethical Considerations
This study was approved by the Institutional Review Board of the Ministry of Health, Saudi Arabia (IRB no. 25-36M) on 18-03-2025 All data were anonymized prior to analysis.
Consent to Participate
Informed consent to participate was implied through voluntary completion of the electronic survey. Participants were presented with a statement outlining the purpose and methodology of the study before beginning the survey. No written or verbal consent was required, as the data collection was conducted anonymously in accordance with IRB-approved protocols.
Author Contributions
M.S.A. was responsible for the overall project design and provided mentorship throughout the study. M.M.E. and M.A.A. led the conception of the research idea and developed the study framework. K.M.A. and L.M.A. managed data acquisition and ensured data integrity. N.M.F. and N.A.A. performed statistical analyses and contributed to interpretation of results. R.M.A. and S.S.A. drafted the initial manuscript and coordinated revisions. All authors reviewed and approved the final version of the manuscript.
Funding
The authors received no financial support for the research, authorship, and/or publication of this article.
Declaration of Conflicting Interests
The authors declared no potential conflicts of interest with respect to the research, authorship, and/or publication of this article.
Data Availability Statement
Any inquiries regarding the availability of supporting data for this study should be directed to the corresponding author.
Supplemental Material
Supplemental material for this article is available online.
References
Supplementary Material
Please find the following supplemental material available below.
For Open Access articles published under a Creative Commons License, all supplemental material carries the same license as the article it is associated with.
For non-Open Access articles published, all supplemental material carries a non-exclusive license, and permission requests for re-use of supplemental material or any part of supplemental material shall be sent directly to the copyright owner as specified in the copyright notice associated with the article.