
Abstract
Optimal diabetes mellitus (DM) control is associated with improved cardiometabolic markers. Interventions such as peer-led education and support offer a community-driven approach to enhance self-management and mitigate cardiometabolic risks associated with diabetes, even though they are not well understood in Kenya. This study sought to determine the effectiveness of a 12-months peer-led diabetes education and support on cardiometabolic markers among adults with type 2 DM. A total of 132 participants with type 2 DM were allocated to intervention (n = 66) and control (n = 66) groups. The intervention group was subjected to a structured peer-led diabetes self-management education and support (DSMES) twice a month for 12 months. The control group was provided with standard care. Outcomes, including glycated hemoglobin (HbA1c), random blood glucose (RBG), blood pressure (BP), and anthropometrics, were monitored at baseline and at the end of the study, and compared across the study groups. Peer-led DSMES achieved significant improvements in glycemic outcomes in the intervention group with the RBG being lower (M = 7.56 vs 9.22 mmol/L; P = .008; d = 0.48), and HbA1c being substantially reduced (M = 7.36% vs 8.95%; P < .001; d = 0.78). Blood pressure showed small but non-significant reductions in the intervention group (systolic: d = 0.30, P = .090; diastolic: d = 0.27, P = .117). There were however no significant differences observed in weight, Body Mass Index and waist hip ratio (all P > .60; Cohen’s d < 0.10). This is one of the novel peer-led DSMES evaluation demonstrating the feasibility and effectiveness of a peer support system in enhancing self-management, and thus control of DM-related cardiometabolic risks in low-resource settings. However, longer follow-ups, larger populations and multiple study sites are recommended to realize the broader effect of peer-led interventions on cardiometabolic health and universal health coverage.
Introduction
The increasing global burden of diabetes mellitus (DM) is expected to have negative socioeconomic and health impacts on individuals, families, and health systems, particularly in low- and middle-income countries (LMICs). Africa bears the largest burden and the fastest increase in DM cases, with an estimated prevalence of 23.6 million, and projected to rise to 54.9 million (5.2%) by 2045. 1 Kenya has a documented diabetes prevalence of 3.1%, with approximately 53.6% cases of prediabetes and undiagnosed diabetes.1,2 This increase is attributed to rapid urbanization, lifestyle changes, and an epidemiological transition that does not align with available resources and interventions for optimal health. 3 In addition, data indicates that 50% of hospital admissions and 40% of inpatient mortalities are associated with cardiovascular diseases (CVDs) putting a strain on an already constrained health system (Kenya National Guidelines for Cardiovascular Diseases Management, 2018). The mortality rate is directly linked to the disease process as well as disease-related complications such as CVDs, tied to suboptimal management or non-adherence to treatment regimens.4 -6 This illustrates that LMICs such as Kenya bear a substantial burden of financial expenditure related to the diagnosis and management of DM and CVDS, emphasizing the need to provide a sustainable, cost-effective strategy in control of diabetes and prevention of related complications.7,8
A key principle in the management of DM is its identification, management, and monitoring. This involves monitoring glycemic and cardiometabolic markers, which are relevant in the prevention of CVDs, as well as monitoring and evaluating treatment response.9 -11 Additional biomarkers relevant to CVDs that need to be monitored in patients with DM include BP, body weight and body mass index (BMI), waist circumference (WC), and waist-hip ratio (WHR).12,13 Patients with DM require complex care pathways and self-management education to control and mitigate acute and long-term complications. However, adherence to diabetes self-management education (DSME) is affected by a lack of social support, economic constraints, and the psychological and emotional impact of the disease.14,15 DSME and support (DSMES) provided through health worker-led, community health worker/educator-led, or peer leader-led initiatives have resulted in positive reports on DM care.16,17
Specifically, peer-led strategies have effectively achieved glycemic control and have proven to be cost-effective in the management of DM.16,18,19 Peers identify with one another, share knowledge and encouragement, and provide the necessary support system and motivation. 20 Past studies in other regions have established that peer support interventions are cost-effective and can sustain improvements in DM biomarkers longer than other strategies, a game changer in resource-constrained areas characterized by inadequate healthcare professionals and economic resources.21 -23 While evidence from other settings support the impact of peer-led DSMES, studies in Kenya remain limited, particularly with regard to cardiometabolic outcomes. Indeed, a recent scoping review on peer support and social networking interventions in DM in Kenya and Uganda reported improved clinical outcomes for patients with type 2 DM but cited limited data on peer interventions in the region. 24
Peer-led DSMES leverages on the lived experiences of individuals living with diabetes to educate each other. Unlike the healthcare provider-led strategies, peer-led DSMES are cost effective and may be culturally adaptable, making them appropriate in resource constrained set-ups where shortage of workforce and other healthcare resources hinders structured DSMES. This can be scaled to the national level with involvement of community health workers and peer networks to achieve control of cardiometabolic risks in the diabetes population.
The study was premised on Albert Bandura’s Social Cognitive Theory that emphasizes on social learning and the reciprocal interaction between the person (cognition, self-efficacy), the social environment and behavior. 25 In this study, the peer leaders and members of a support group act as role models for each other with learning expected to yield the capacity to influence own behavior.
Objective
This study sought to determine the effectiveness of a 12-month peer-led DSMES in managing cardiometabolic risks in patients with type 2 DM attending a regional hospital in Kenya by comparing them with their counterparts who received otherwise similar care minus the peer-led DSMES.
Methods
Study Settings
The study was conducted at the out-patient diabetes clinic within the Embu County Referral Hospital in Kenya and its catchment area for a period of 12 months between July 2022 and August 2023. Approximately 200 adults were on follow-up care at the clinic. The hospital is situated in Embu County, which borders Kirinyaga, Kitui, Tharaka Nithi, and Machakos counties. These areas comprise the clinic’s catchment region, with the majority of the patients originating from Embu County.
Study Design, Sampling Methods, and Respondents
This was a 12-month quasi-experimental study involving adults (n = 136) with type 2 diabetes mellitus who were allocated into control and intervention groups. All the participants who met the inclusion criteria were included resulting in a total sample of 136 adults. They were enrolled during routine clinic visits. While no a priori sample size was calculated, the sample achieved provides 80% power at an alpha level of 0.05 to detect a minimum effect size of Cohen’s d = 0.48. The inclusion criteria included adult males and females aged 18 years and older with primary type 2 diabetes mellitus on follow-up at the clinic and who provided consent. Pregnant and lactating women were excluded because of the possibility of gestational diabetes. Participants engaged in other diabetes management programs or studies that could affect the validity of the study outcomes were also excluded.
Stratified randomization was employed to assign the enrolled participants to 2 cohorts: the control group (health care provider-led strategy/standard care) and the intervention group (peer-led strategy). Stratified randomization was carried out to ensure that the baseline characteristics of the control and intervention groups were similar, thereby enhancing the validity of the planned interventions. In this case, all 136 recruited participants were randomized into blocks/covariates (sociodemographic characteristics, anthropometric measures, RBG, BP, and HbA1c measurements). Simple randomization was then used to assign participants from the blocks to either the control or intervention group, resulting in 2 study groups, each comprising 68 participants. However, 4 participants (2 from each group) were lost to follow-up, resulting in 66 participants in each group. To ensure validity and reliability of the study findings, single blinding with allocation concealment was used on the part of the participants. However, owing to the fact that this was a single center study, there was potential for performance bias due to possibility of information sharing in their localities/residences.
Convenience sampling method based on locality or residence was employed to place the participants in the intervention group into 8 groups (numbered 1-8), each consisting of 8 to 9 members. This arrangement was intended to facilitate the logistics of conducting the peer group meetings, thereby providing convenience for the members. Purposive sampling was also utilized to select a peer leader from each of the intervention groups, with guidance from healthcare workers familiar with the patients at the clinic to identify the most suitable leaders. Peer leaders were expected to demonstrate empathy, possess good communication skills, and show commitment to supporting others, as well as commitment to the study process. No further groupings were established for the control group.
Data Collection Tools and Procedures
Data were collected via a researcher-assisted structured questionnaire consisting of subsections on sociodemographic information and the clinical, biochemical and anthropometric measurements. The measurements were taken before the intervention to obtain baseline data and later after the 12-month intervention to obtain data that would be compared with the baseline data to ascertain the impact of the intervention or lack of it. The measurements taken at the 2 points of the study included RBG, HbA1c, BP, waist, and hip circumferences (WC and HC), body weight, height and calculation of the BMI and WHR. To ensure reliability of the data, all the measurements were taken via standard techniques as described in Maina et al. 13
Validity and Reliability of the Study Tools
The questionnaire was developed by the research team. The questionnaire was then reviewed for face validity by an expert diabetes researcher who provided feedback that was subsequently incorporated. The test-retest method was employed to assess the internal consistency and construct validity of the questionnaire. Using Cohen’s kappa statistic, the test-retest coefficient was 0.8, indicating an acceptable level of inter-rater reliability. Pretesting of the study instruments was conducted with 10 participants (7% of the sample size) at a Sub-County Hospital’s Diabetes Clinic, which offered similar services. A few questions in the questionnaire were rephrased to eliminate ambiguity. No major modifications arose from the pretesting exercise. Before the measurements were obtained, the machines were calibrated to standard measures. Measurements were taken by the same team of research assistants via the same tools throughout the study period to ensure reliability. The research assistants possessed bachelor’s degrees in nursing, making them familiar with the research methods. Laboratory tests were conducted by 2 qualified laboratory technicians. Both the research assistants and the laboratory technicians received training on the ethical conduct of research and the study procedures from the research team before participant recruitment and data collection.
Outcome Measures
HbA1c levels <7% signified good glycemic control, whereas readings ≥7% were regarded as uncontrolled or poor glycemic control as per the guidelines by the American Diabetes Association for non-pregnant adults. 26 RBS levels ≥ 11.1 mmol/L were considered high/uncontrolled. 27 High/uncontrolled BP was defined as a systolic BP ≥ 140 mmHg and a diastolic BP of ≥90 mmHg. 28 At baseline, participants whose BPs were found to be below the defined limits for hypertension but reported to have been previously diagnosed or on antihypertensive medications were also recorded as having hypertension.
WC > 94 cm in men and >80 cm in women were considered central obesity, reflecting an increased risk for cardiometabolic complications, whereas WC > 102 cm in men and >88 cm in women reflected a substantially increased risk. For the WHR, values ≥ 0.90 (men) and ≥0.85 (women) were considered to indicate increased risk for cardiometabolic complications. 29 Participants with a BMI ≥ 25 were classified as overweight, those with a BMI ≥ 30 were classified as obese, those with a BMI < 18.5 were classified as underweight, and those with a BMI ranging from 18.5 to 24.9 were classified as normal. 29
Peer Support Intervention
This involved 12-month peer-peer meetings where the participants in the intervention group took part in a structured DSMES program by attending bimonthly sessions and following the self-management guidelines. The meetings were held at designated venues in their localities for each of the groups. The sessions focused on skills and knowledge related to healthy eating, activities and exercise; monitoring to prevent complications; taking medication; problem-solving; reducing risks; and healthy coping. 21 While the participants in the control group received standard care only, those in the intervention group received standard care (healthcare provider-led strategy) in addition to the peer DSMES intervention. Standard care can be described as the routine or usual treatment or management that the patient typically receives on the basis of their circumstances, their clinical condition and the resource capabilities of the clinical setup.
The 8 peer group leaders participated in a 2-day training program whose content was developed by the research team. The training focused on teamwork, diabetes self-management and how to recognize and manage diabetes emergencies. They were also briefed on how to interact with members via active listening and nonjudgmental communication, helping members with self-management skills, assisting with lifestyle changes where needed and providing social and emotional support. 30
The current and expected clinical measurements were discussed during the first meeting. Furthermore, the participants maintained a record of progress regarding diabetes control activities and any measurements taken, which were discussed during the meetings. Each meeting addressed a specific aspect of DSMES as prescribed by the research team, along with members’ feedback on their self-management progress. The meetings took 1 h to 1.5 h. The group members provided support to one another under the guidance of the peer leader. Particularly challenging issues were directed to the research team and health care providers during the monthly meetings with the peer leaders or during oversight visits conducted by the research team.
The research team was responsible for the oversight role throughout the study in order to ensure patient safety and credibility of the data collection procedures. Standardization of practices and meetings in the different peer support groups was ensured by provision of standard training to the 8 peer leaders, setting the same number of meetings for each of the 8 groups, agreement on the topic of discussion for each meeting for all the groups, frequent impromptu visits to the different groups during their meetings and being present in the first meeting for every peer support group. The monthly meetings with the peer support group leaders were also helpful in the oversight role since the research team had an opportunity to evaluate the progress made in the groups, make suggestions or clarifications where need be and handle any challenges presented by the peer support group leaders. Communication via telephone calls remained open between the research team and the peer leaders. Despite rescheduling of peer group meetings due to unavailability of members during the scheduled time and days, all the peer support groups managed to hold all the bi-monthly meetings and cover the content as planned in the study schedule.
All the participants in both the control and the intervention groups had their RBG, HbA1c, BP, and anthropometric measurements taken at 2 points in time: at baseline (0 months) and at 12 months (end-line).
Statistical Analysis
The data were analyzed via computer software (SPSS V. 22). Frequencies and proportions were obtained for categorical variables, whereas means and standard deviations were expressed for continuous variables. The chi-square test of independence was used to establish significant differences in sociodemographic characteristics and cardiometabolic markers between the groups. For continuous variables, the paired t test was employed to determine within-group differences (after–before). The t test for independent samples was used to assess between-group differences in these variables, assuming either equal or unequal variances. The effect sizes (Cohen’s d and point-biserial correlation r) were calculated to estimate the magnitude of the group differences. The P value used to determine the significant findings was set at P ≤ .05, at 95% confidence interval.
Ethical Considerations
Ethical approval was obtained from the Kenyatta National Hospital/University of Nairobi Ethics and Research Committee (KNH-UoN ERC) (Approval No P140/03/2021). Permission was also obtained from the Department of Health - Embu County Government and the management of the Embu County Referral Hospital. Written informed consent was obtained from the study participants. The participants were not exposed to any harm as universal precautions were strictly adhered to during specimen collection. Anonymity was observed, and all the data collected were treated with the utmost confidentiality.
Results
Response Rate
Out of the 136 participants recruited at the beginning of the study period, there was a loss to follow-up on 4 participants and thus 132 participants (66 in each arm) translating to a 97.1% response rate, completed the study and are included in data analysis. To preserve the internal validity of the intervention, “the intention-to-treat principle” was used where participants were analyzed according to the original group allocation, regardless of the actual adherence to the intervention.
The study flow diagram is illustrated in Figure 1.
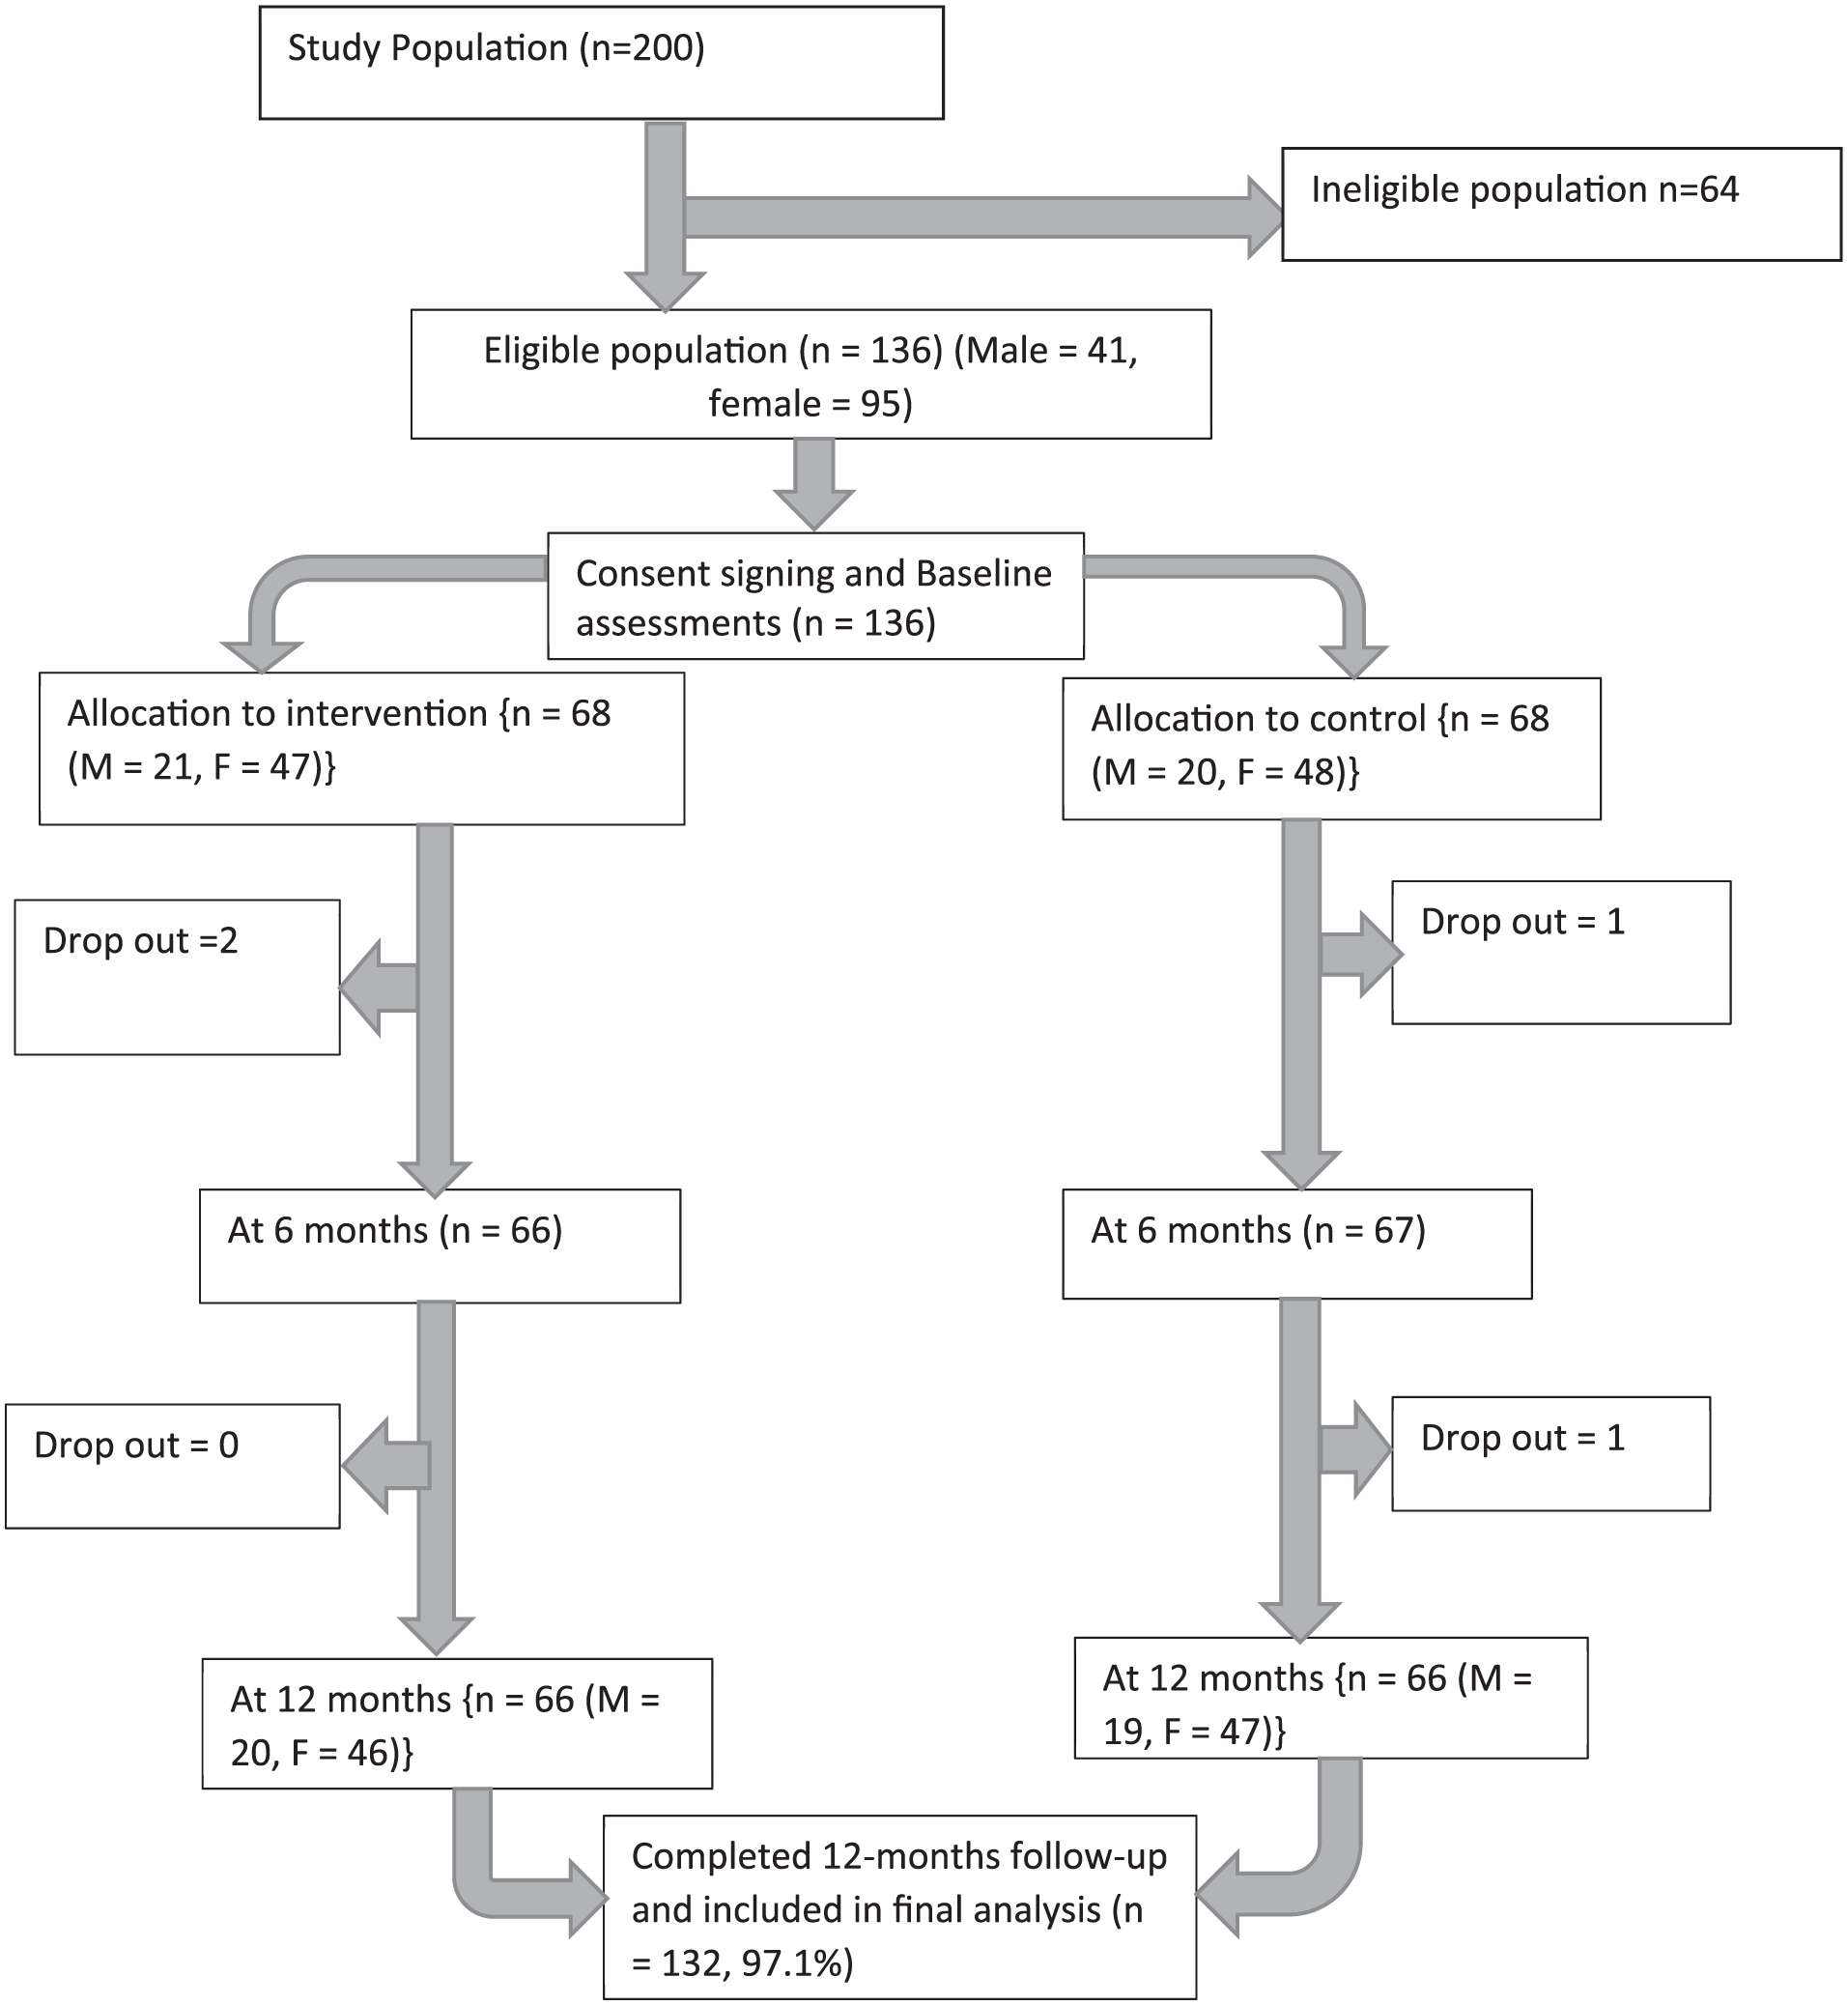
Flow diagram on study participation.
Sociodemographic Characteristics of the Participants at Baseline
A total of 132 participants fully participated in the study to completion. The mean age was 56.29 (±13.94) years for the control group and 56.58 (±13.99) years for the intervention group. Most respondents (70.5%) were female, were married (78.0%), and were Protestant Christians (74.2%). Approximately half (47.7%) of the participants had a low level of education and were self-employed (44.7%). Further analyses via a chi-square test did not reveal any statistically significant differences in sociodemographic characteristics between the intervention and control groups at baseline (Table 1).
Sociodemographic Characteristics of the Participants Across the Study Groups.

Analyzed using a t-test of independence.
Baseline Anthropometric, Clinical and Biochemical Measurements Across the Groups
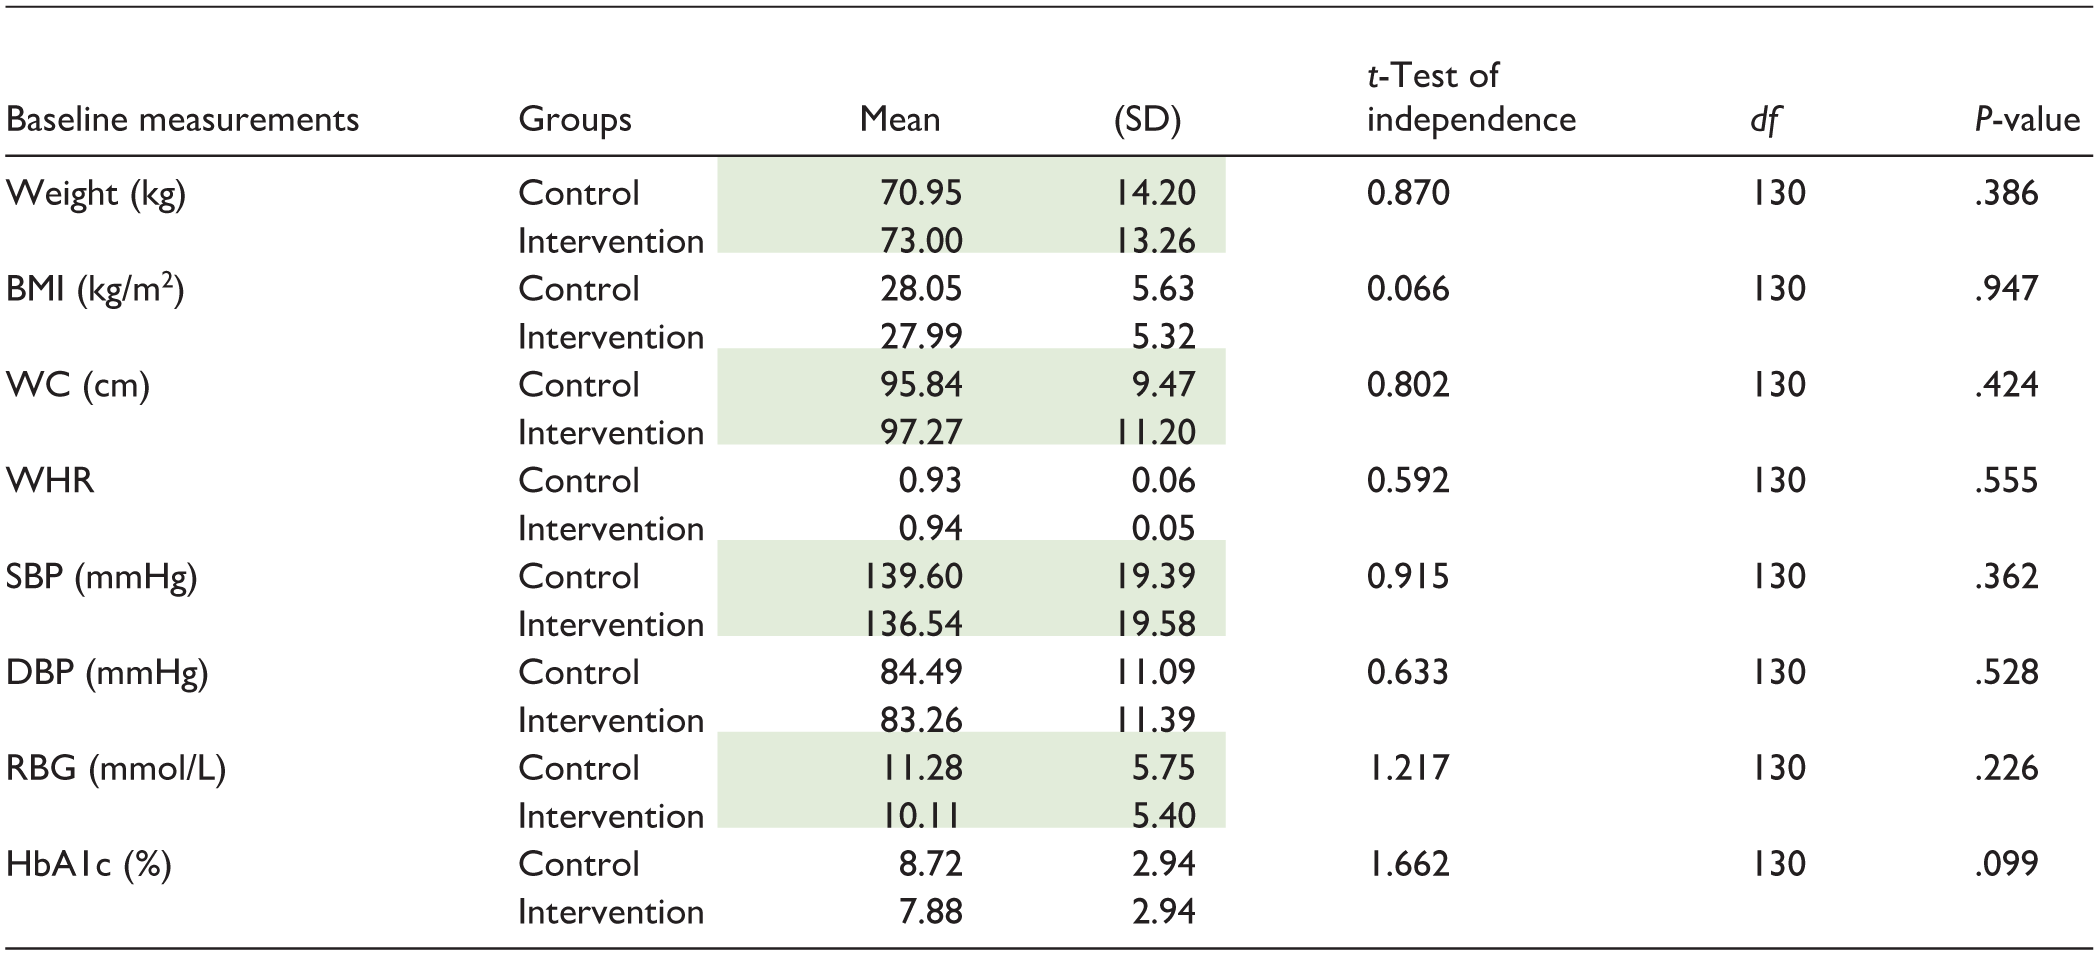
Table 2 presents anthropometrics, clinical and biochemical measurements between the 2 groups at the baseline. There was no considerable difference between the 2 groups, both for anthropometrics, clinical and biochemical profiles at the baseline. Analysis with a t-test of independence showed that there was no noticeable difference between the 2 groups for body weight (t = 0.870; P = .386), BMI (t = 0.066; P = .947), WC (t = 0.802; P = .424), WHR (t = 0.592; P = .555), SBP (t = 0.915; P = .362), DBP (t = 0.633; P = .528), RBG level (t = 1.217; P = .226), and HbA1c (t = 1.662; P = .099; Table 2).
Anthropometric, Clinical and Biochemical Measurements Between the Groups at the Baseline (mean ± SD).

Note. The weight and WC should be left out as they are well represented by BMI and WHR respectively. The SBP and the RBG are significant and form part of the discussion. Actually, The SBP and the DBP are necessary in the discussion on the effect of the intervention on the BP. The RBG is part of the study limitations.
BMI = Body Mass Index; WC = waist circumference; WHR = waist hip ratio; SBP = systolic blood pressure; DBP = diastolic blood pressure; HbA1c = hemoglobin A1c/glycosylated hemoglobin.
Random Blood Glucose (RBG) Level Changes in Participants Across the Study Group Over the Study Period
The level of random blood glucose in the intervention group compared with the control group during the study is illustrated in Figure 2. At baseline, 37.9% (n = 25) of participants from both the control and intervention groups presented high RBG levels (P = 1.000). However, at the end of the study (12 months after baseline), the percentage of participants with high RBG significantly (P = .004) declined by 19.7%, from 37.9% (n = 25) to 18.2% (n = 12), in the intervention group. Conversely, the percentage of participants with high RBG increased by 3%, from 37.9% (n = 25) to 40.9% (n = 27) in the control group.

Random blood glucose changes (mmol/L) in the control and intervention groups over the study period.
Changes in HbA1c Levels in the Control and Intervention Groups Over the Study Period
The level of HbA1c (≥7%) among participants in the intervention and control groups over the study period is illustrated in Figure 3. The majority of participants in the control group (68.2%, n = 45) and intervention group (59.1%, n = 39) exhibited high HbA1c levels, although the difference was not statistically significant (P = .278) at baseline. However, HbA1c levels significantly declined (P = .001) among participants in the intervention group, with only 48.5% (n = 32) having uncontrolled HbA1c at the endpoint. Conversely, 77.3% (n = 51) of participants in the control group had uncontrolled HbA1c at the endpoint.

Changes in Hemoglobin A1c level changes (%) among participants in the control and intervention groups over the study period.
Blood Pressure Level Changes in the Control and Intervention Groups Over the Study Period
The BP levels of the participants in the intervention and control groups throughout the study period are illustrated in Figure 4. Most participants in the control (56.1%, n = 37) and intervention (43.9%, n = 29) groups exhibited high BP; however, the difference was not statistically significant (P = .106) at baseline. Conversely, BP significantly declined (P = .002) by 15.1% (from 43.9%, n = 29 to 28.8%, n = 19) in the intervention group by the end line. In contrast, there was an increase in participants with high BP of 1.5% (from 56.1%, n = 37-57.6%, n = 38) in the control group.

Changes in Blood Pressure levels (mmHg) among participants in the control and intervention groups over the study period.
Levels of Cardiometabolic Markers Among Participants in the Control and Intervention Groups at the End-Line
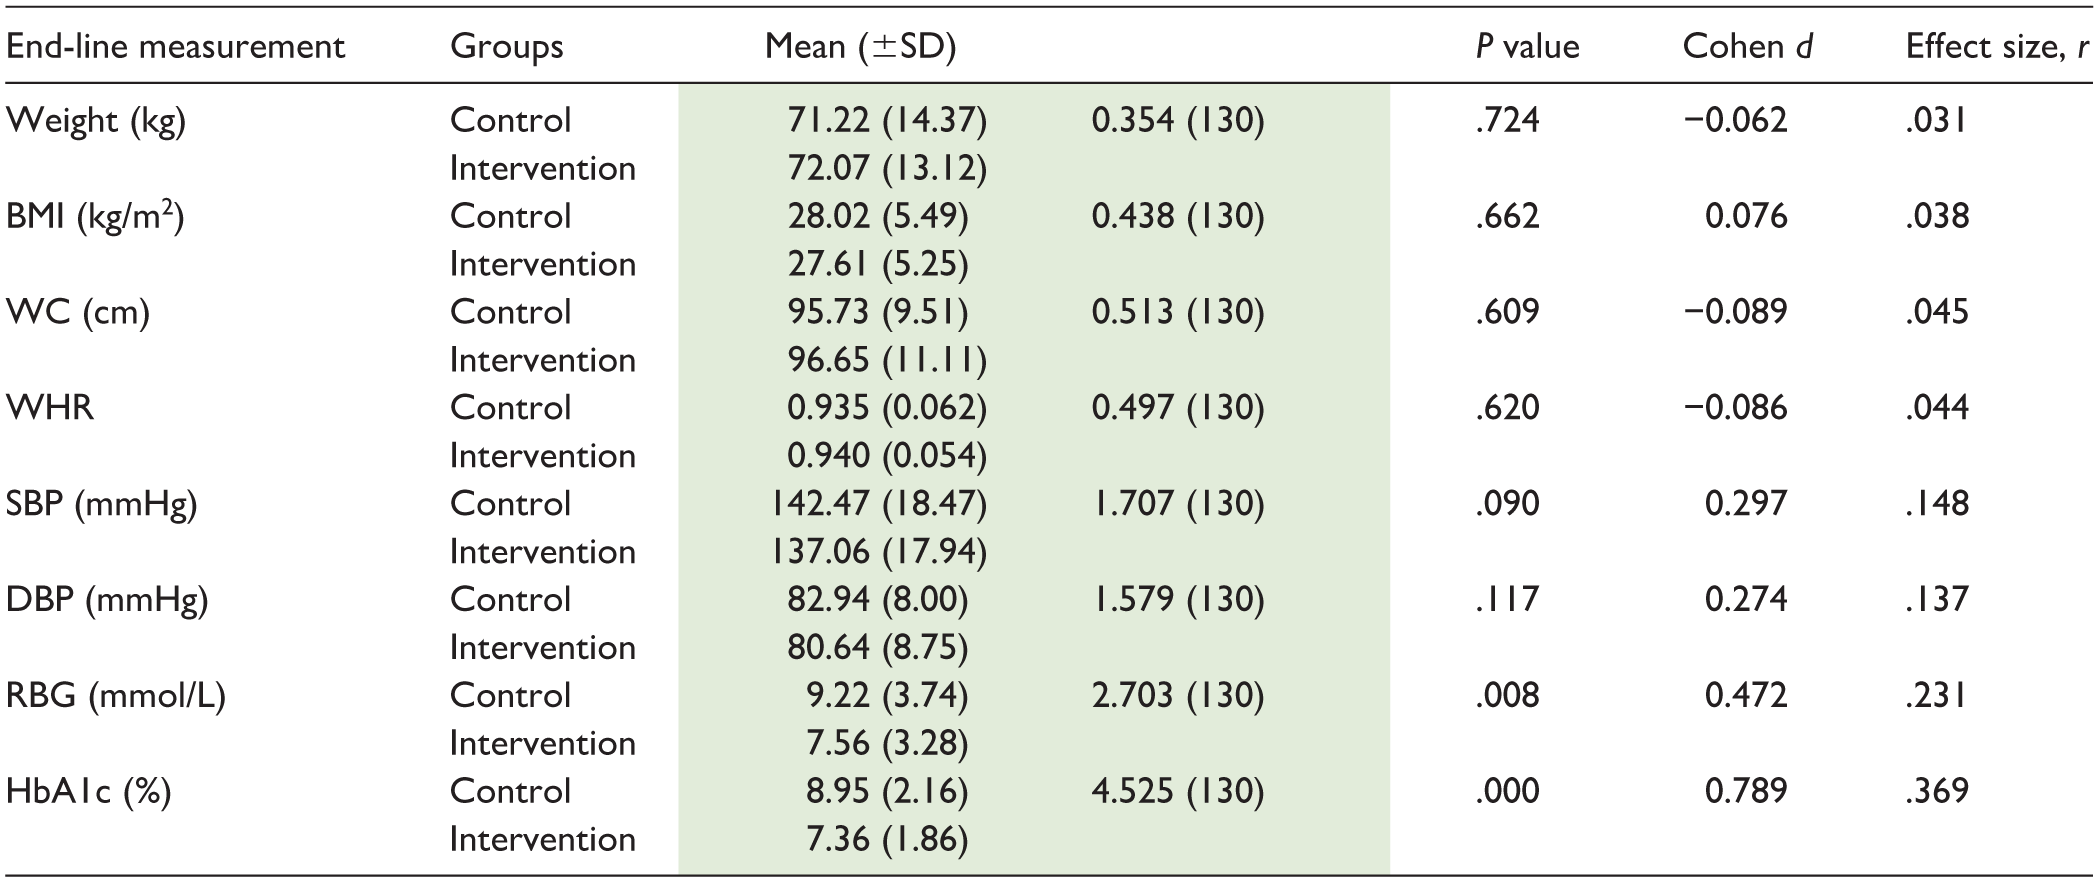
To compare the outcomes between the intervention and control groups at end-line, independent samples t-tests were conducted. There were significant group differences for glycemic outcomes with the RBG levels being significantly lower in the intervention group (M = 7.56, SD = 3.28) than in the control group (M = 9.22, SD = 3.74), t(130) = 2.70, P = .008, with a small-to-medium effect (d = 0.48, r = .23). Equally, HbA1c levels were significantly lower in the intervention group (M = 7.36, SD = 1.86) than in the control group (M = 8.95, SD = 2.16), t(130) = 4.53, P < .001, with a medium-to-large effect (d = 0.78, r = .37). Anthropometric indicators, including weight, BMI, waist circumference, and waist-to-hip ratio revealed no significant differences between the groups (all P > .60) and had negligible effect sizes (Cohen’s d = –0.09 to 0.08; r = 0.03-0.05). Blood pressure outcomes reflected modest but non-significant group differences with systolic blood pressure being lower in the intervention group (M = 137.06, SD = 17.94) than the control group (M = 142.47, SD = 18.47), t(130) = 1.71, P = .090, with a small effect size (d = 0.30, r = .15). Similarly, diastolic blood pressure was lower in the intervention group (M = 80.64, SD = 8.75) compared with the control (M = 82.94, SD = 8.00), t(130) = 1.58, P = .117, but with a small effect size (d = 0.27, r = .14; Table 3).
Levels of Cardiometabolic Markers Among Participants Across the Study Groups at the End Line (Mean ± SD).

Note. The means are part of the results and the discussion and thus necessary.
CG = control group; IG = intervention group; BMI = Body Mass Index; WC = waist circumference; WHR = waist hip ratio; RBG = random blood glucose; SBP = systolic blood pressure; DBP = diastolic BP.
Discussion
Our study demonstrated that peer-led DSMES improved cardiometabolic markers in adults with type 2 DM following a 12-month intervention as evidenced by improvements in glycemic control and systolic BP. These improvements may be associated with behavioral change as a result of acquired competences in self-management linked to peer education and support. This is consistent with previous studies on peer support that showed that perceived competence and improved goal setting translated to improved health outcomes in patients with low support and poor health literacy at baseline.31,32
Specifically, the peer-led DSMES intervention had a medium to large effect on glycemic control, characterized by improved RBG levels and optimal HbA1c. HbA1c is a critical marker and an indicator of how well DM has been controlled over approximately 8 to 12 weeks preceding the test. 33 In regard to clinical relevance, optimal glycemic control is associated with reduced cardiometabolic complications as well as the severity index of diabetes complications.34,35 Similarly, past studies have reported significant improvements in glycemic control associated with peer-led DSMES programs involving smaller groups, closer group sessions, and long-term follow-up periods.16,19 A study by Peimani et al demonstrated the achievement of glycemic control following 6 months of self-management support from trained peers with diabetes in a low-income population in Iran. 23 Moreover, peer support combined with diabetes education resulted in improved glycemic control in underserved communities in Mexico. 36 Although these studies were conducted in different geographical, demographical and cultural contexts, limiting their translation in the Kenyan context, they offer insights for adaptability in diverse settings, particularly the resource-constrained set-ups.
Our study intervention resulted in a significant reduction in the proportion of patients with high systolic BP in the peer-led group, probably related to improvements in adherence to medication and self-management activities. However, there was only a modest, non-significant effect of the intervention on BP. This could probably be due to slower physiological adaptation such as vascular remodeling necessary to lower BP, especially in participants with longer duration of DM.37,38 However, peer support interventions have reported improvements in systolic BP among participants with minimally elevated BP at baseline.39,40 Locally, Sanya et al reported significant improvements in systolic blood pressure following a 12-month follow-up in patient support groups in 2 randomized trials in Kenya and 1 retrospective cohort study in Cambodia. 40 In contrast, some studies have found peer support ineffective in BP control despite improvements in other cardiometabolic markers.19,41 For example, in a study in a low-resource setting in Argentina, peer mentoring was not effective in controlling BP but improved medication adherence. 41 Failure to achieve significant effects in our study and these studies could be attributed to behavior, barriers to adherence to self-management, physiological adaptation, and the influence of other markers, such as BMI. Weight loss in obese/overweight individuals has been associated with low risk of developing hypertension and optimal levels of BP for individuals with hypertension, as evidenced in past studies.42,43 In addition, longer periods of follow-up and sustained behavior change may be necessary to achieve meaningful BP changes.
Despite achieving glycemic control, peer DSMES achieved minimal improvements in anthropometric measurements (body weight, BMI, WC, and WHR), recording negligible effect sizes on these parameters. Glycemic control proves easier to achieve due to rapid glucose metabolism unlike the other parameters. With redistribution of body fat that occurs with aging, metabolic adaptation and the gradual adipose tissue remodeling, longer periods are necessary to trigger noticeable changes in these cardiometabolic markers. In fact, several past studies concur that glycemic markers respond more swiftly to interventions targeting lifestyle changes while the other cardiometabolic markers lag behind. For instance, Werner et al in a systematic review observed significant reductions in HbA1c over 12-months studies but improvements in weight and BP were inconsistent. 44 Similarly, O’Donoghue et al and Sun et al have reported incremental glycemic improvements over several months of lifestyle interventions but variable and minimal effects on BMI and anthropometric measurements among adults in LMIC settings.45,46
A recent study from Western Kenya reported no significant improvements in body weight or BMI after a 6-month peer intervention, likely because of the short duration of the intervention. 47 On the other hand, a study in Cameroon reported improvements in body weight and BMI and other metabolic markers over 6 months but included personal encounters and telephone calls to increase peer-led meetings, keeping the participants engaged. 48 This emphasizes the importance of tracking the activities aimed at achieving control of the metabolic markers. All participants should engage in the activities discussed during peer group meetings with equal intensity, something that our study failed to ascertain. These observations point that these cardiometabolic markers may require longer sustained, high intensity interventions or both to achieve behavior change.
Nonetheless, other factors may explain the lack of significant effects on BMI and other cardiometabolic markers, following peer interventions.19,39 For instance, sociocultural influences may determine the success of weight management, especially in the African context, where a full body size is associated with optimal health and prosperity, and vice versa.49,50 In fact, strong cultural norms around diet, physical activity and family obligations as well as economic constraints influence adherence to self-management activities impacting the control of cardiometabolic markers in diabetes.51 -53 Tailoring the peer-led interventions to the cultural beliefs and norms of the study population may positively influence the outcomes on the self-management activities, delivering an improvement in the cardiometabolic markers over time. 54
Moreover, our study population was predominantly female and this might have influenced the effectiveness of the intervention. Biologically, women with diabetes have more central adiposity and higher cardiovascular disease risks than men due to hormonal influences, and may thus necessitate longer interventions to realize improvements. 55 Additionally, low socioeconomic status and competing household tasks may limit women engagement in self-management activities such as physical activity and dietary choices, affecting long-term cardiometabolic changes. 56 These observations may explain why we did not achieve significant improvements in the anthropometric measurements. On the contrary, women are more receptive to health education and support groups than men and are primarily involved in meal preparation in most cultures, which may influence the outcomes. 57 In addition, devoid of the sociocultural norms that glorify overweight, women may face more pressure toward body weight management than men, motivating adoption of behavior modification. 58 This does not however invalidate that time is a factor influencing cardiometabolic markers improvement.
The measurement of abdominal and visceral obesity indices in older adults is more valuable than traditional anthropometric indices, with weight loss and a reduction in visceral adiposity recognized as a primary goal in achieving glycemic control and preventing cardiometabolic complications.59 -61 Other studies have found WHR and waist-to-height ratio to be better predictors of glycemic control than BMI, while others have recommended the use of a combination of BMI and WC, rather than one in isolation, as an indicator of obesity in those at risk and with type 2 DM.62,63 Similar to our study, a previous meta-analysis of RCTs conducted on overweight and obese individuals revealed no effect of peer intervention on WC and WHR, despite having an effect on BMI, suggesting that reducing WC may not be as straightforward as controlling BMI, even in the general population. 64 There are limited data on the impact of peer support interventions on WC and WHR. Nevertheless, community-based group activities focused on self-management in individuals with type 2 diabetes for more than 3 months were found to be effective in improving waist circumference and body weight in China. 65 Despite the limited availability of data, there is a need for peer interventions that concentrate more on individuals with normal weight but central obesity, as WC and WHR are considered better predictors of cardiometabolic risk in individuals with diabetes mellitus albeit difficult to control.62,66,67 Additionally, the failure to achieve significant changes in these parameters may be due to non-adherence to exercise and dietary recommendations, especially in the absence of external support, such as from family members and friends, which is beyond the scope of this study.68,69
Strengths and Limitations of the Study
This study highlights the contribution of peer-led DSMES in the management and control of cardiometabolic markers in adults with type 2 diabetes mellitus, which extends beyond usual care. This approach is less time-consuming yet cost-effective in strengthening diabetes self-management at the grassroots level of the healthcare system, making it potentially acceptable to patients and replicable in resource-strained LMICs.
Randomization increased the validity and generalizability of the intervention but may be limited by the small sample size and the fact that it was a single center study. Single blinding with allocation concealment was however done but may have been affected by sharing of information between the 2 study groups due to the shared localities as is the case in a single-center study, raising potential performance bias. Additionally, the study is limited by its reliance on RBG measurements rather than fasting blood glucose measurements to ascertain glycemic control. This limitation arose because participants were seen at the clinic at varying times on an outpatient basis, leaving researchers without control over their feeding practices at home, hence fasting was not ensured. RBG however still offered a reliable point of care assessment but may not reliably reflect glycemic control over time. The use of HbA1c measurements, however, remedied this by providing the average glycemic control over the preceding 2 to 3 months, thereby strengthening the accuracy and relevance of the evaluation.
Although no a priori power analysis was performed, there was maximum recruitment of participants. Nonetheless, smaller but potentially meaningful differences may not have been detected since the achieved sample provides 80% power at α = .05 to detect only moderate effect sizes. Moreover, the application and adherence to the self-management activities discussed in peer DSMES sessions was not fully verified despite the standardization of intervention and oversight provided by the research team.
Conclusions
The findings suggest that peer-led DSMES, integrated with the healthcare provider-led strategy are effective and feasible in glycemic control in adults with type 2 diabetes mellitus within resource-constrained settings. This approach can be replicated in a larger population, similar locations and may serve as a bridge between the primary healthcare system and community health with scaling within national diabetes care strategies. Providing culturally-tailored interventions that transcends sociocultural barriers strengthens universal health coverage. Formal policy adoption with facilitation of ongoing follow-up and structural support is necessary and may accelerate Kenya’s progress toward universal health coverage while empowering people living with diabetes to actively participate in self-management. Indeed, peer-led DSMES provides a cost effective strategy in the face of the devolved health system and a biting shortage of skilled healthcare workforce in Kenya and other LMICs.
To achieve widespread cardiometabolic benefits, more needs to be done. Further studies involving larger populations, multiple sites and broader scopes are recommended due to insufficient evidence regarding the effects of peer support interventions on other cardiometabolic risks and to enhance generalizability. Longer follow-ups, close monitoring of behavior change and consideration of social norms is recommended in future studies in order to realize the broader effect of peer-led interventions on cardiometabolic health. Further studies should also consider using fasting blood glucose or oral glucose tolerance tests rather than random blood glucose as more reliable indicators of glycemic control.
Footnotes
Acknowledgements
The authors acknowledge Dr. Tekeste Okubatsion for providing statistical insight into the study.
Ethics Considerations
This study was performed in accordance with the principles of the Declaration of Helsinki. Approval was granted by the Kenyatta National Hospital/University of Nairobi Ethics Committee (Approval number - P140/03/2021).
Consent to Participate
All participants provided a written informed consent.
Author Contributions
E.W.M., S.K., and J.M. conceptualized and designed the study. E.W.M. acquired the data, analyzed and interpreted the data, and drafted the article. All the authors critically reviewed the article.
Funding
The authors disclosed receipt of the following financial support for the research, authorship, and/or publication of this article: Partial financial support for data collection was received from the University of Embu, Kenya.
Declaration of Conflicting Interests
The authors declared no potential conflicts of interest with respect to the research, authorship, and/or publication of this article.
Data Availability Statement
The dataset analyzed during the study is available from the corresponding author upon reasonable request.