
Abstract
The Dartmouth Atlas of Health Care published data on regional variations in healthcare for Medicare fee-for-service beneficiaries from 1996 to 2022. Despite its revolutionary impact on health services research and policymaking, to our knowledge, no comprehensive review has been undertaken to systematically study how the Dartmouth Atlas has been used by the research community. We identified all 8507 publications that cited the Dartmouth Atlas between 1996 and 2023. With this corpus, we conducted authorship network analyses and conducted a content analysis of a 5% random sample (n = 403). Network analyses showed a high degree of co-author clustering and little cross-community co-authorship. Content analysis showed that most publications had no author affiliation with Dartmouth (88%, 95% CI = 0.85-0.91), were quantitative observational studies (51%, 95% CI = 0.47-0.57), and cited the Dartmouth Atlas without using its data (71%, 95% CI = 0.67-0.76). Among the 29% publications (n = 116) that directly used Dartmouth Atlas data, most (76%, 95% CI = 0.67-0.83) used the crosswalk tool to define geographic units, and many (45%, 95% CI = 0.36-0.54) used the data as variables in hypothesis testing. Most studies did not acknowledge the data limitations of the Dartmouth Atlas when using its data, though more acknowledged similar limitations for their overall study design that also involved Medicare fee-for-service data. Our results demonstrated the wide impact of the Dartmouth Atlas and suggested potential opportunities for improving data users’ understanding of the critical assumptions in producing the Dartmouth Atlas data.
Keywords
Introduction
The Dartmouth Atlas of Health Care (the “Dartmouth Atlas”) traces its origins to the 1973 Science article by Wennberg and Gittelsohn entitled “Small area variations in health care delivery,” which revealed the previously under-recognized phenomenon that location impacts the medical care patients receive.1,2 Between 1996 and 2022, the Dartmouth Atlas team used Medicare fee-for-service claims data to produce extensive public-use data, research tools, and more than 40 reports, pioneering the analysis and dissemination of population-based measurements of regional and hospital variations in health care delivery. 3 Researchers have extensively used the Dartmouth Atlas data to motivate their research, support their findings, or conduct their own research. 3 Policymakers and the media have also used the Dartmouth Atlas data to reveal healthcare inefficiency and inequities across the United States. 3 During the 2010s, the Patient Protection and Affordable Care Act further leveraged the Dartmouth Atlas reports to establish the accountable care organization, primary care medical homes, and bundled payments to encourage organized care and reduce waste in resources.3,4
Like all data sources, the Dartmouth Atlas data have particular strengths and limitations. Using nationwide datasets, it comprehensively describes healthcare delivery across the United States while allowing granular comparisons between local healthcare markets and hospitals. It also enables researchers to track longitudinal changes in healthcare delivery patterns spanning more than 2 decades. While these are significant strengths, there are also limitations for which all researchers should be accounting. Particularly notable is that fee-for-service claims cannot be generalized to other populations, such as Medicare beneficiaries enrolled in Medicare Advantage, Medicaid beneficiaries, commercially insured persons, or people who are uninsured. Additionally, although the Dartmouth Atlas metrics were adjusted for age, sex, race, price, and/or clinical confounders that potentially contribute to regional variations, adjustments could not be made for factors unavailable in claims data, such as patient preferences and illness severity. These limitations were explicitly articulated in technical reports and the Frequently Asked Questions resources on the Dartmouth Atlas website. 5 They were also regularly noted by the Dartmouth Atlas team when they published using the data. 3 Accordingly, it would be reasonable to assume that data users were aware of how the data should be interpreted. Yet at the same time, these limitations have been the subject of debate both within research communities and in popular press outlets like the New York Times.3,6,7 This community conversation motivated our own team to seek a better understanding of how the Dartmouth Atlas was being used in healthcare research and communication. In this study, we thus hope to understand the impact of the Dartmouth Atlas on health services research with a specific emphasis on who were using its data, how the data were used, and whether the data were used responsibly.
Furthermore, the way we understand regional variations has evolved over time. 8 The initial focus of the Dartmouth Atlas data was to identify unwarranted variations driven by local resource supply and provider preferences, rather than patient demand and preferences. 3 The work highlighted the adverse consequences of unnecessary treatment and revealed inefficiency in the Medicare program. 3 Over time, the research community has recognized that oversupply of healthcare resources in some areas correlates with other areas experiencing undersupply and underuse. 3 Residents in low-use areas are not only subsidizing the care of residents in high-use areas but also may be more prone to inadequate care themselves.3,8,9 Therefore, Dartmouth Atlas researchers, along with other health service researchers, have been paying increasing attention to the relationship between geographic variations, health inequity, and racial disparity.3,8,9 As we examine the impact of the Dartmouth Atlas, we also wished to characterize what topics have been studied by users of the Dartmouth Atlas, especially around health inequity.
Though the Dartmouth Atlas team has used Google Analytics to enumerate website views and data downloads, the team has not yet systematically reviewed how its data and tools are cited and used by the research community. As part of a comprehensive internal evaluation of the Dartmouth Atlas to inform future directions, we conducted a literature network analysis and systematized literature review with probability sampling to study how the Dartmouth Atlas appeared in research publications from 1996 to 2023, including those that used the Dartmouth Atlas data for analysis and those that cited the Dartmouth Atlas to motivate their research question or support their findings. Specifically, we sought to answer 4 descriptive questions:
What are the characteristics of the community of authors citing the Dartmouth Atlas in their research publications?
What types of research publications did the Dartmouth Atlas appear in, and how did the Dartmouth Atlas data appear in those publications?
For publications that used the Dartmouth Atlas data for secondary analysis, did they study health inequity?
For publications using the Dartmouth Atlas data for secondary analysis, do they accurately acknowledge its limitations?
This literature review provides us with new information about the impact of the Dartmouth Atlas project. Despite its policy and research impact, neither Dartmouth team members nor external researchers have described the community of users or assessed the ways that the Dartmouth Atlas has been used in published research. Understanding how shared data is used helps to inform the future of the Dartmouth Atlas as a community data resource. Additionally, understanding how users leverage Dartmouth Atlas data and Medicare fee-for-service claims data in general can help the health services research community to reflect on future directions of small area variations research.
Methods
Protocol and Registration
We aimed to provide a comprehensive overview of how authors use the Dartmouth Atlas in research publications, regardless of their study design, topic, or medium of publication. To map the broad impact of the Dartmouth Atlas and to synthesize diverse types of publications, we followed a scoping review protocol; however, given the large number of publications identified, we modified the standard scoping review protocol by using probability sampling of articles by publication year for full-text review and data extraction. We chose this sampling method for its representative characterization of the Dartmouth Atlas’ use in the medical literature over time.
We registered our protocol on the Open Science Framework. We followed the Preferred Reporting Items for Systematic reviews and Meta-Analyses extension for Scoping Reviews (PRISMA-ScR) and indicated areas where our methods deviate from standard scoping review methodology (Supplemental Table 1). 10
Eligibility Criteria
We included all English-language records between January 1, 1996, and July 24, 2023, that referenced the Dartmouth Atlas data, website, reports, tools, or other publications. Within peer-reviewed publications, we included original research as well as commentaries, narrative reviews, and other academic journal correspondences to examine its prevalence among discussions within the research community. To understand the full user community and their usage, we also included dissertations, reports, working papers, interviews, and other gray literature. We excluded materials written in languages other than English, as well as those with incomplete publication information and false search term hits.
Search and Screening
We searched PubMed, Scopus, and Google Scholar on July 24, 2023, using the following query strings: “Dartmouth atlas of health care” | “Dartmouth atlas” | “Dartmouth health atlas” | “Dartmouth healthcare atlas” | “Dartmouth health care atlas.” We used Publish or Perish to retrieve records from Google Scholar. 11
JW and JZ removed duplicates using Rayyan 12 and Excel based on study title, author names, publication year, journal, abstract, and other retrieved publication information. Duplicates included sources that appeared multiple times in different search engines or those shared in different formats. We then used title and abstract screening to remove non-English sources, sources with incomplete publication information, and false hits that were irrelevant to the Dartmouth Atlas based on our exclusion criteria.
Given that we had crafted a corpus of 8507 publications, we performed full-text screening and then a subsequent extraction on a 5% random sample. We selected a 5% sample to balance between feasibility, in light of limited time and labor, and statistical representativeness, as indicated by a low margin of error. We stratified our sample by year of publication. The number of articles in each stratum varies; as a result, the proportion of articles from each year in our 5% sample reflects the proportion of articles from each year in the total population.
Extraction
From our sample publications, we extracted publication information, study design, usage of Dartmouth Atlas data, limitation reporting related to the Dartmouth Atlas and Medicare fee-for-service claims data, and discussion of health inequity. See the data extraction form in Supplemental Appendix 1.
Seven team members (AB, JW, JZ, CD, PN, EF, and UA) jointly developed a data extraction form piloted on 24 articles. We iteratively modified the extraction form across 5 rounds and refined the language to eliminate ambiguity. Inter-rater agreement improved over time (Supplemental Table 2). Each extractor had to achieve 80% agreement with JZ on 3 test-round articles before proceeding with actual extraction (Supplemental Table 2).
After the pilot rounds, all articles were randomly assigned to 5 team members (JZ, CD, PN, EF, and UA) for final extraction. Discussions between extractors were encouraged to ensure the entered responses reflected group consensus. Extraction instructions were regularly updated to account for new situations not seen in the training period. For quality control, 10% of the articles were randomly selected for spot check by a second extractor, either JZ or UA. We discussed and collaboratively resolved any disagreements. Throughout our research, we asked team members to retrain when disagreements revealed extraction errors. Any unresolved disagreements were adjudicated by AB.
Synthesis
Network Analysis
There is more than a decade of scholarship demonstrating the value of co-authorship network analysis in assessing regional contribution to knowledge generation and the extent of collaborations in health sciences. 13 Collaborations between data creators and data users have been shown to produce the greatest scientific advantage, in part because of greater knowledge about the advantages and limitations of a given dataset. 14 To understand the impact of the Dartmouth Atlas, JW, CB, SL, and JZ used network analysis to examine the co-author relationships among all unique sources that cited the Dartmouth Atlas. Because we extracted from multiple search engines, author name formats varied widely. To address this, CB wrote a Python script that automated normalization, and a second phase of hand-normalization was done by JW. Once the author names were consistent, JW created a co-author network visualization in Gephi, 15 using the OpenOrd, 16 ForceAtlas2, 17 and Noverlap 18 algorithms to create an undirected network graph. We used the Average Degree algorithm to calculate the network average degree, which provided us with information about the density of the entire network and the degree of co-authorship connections for each node. We also used the modularity algorithm to characterize and detect communities within the network.
Content Analysis
Using our 5% stratified random sample of all unique sources that cited the Dartmouth Atlas, we used descriptive statistics to summarize the study design, usage of Atlas data, limitation reporting, and discussion of health inequity. We report count and proportion, and given our probability sampling technique, all descriptive metrics are followed by a 95% confidence interval calculated by the Clopper-Person binomial proportion confidence interval function on STATA. 19 Data cleaning and analysis were done on Excel and STATA. 19
Results
We retrieved 12 044 sources from our literature search. After duplicate removal and title/abstract screening, 8507 sources remained and were used in co-author network analyses.
Data Users and Networks
Co-author relationships among the 8507 sources are shown in Supplemental Figure 1. The network average degree is 7.039, meaning that each author has approximately 7 co-authors in publications that cited the Dartmouth Atlas. The community has a modularity algorithm value of 0.914 (on a range from −1 to +1), suggesting strong density within clusters and sparse connections between them. The average clustering coefficient, a measure of how tight cliques or communities are within a network graph, is high at 0.895 (on a range from 0 to 1), indicating that co-authors tend to form tightly connected groups, or cliques, within the network. Dartmouth Atlas affiliated authors have a much higher degree of centrality (in the top 0.01% of all authors). While some of these affiliated authors like Goodman, Skinner, and Fisher have a tight co-authorship community with one another, others like Wang or Curtis are central to novel communities of co-authorship using Dartmouth Atlas resources.
Study Setting and Design
From our 5% stratified random sample (n = 426) for full-text screening, 403 sources were included in our final sample for content review (Figure 1, Supplemental Table 3). Within our sample, the number of publications increased until around 2016 and then decreased (Figure 2). While network analysis showed a strong Dartmouth-affiliated community of authors, most publications in our sample (88%, 95% CI = 0.85-0.91) were authored by researchers with no Dartmouth affiliation (Table 1, Supplemental Table 4, Supplemental Figure 1). Our sample included 76% (95% CI = 0.72-0.80) academic peer-reviewed journal publications, 10% (95% CI = 0.07-0.13) dissertations in repositories, 6% (95% CI = 0.04-0.09) books, and 7% (95% CI = 0.05-0.10) reports and other materials (Table 1).
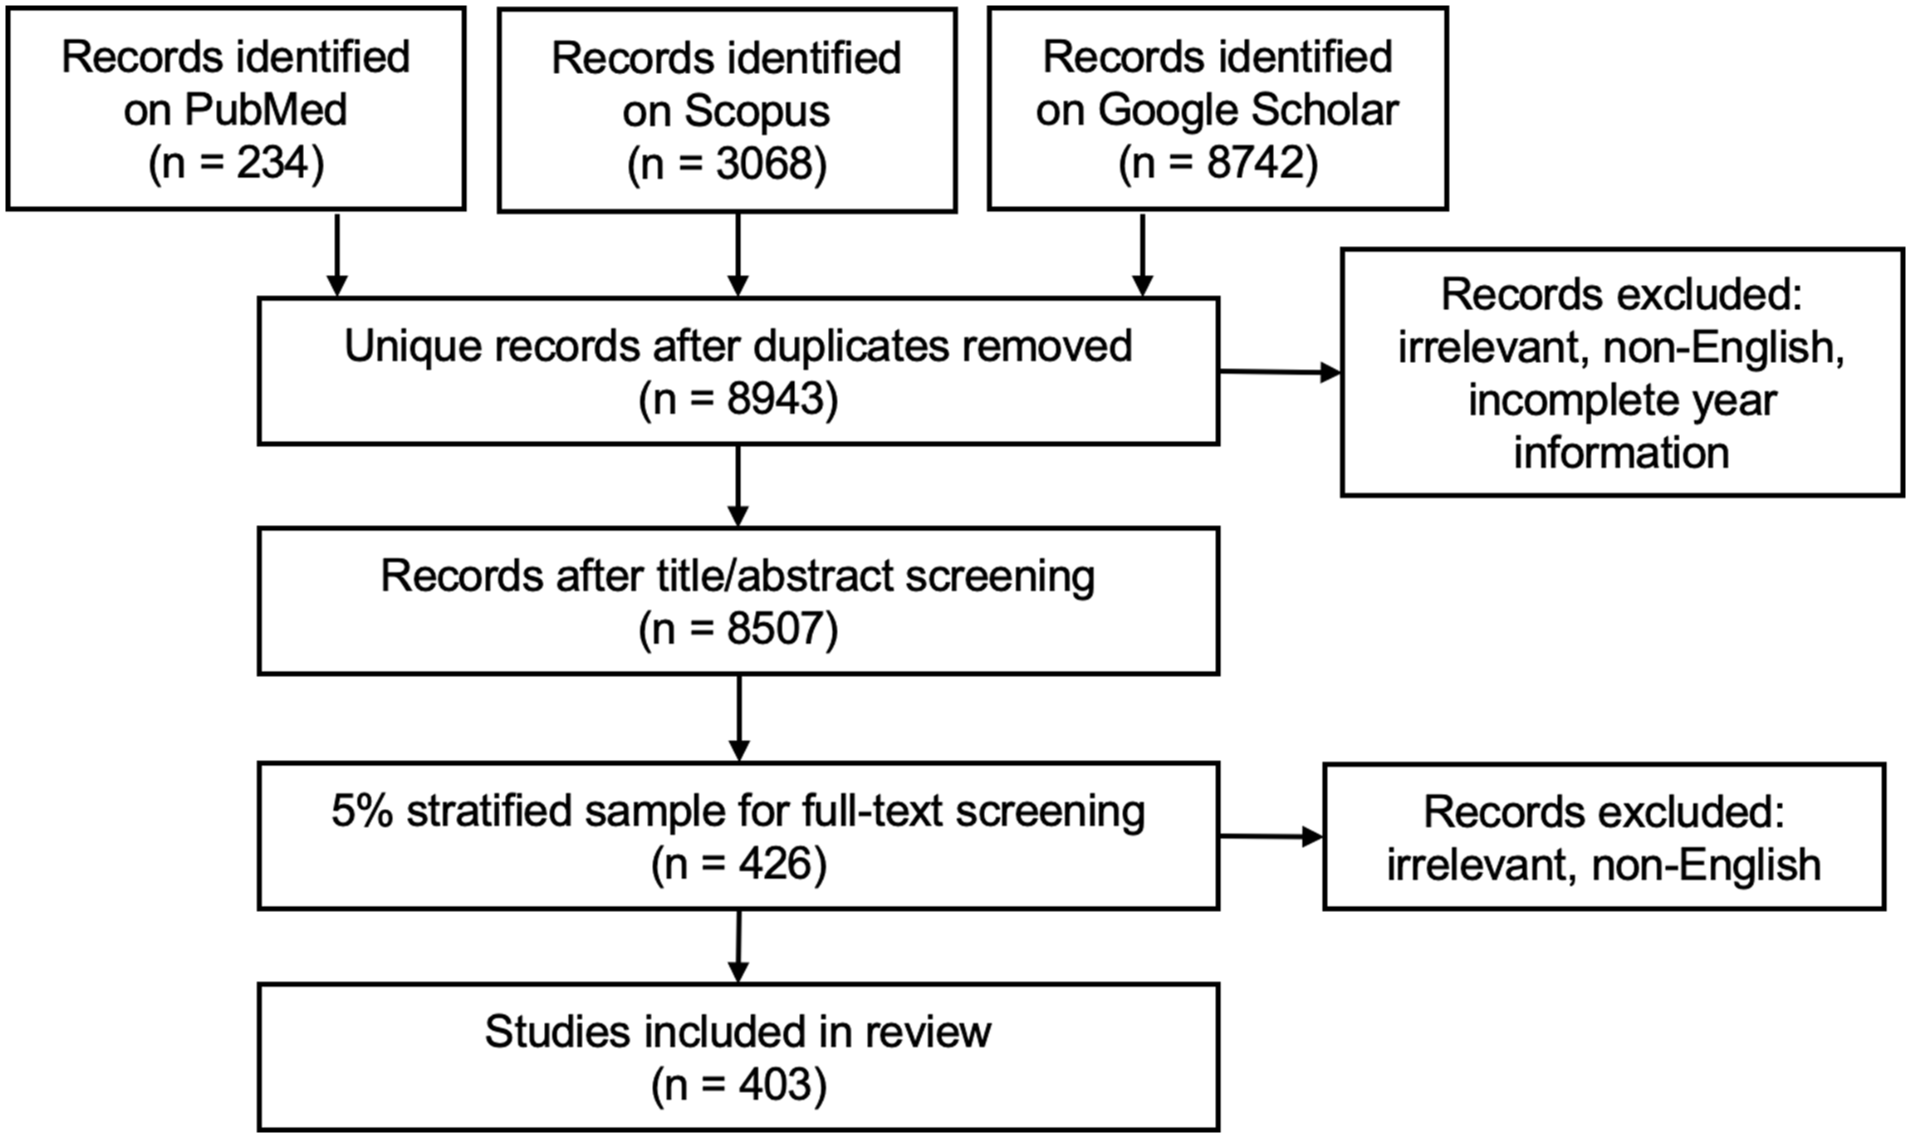
Study selection and sampling.
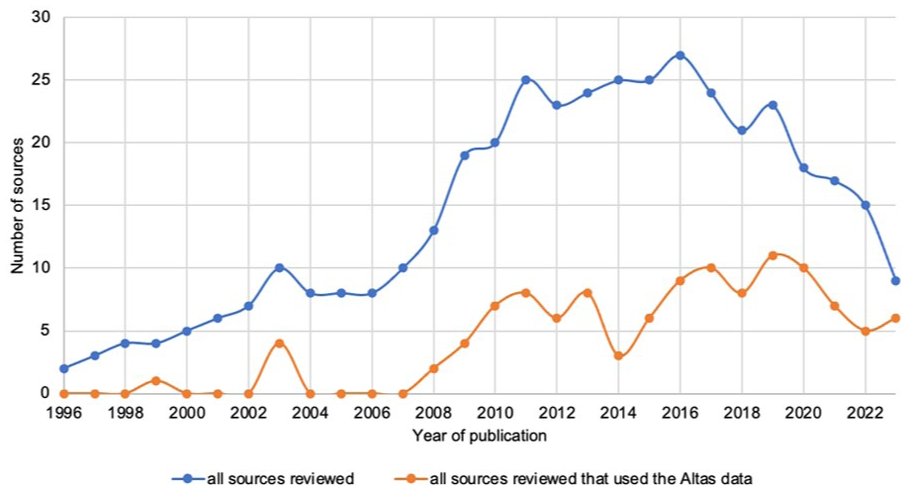
The number of Atlas citations that used the Atlas data in our 5% final sample.
Sample Description.

“Non-original research” includes commentaries, narrative reviews, or other published peer-reviewed journal correspondences that did not produce original research results.
“Others” includes non-peer-reviewed studies or journal publications, such as book chapters, informal reports, presentation slides, handbooks, interviews, recruitment notices, and news reports.
The most common study design was quantitative observational (51%, 95% CI = 0.47-0.57), which included cohort, case-control, cross-sectional, and difference-in-difference studies. The second most common study design (28%, 95% CI = 0.24-0.33) was non-original research, which included commentaries, narrative reviews, or other academic journal correspondences that did not produce original results. There were also 3% systematic reviews (95% CI = 0.01-0.05), 3% qualitative studies (95% CI = 0.02-0.06), and 2% quantitative interventional studies (95% CI = 0.01-0.05).
Usage of the Dartmouth Atlas
Most sources (71%, 95% CI = 0.67-0.76) only cited the Dartmouth Atlas in their background, methods, or discussion sections without using any metrics or tools from the Dartmouth Atlas (Figure 3).

Ways of using the Dartmouth Atlas data.
Among the 116 (29%, 95% CI = 0.24-0.33) articles that used the Dartmouth Atlas data, 76% (95% CI = 0.67-0.83) used the Hospital Referral Region (HRR) or Hospital Service Area (HSA) crosswalk tool to define healthcare service markets (Figure 3). Less than half (45%, 95% CI = 0.36-0.54) used Dartmouth Atlas metrics as variables in hypothesis testing, while 14% (95% CI = 0.08-0.21) used the geographic boundary file to create maps, and 4% (95% CI = 0.01-0.09) used Dartmouth Atlas metrics for sample selection (Figure 3). Almost one-quarter (24.1%, 95% CI = 0.17-0.33) focused their research question on health inequity, including race, age, socioeconomic, environmental, and urban-rural disparities. Almost one-third (30.2%, 95% CI = 0.22-0.39) reported significant health inequity in their results, including studies that did not have inequity as their original research question but made incidental findings on inequity.
Other than the HRR or HSA crosswalk tool, the most common data types used were Hospital and Physician Capacity (13.8%, 95% CI = 0.08-0.21) and Care for Chronically Ill (10.3%, 95% CI = 0.05-0.17). Common constructs that researchers used the Dartmouth Atlas to measure included healthcare expenditure, utilization, quality, outcome, market, and provider density. Among the 52 articles that used Dartmouth Atlas metrics as variables in hypothesis testing, Dartmouth Atlas metrics appeared most often as control variables (40.4%, 95% CI = 0.27-0.55) and as primary predictor variables (36.5%, 95% CI = 0.24-0.51; Figure 3). There was no statistically significant difference between publications with and without Dartmouth authors to use the Dartmouth Atlas data in their analysis (Supplemental Table 4).
Limitation Reporting
For the 116 sources that used the Dartmouth Atlas data, we examined whether they reported the following limitations in their “limitation” section when relevant, including (1) non-generalizable study population, (2) incomplete adjustment, (3) imperfect mapping onto constructs, (4) decedent bias, and (5) imperfect localization of care by HSA, HRR, or other geographic units. A detailed explanation of each limitation can be found in Table 2. The team that created the Dartmouth Atlas made these limitations explicit to help users better understand their data. 5 They also have been extensively debated by researchers and policymakers.5 -7
Limitation of the Dartmouth Atlas Metrics.

About one-tenth of these studies (12.3%, 95% CI = 0.05-0.23) acknowledged that the Dartmouth Atlas metrics from Medicare fee-for-service data do not apply to other populations (Table 2). An additional 40.0% (95% CI = 0.28-0.53) did not acknowledge this specifically to the Dartmouth Atlas but did so for their similar overall study design that analyzed Medicare fee-for-service claims data (Table 2).
Less than one-fifth (18.8%, 95% CI = 0.10-0.30) acknowledged that the Dartmouth Atlas metrics did not adjust for clinical factors unavailable in Medicare claims data (Table 2). An additional 28.1% (95% CI = 0.18-0.41) acknowledged this for their overall study design that analyzed Medicare fee-for-service claims data (Table 2).
About one-fifth (20.3%, 95% CI = 0.11-0.32) acknowledged that the Dartmouth Atlas metrics imperfectly mapped onto the constructs they sought to measure (Table 2). An additional 34.4% (95% CI = 0.23-0.47) acknowledged this for their overall study design (Table 2).
Among the 38 studies that used either “End of Life Inpatient Care” or “Care for the Chronically Ill” metrics, which computed data from decedents’ last 6 months or 2 years of life, 2.6% (95% CI = 0.00-0.14) acknowledged the decedent bias (Table 2). An additional 5.3% (95% CI = 0.01-0.18) acknowledged this for their overall study design (Table 2).
Among the 103 studies that used the HRR or HSA crosswalk tool or other metrics measured on the HRR or HSA level, 17.5% (95% CI = 0.11-0.26) acknowledged that HRR, HSA, or other geographic units created by the Dartmouth Atlas may not accurately localize care for all Medicare beneficiaries due to changes in utilization over time and differences in care patterns between diseases (Table 2).
Discussion
This review aimed to describe several features of the research literature between 1996 and 2023 that cite the Dartmouth Atlas, specifically the authorship network, study design and publication setting, usage of the Dartmouth Atlas, and reporting of the data limitations. The large number of studies (N = 8507) identified that cited the Dartmouth Atlas showed its wide impact on research during this time period.
The network analysis demonstrated that co-authorship clusters within this community are quite distinct, with co-authors publishing together repeatedly and with a low level of cross-community authorship, despite making use of a common resource. This tight co-author clustering may contribute to a potential “creator’s advantage” for Dartmouth authors, which was a phenomenon proposed by Pasquetto et al in their meta-analysis of data produced by 2 large-scale scientific consortia where data creators have been shown to have significant advantages over data re-users in subsequent research and publication using the data they created. 14 However, we also noted that most publications represented in our study sample did not have an author affiliated with Dartmouth, suggesting that the Dartmouth Atlas has reached researchers beyond its home institution. Therefore, the tight clustering between co-authors is likely not limited to Dartmouth authors who created the data, but also within data re-users outside of Dartmouth as well. More research is needed to understand how the co-authorship networks and data creator effects may interact during open data access.
Additionally, the Dartmouth Atlas appeared most frequently in quantitative observational studies, along with commentaries, narrative reviews, and other non-original research in academic journals. These indicated that the Dartmouth Atlas had its largest influence on quantitative observational research and prompted frequent discussions among researchers through academic journal correspondence.
Furthermore, since most sources did not directly use the Dartmouth Atlas data despite citing it in their publications, we believe the Dartmouth Atlas achieved a greater impact by motivating researchers to form their research questions or helping researchers explain their arguments or study results. We showed that the Dartmouth Atlas had a smaller impact as a data source for secondary analysis in original research. This seemed to align with observations made by Pasquetto et al, who showed that researchers prefer to conduct primary research with their own curated data but will use publicly available data to develop and interpret the data they curated themselves. 14 This was further corroborated by the fact that there was a smaller proportion of studies that used the Dartmouth Atlas data among non-Dartmouth publications than Dartmouth-authored publications, though this difference was statistically insignificant in our 5% sample. Further research would be needed to characterize the citation-without-use phenomenon and assess the benefits produced by open data access. Additional study would also be needed to characterize the authorship networks for data-using publications as compared to those that merely cited the Dartmouth Atlas to better understand public data usage.
Among sources that did use the Dartmouth Atlas data in their analyses, we demonstrated that the most popular use of the data was to define health services markets using the HSA, HRR, or other geographic unit tools published by the Dartmouth Atlas team. This confirmed the influence of the Dartmouth Atlas in the field of small-area variation research.2,3 The second most prevalent strategy was to use Dartmouth Atlas metrics as variables in hypothesis testing and data analysis, during which the metrics most frequently appeared as control and primary predictor variables. The heterogeneity in how Dartmouth Atlas metrics appeared in data analysis mirrored the various collections the team has published, including 9 large longitudinal datasets spanning Medicare reimbursement, end of life care, chronic illness care, primary care, mortality, discharge rates, and hospital and physician capacity, as well as 6 special topic datasets and 4 data tools for localizing care to healthcare market or individual hospitals. Furthermore, one-quarter of the studies that used Dartmouth Atlas data in original analyses focused on health inequity. Even studies not primarily centered on health inequity reported them in their findings, underscoring the critical role of Atlas metrics in highlighting differential impacts among groups within healthcare systems. The Dartmouth Atlas team has shown that geography is a potential mechanism by which racial and ethnic differences in health services use and outcomes arise.20 -22 This observation has been reinforced by recent demographic research studying residential racial segregation and its historical origins in the U.S.23,24 Notably, none of the sources provided or interrogated the rationale for race adjustment, despite the fact that race adjustment faces increasing scrutiny in the field of clinical and epidemiologic research.25 -27 We encourage future studies to examine more in-depth how research publications on the Dartmouth Atlas or health services in general have conceptualized racial disparities and health inequity and changed their conceptualization over time through emerging frameworks on health inequity.
Notably, most of these studies did not acknowledge the limitations of the Dartmouth Atlas data, though some acknowledged these types of limitations for their overall study design rather than noting them as specific to the Dartmouth Atlas data. We believe that reporting limitations for the overall design still contributes to transparency and rigor, yet readers might not be able to determine if and how specific constraints apply to the Dartmouth Atlas. About half of the studies acknowledged non-generalizable study population, incomplete adjustment, and imperfect mapping onto constructs for their overall study design or for the Dartmouth Atlas specifically; in contrast, less than one-fifth acknowledged the imperfect localization of care by HSA, HRR, or other geographic units, and only few acknowledged the decedent bias. Recognizing data limitations is crucial for interpreting findings responsibly, and there is ongoing debate about the relevance of findings derived from Medicare data to broader populations. 28 Failing to recognize these limitations has the potential for significant impact given the Dartmouth Atlas’ prominent role in policymaking and research. These impacts may ripple forward through future research if readers are not able to determine whether or how limitations apply and propagate misinterpretation. While our results demonstrate a lack of limitation articulation, whether our data users understood these limitations but did not report them or did not understand them in the first place would require further study. We believe data distributors such as the Dartmouth Atlas have a special responsibility for ensuring data users are made aware of and understand data limitations. Though the Dartmouth Atlas team have made this information available on their webpage and reports, 5 our results showed that we might need to seek additional ways to better help users understand the data. Additional studies are also needed to compare the quality of the limitation reporting of publications from the data source versus publications from outside institutions.
Given the results of this study, we reaffirm that Dartmouth Atlas users should examine whether this dataset aligns with the scope of their research questions and involve other data sources, such as all-payer claims database, linked dataset, electronic health records, or original data collection when needed to address the gaps that Medicare claims alone cannot fill. At the same time, the widespread adoption of HRR, HSA, and other healthcare market delineation revealed in our study demonstrates that Dartmouth Atlas data continue to offer valuable insights in the field of health services research. It has a wide impact in empowering researchers beyond Dartmouth to conduct quantitative observational studies on small area variation research.
Our review has several limitations. First, the Dartmouth Atlas does not have unique identifiers in search databases, and we restricted our search results to English-language sources. Second, we were not able to have multiple screeners or extractors to examine each source due to time and labor constraints. However, our mechanisms for training and quality control ensured the reliability of data extraction. Third, we designed our extraction form based on health services research norms and may have missed the nuances of research from other disciplines. Fourth, for sources without adequate information on their use of the Dartmouth Atlas, we had to make necessary assumptions about their data use. Fifth, we analyzed a sample of all articles published during the study period, rather than the full corpus of sources. Finally, important data such as study topics, modeling strategies, robustness checks, and supplemental data sources were beyond the scope of this current study’s data extraction. Future studies may examine these aspects through a more in-depth review of a smaller subset of articles for additional insights into data users’ areas of interest and methodological rigor.
Conclusion
In conclusion, our literature review and network analysis provided a comprehensive overview of the authorship communities and how researchers in health services and other disciplines cited and used the Dartmouth Atlas from 1996 to 2023 across study designs and publication settings. We demonstrated the wide and enduring impact of the Dartmouth Atlas yet also revealed the potential for misinterpretation due to data users’ lack of limitation reporting specific to the Dartmouth Atlas.
Supplemental Material
sj-docx-1-inq-10.1177_00469580251382062 – Supplemental material for Health Services Researchers’ Use of the Dartmouth Atlas of Health Care: A Literature Review and Network Analysis 1996-2023
Supplemental material, sj-docx-1-inq-10.1177_00469580251382062 for Health Services Researchers’ Use of the Dartmouth Atlas of Health Care: A Literature Review and Network Analysis 1996-2023 by Jingyi Zhang, Eleni Fanouraki, Uma Alagappan, Carleigh Drill, Pulkit Nagpal, Carly Bobak, Sai Lakkireddy, Jacqueline D. Wernimont and Amber E. Barnato in INQUIRY: The Journal of Health Care Organization, Provision, and Financing
Footnotes
Acknowledgements
We acknowledge the contributions of Heather Krause of We All Count for facilitating a year-long self-study of data equity practices at the Dartmouth Institute for Health Policy and Clinical Practice for investigators involved in producing the Dartmouth Atlas of Health Care.
Ethical Considerations
This study only uses published data. It does not involve human subjects and thus does not require review from the Institutional Review Board.
Consent to Participate
This study does not involve human subjects and thus does not require informed consent from human participants.
Author Contributions
All authors have read and approved of the submission of this manuscript. AB, JW, JZ, EF contributed to study concept and design. AB, JW, JZ, EF, CB, SL contributed to acquisition of the data. All authors contributed to analysis and interpretation of data. JZ contributed to drafting of the manuscript, and all authors contributed to critical review and editing of the manuscript.
Funding
The authors disclosed receipt of the following financial support for the research, authorship, and/or publication of this article: This work was supported by Dartmouth College and the John E. Wennberg Distinguished Professorship in Health Policy and Clinical Practice.
Declaration of Conflicting Interests
The authors declared no potential conflicts of interest with respect to the research, authorship, and/or publication of this article.
Data Availability Statement
The datasets generated during and/or analyzed during the current study are available from the corresponding author upon reasonable request.
Supplemental Material
Supplemental material for this article is available online.
References
Supplementary Material
Please find the following supplemental material available below.
For Open Access articles published under a Creative Commons License, all supplemental material carries the same license as the article it is associated with.
For non-Open Access articles published, all supplemental material carries a non-exclusive license, and permission requests for re-use of supplemental material or any part of supplemental material shall be sent directly to the copyright owner as specified in the copyright notice associated with the article.