
Abstract
To evaluate changes in enrollment, average risk scores, and premiums in the Affordable Care Act individual market after states transitioned from the federally facilitated marketplace (Healthcare.gov) to a state-based marketplace (SBM) between 2018 and 2023. This study employed a retrospective, quasi-experimental design of secondary data using a synthetic difference-in-differences analysis methodology. Our primary data source consisted of individual market risk adjustment summaries from 2016 to 2023. We conducted a synthetic difference-in-differences analysis to evaluate changes in enrolled member months, average premium paid, and state average risk scores in the individual health insurance market. Our treatment group comprised 4 states that transitioned from Healthcare.gov to a state-based marketplace between 2018 and 2023. The comparison group was the 33 states that continuously used Healthcare.gov from 2016 to 2023. States that converted from the FFM, Healthcare.gov, to a state-based marketplace did not experience statistically significant changes in enrollment, premiums paid, or state average risk scores. These results were robust to alternative specifications. The transition to state-based marketplaces in 4 states did not lead to significant changes in the ACA individual market risk pool enrollment, or premiums paid while potentially increasing state policy autonomy. Future policy efforts should explore how states can leverage policy autonomy to improve market outcomes and coverage.
Keywords
Average monthly premium collected did not change after a transition to an SBM
The total number of enrolled member months remained stable.
Average risk scores in the ACA individual market did not change.
Introduction
The Affordable Care Act (ACA) has dramatically expanded access and enrollment in health insurance since 2014 in a collaborative federal-state partnership.1 -4 States are the primary regulators of health insurance companies. State or federally facilitated marketplaces have played an important role in the implementation of the ACA, as the marketplace operates the website, determines eligibility for subsidies, engages in outreach to potential enrollees, and funds advertising.5,6 Healthcare.gov is the federally facilitated marketplace (FFM). Since 2014, between 32 and 40 states have used Healthcare.gov in any year. The remaining states use a state-based marketplace (SBM). SBMs allow for local branding, advertising and operational decisions such as the length of open enrollment periods and availability of special enrollment periods that differ from the decisions made by the FFM.7,8 SBMs may also link to other state government databases while allocating resources to fit local priorities.9 -11 States choose to operate SBMs. The transition from the FFM to a SBM is a 2-year process. By 2025, 31 states elected to use the FFM, while 20 states, including Washington DC, operated their own SBM. This study examined enrollment, premium and risk score impacts of 4 states transitioning from the FFM to SBMs between 2018 and 2023.
The initial experience from 2014 to 2018 suggested that states operating SBMs were more effective at enrolling individuals into ACA health insurance plans. 12 These results may be confounded by the strong partisan dynamics surrounding the implementation of ACA individual health insurance marketplaces.13,14 SBMs, with their local branding such as Kynect and Covered California, may have created cognitive distance from a large, and at times extremely unpopular federal law.3,15 An SBM may have allowed for a denationalized policy feedback loop through improved awareness and attribution of the law’s impacts, advantages and challenges. 16
The initial SBM states substantially differed from FFM states in 2014. States with SBMs in 2014 consisted of states that had reliably voted for Democratic candidates at the national level, had Democrats in key policy implementation veto points and had chosen to expand Medicaid eligibility as early as possible. Local elite support or opposition to the goals of the ACA also affected the implementation of supportive programs such as enrollment and program navigation assistance. 13 The initial choice to use or transition to either the FFM or SBM was not always policy related, as several states had technological failures in their 2014 SBMs and converted to the FFM for 2015 or 2016. 17 Idaho intentionally transitioned from the FFM to an SBM in 2015. 18
The average risk score in a state may have improved after a state transitioned from the FFM to its own SBM due to enhanced regulatory flexibilities. SBMs are able to fund independent navigator assistance and advertising that may increase enrollment among low-risk individuals. 19 Randomized control trials using Covered California data have demonstrated that targeted outreach using SBM controlled data frequently resulted in enrolling individuals in coverage who were likely to have comparatively low medical expenses.20 -23 Reducing administrative burdens by eliminating token premiums has been shown to also positively select enrollees with low expected costs and low medical risk.24,25 SBM advertising has been shown to increase enrollment. 5 These flexibilities, among others, may have led to healthier individuals to enroll which would be reflected in lower state average plan liability risk scores (PLRS). Lower risk scores could plausibly lead to lower premiums which may lead to higher enrollment for individuals who do not receive premium subsidies.
Advocates suggested that SBMs could be used to lower operating costs and maintain political protection for the marketplaces.7,26 Between 2018 and 2023, 6 states have transitioned from the FFM to an SBM. Three more large states, Georgia, Illinois, and Virginia, have or will transition from the FFM to an SBM between 2024 to 2026. 27 Several more states have indicated interest in operating their own SBM. However, little is known how these transitions between the FFM and SBMs change enrollment, average premiums paid and the level of predictable cost risk of individuals enrolled, both on-Exchange and off-Exchange, (referred to as the risk pool) in the ACA individual market. In this work, we aim to fill this gap by analyzing these outcomes among 4 states that transitioned from the FFM to an SBM between 2018 and 2023, had continual FFM usage prior to the transition after 2016 and did not merge the small group and individual health insurance markets. We used a novel data source, the risk adjustment summary files for this analysis. State and federal policymakers may use these findings in their decision-making process as to which platform they choose to use.
Data and Outcomes
The primary data was the 2016 to 2023 Supplemental Appendix A Risk Adjustment Summary Reports published by the Centers for Medicare and Medicaid Services (CMS) for the individual market. 28 Risk adjustment is a permanent program of the ACA. 29 Insurers submit enrolled member demographic information and claims to CMS with diagnosis codes and prescription drug information in order to receive a risk score. Insurers with higher than state-year average risk scores received monetary transfers from insurers that had lower than average state-year risk scores. These datasets were released in the summer following the conclusion of a contract year. Premiums were the enrollment weighed average pre-subsidy premium and enrolled member months were all paid months of individual market enrollment as reported by insurers to CMS and the Internal Revenue Service. The state average plan liability risk score (PLRS) was calculated by CMS using the annually updated HCC model. The PLRS was reported at the state-year level.29,30
We supplemented this data with the Kaiser Family Foundation Medicaid Expansion Status Tracker to create a state-year binary indicator for Medicaid Expansion at any point in a year due to states transferring substantial portions of low income enrollment from the ACA individual market to Medicaid.31,32 We used the CMS provided Section 1332 data to create a state-year binary indicator for the presence of a state reinsurance program. 33 Reinsurance lowers gross premiums and may have increased enrollment for higher income enrollees while the minimum cost of subsidized coverage increased which may have led to lower enrollment for middle income enrollees who received partial premium subsidies.34,35
Our main outcome of interest was the change in state-year enrolled member months after a state converted from the FFM to SBM. This outcome included both on-exchange and off-exchange enrollment. We used the natural log of enrolled member months to enhance interpretability. Our secondary outcomes were the average premium collected and the state-year plan liability risk score, which is a nationally standardized measure of the coded predicted risk in the individual health insurance market. 29 The 4 states of interest were (New Jersey, New Mexico, Nevada, and Pennsylvania) which switched from the FFM to an SBM between January 1, 2018, and January 1, 2023. We excluded Maine despite transitioning to an SBM in 2023 as the state had merged its individual and small group markets in 2022. We excluded Kentucky as it switched from an SBM to the FFM in 2017 before switching back to an SBM on January 1, 2022. The control group was the set of states that have never switched from the FFM to an SBM (Exhibit 1) during the study period. We analyzed a total of 296 state-years including 12 state-years after an FFM to SBM conversion.28 -35
Analytical Approach
In order to estimate the effect of states’ switch from FFM to SBM on-enrolled member months, average premium paid, and statewide risk score, we used the synthetic difference-in-differences strategy. 36 Before conducting the main analysis and to validate our research design, we first examined whether the enrollment of the SBM-operating and FFM-operating states moved in a similar pattern, that is, the parallel trends assumption, using a non-parametric event study specification. The event study analysis allowed us to assess the trends between the intervention and control groups before the policy change. Initial analysis using an event study design (Supplemental Appendix A, inclusive of event studies and Wald Test (Supplemental Appendix Table A1)) did not support the parallel trend assumption needed to make causal statements with a staggered difference-in-differences analysis.
Due to the violation of parallel trends, we resorted to synthetic difference-in-differences (SDID). This methodology weakens the parallel trends assumption by constructing a weighted combination of control units that more closely match the pre-treatment trends of the treated units. 36 It formally estimated the effect of the switch by solving the similar 2-way fixed effects regression with the unit (here, state) and time (here, year) weights. The unit weights were calculated to align the weighted average of the outcome of unexposed units (here, states that have always used the FFM between 2016-2023) with the average outcome of the exposed units (here, states switched to SBM between 2018-2023) for all years pre-switch. Time weights, on the other hand, were computed to balance pre-exposure time periods with post-exposure ones for unexposed units. The usage of these weights increased the precision of the estimator by forming a more credible counterfactual for the treated units. Unit weights emphasized units that, on average, were similar in terms of their past to the treated units, and time weights emphasize periods that were, on average, similar to the treated periods. The estimator is asymptotically normal and zero-centered under appropriate conditions, with further details in Supplemental Appendix B. 36
The proposed method has been modified to incorporate the staggered adoption of SBM by states. Here, treated units transitioned to SBM in different years while control states remain on the FFM throughout the study period. The sample was divided into sub-samples based on the transition date. Then, the SDID estimator was applied repeatedly, once for every adoption date. Finally, a weighted average of the estimators was calculated, with the weight equal to the fraction of treated unit/time-period pairs in each sub-sample. Inference was based on the placebo method clustered by the states and conducted over the final average treatment effect on the treated.
The estimands were obtained by applying SDID described above. All analysis was conducted in Stata MP 18.5. Significance is determined by a P-value of less than .05. We did not apply for institutional review board review as all data is aggregated, public use files.
Results
Figure 1 shows which states, including Washington DC, have consistently used Healthcare.gov from 2016 to 2023. Twelve states have continually operated an SBM while 32 states have constantly used the FFM. Figure 2 shows the key assumption of parallel trends is supported for the synthetic difference-in- differences analysis. States that switched from the FFM to an SBM during the study period all had expanded Medicaid unlike the comparison group which had only 54% of state-years with Medicaid Expansion (Table 1). The states that had transitioned from the FFM to an SBM were all notably different over the study period on both policy and outcome variables.

State utilization of Healthcare.gov 2016-2023.

Synthetic difference-in-differences: SBM switch on log enrollment.
Characteristics of Intervention and Control States.
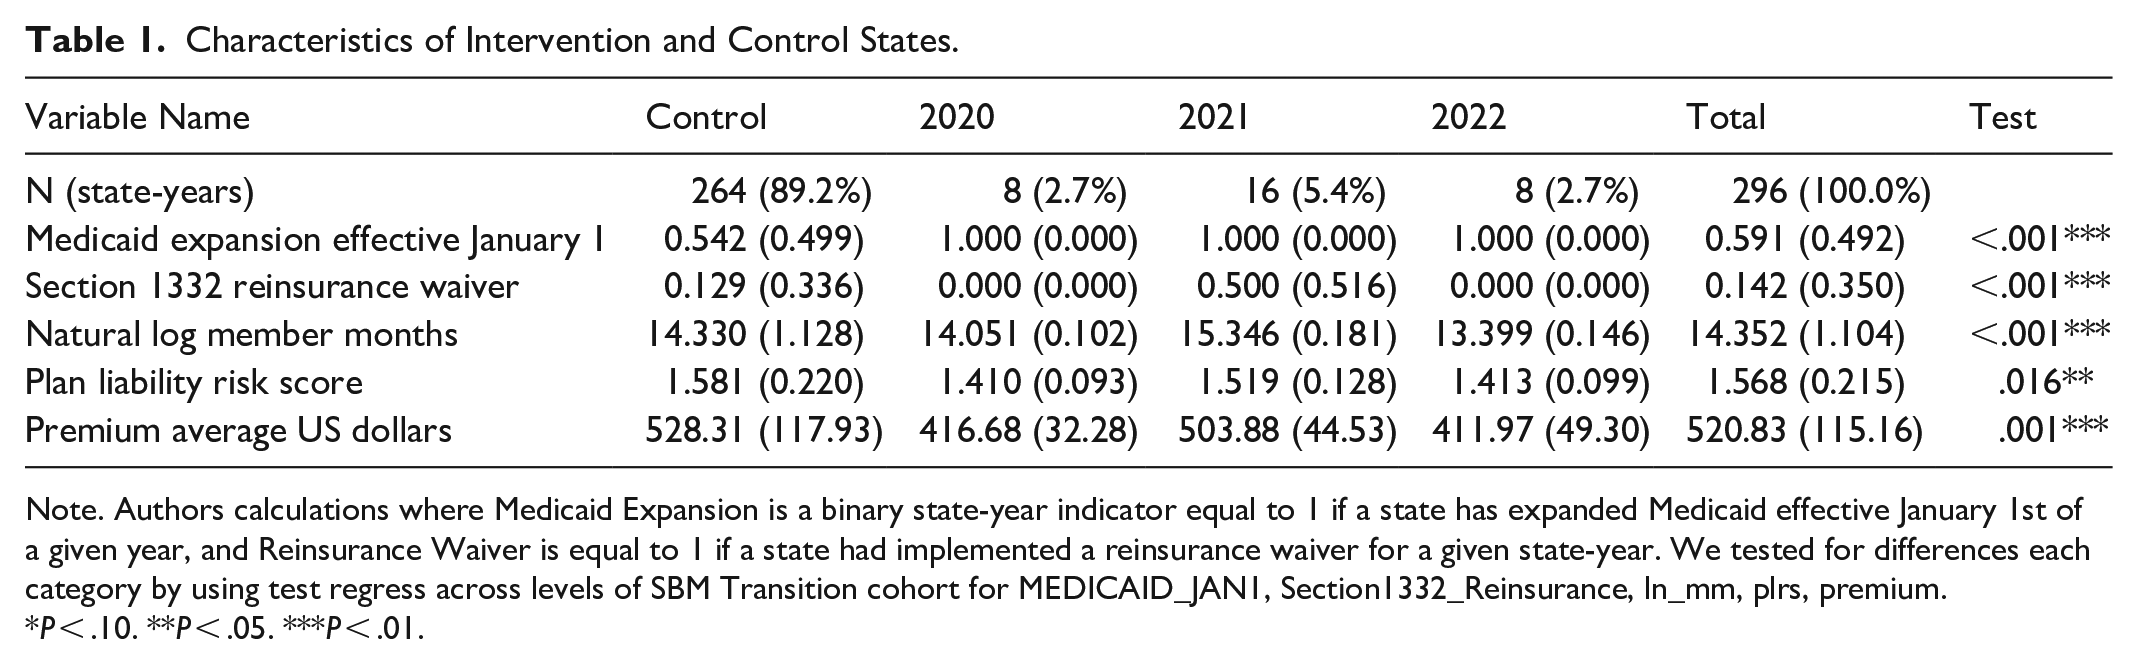
Note. Authors calculations where Medicaid Expansion is a binary state-year indicator equal to 1 if a state has expanded Medicaid effective January 1st of a given year, and Reinsurance Waiver is equal to 1 if a state had implemented a reinsurance waiver for a given state-year. We tested for differences each category by using test regress across levels of SBM Transition cohort for MEDICAID_JAN1, Section1332_Reinsurance, ln_mm, plrs, premium.
P < .10. **P < .05. ***P < .01.
The central finding of our study in Table 2 was a statistically insignificant decline of 0.0770 (P = .192 [−0.1928, 0.0387] ) logged member months in the individual marketplace after a state transitioned from the FFM to its own SBM. Risk scores as measured by the plan liability risk factor (PLRS) had an insignificant increase of 0.0326 (P = .223 [−0.01986, 0.08513]). Average monthly collected premium had an insignificant increase of $14.81 (P = .561 [−$35.07, $64.69]). Heterogeneity analysis where only a single state is examined produced similar results in magnitude and insignificance (Table 3). All results were similar to all leave one out permutation robustness checks.
Pooled Outcomes for States Converting to a State Based Marketplace After Using the Federally Facilitated Marketplace.

Note. Table presents the pooled effect of states’ switching from FFM to SBM on log enrolled member months (Ln(MM), plan liability risk score, and average monthly premium per member ($).
Standard errors and 95% confidence interval in brackets are presented based on Large-Sample approximations. Observations are state-year. The estimands are obtained by applying synthetic difference-in-differences introduced by Arkhangelsky et al. 36 This method weakens reliance on parallel trends assumption by reweighing the untreated units and makes their weighted pre-exposure trends parallel to the treated units (NV, NM, NJ, and PA). States that were always using SBM or always treated states (CA, CO, CT, DC, HI, KY, MD, MA, MN, NV, NM, OR, RI, VT, and WA), switchers on and off (KY), states that had a merged market (ME) and states that moved from SBM to FFM (HI and OR) were dropped. Due to differential timing in moving to SBM, the estimator is applied repeatedly, once for every crossing year. The reported estimate is thus, a weighted average of the estimators, with weights equal to the fraction of treated states/year pairs in each subsample. Finally, due to the small sample size, the result presented is based on the placebo method of SDID.
State Specific Outcomes After Converting to a State Based Marketplace From the Federally Facilitated Marketplace.

Note. Table presents state specific effects from switching from FFM to SBM on log enrolled member months (Ln(MM), plan liability risk score, and average monthly premium per member ($).
Standard errors in parentheses and 95% confidence interval in brackets, based on Large-Sample approximations. Observations are state-year. The estimands are obtained by applying synthetic difference-in-differences introduced by Arkhangelsky et al. 36 This method weakens reliance on parallel trends assumption by reweighing the untreated units and makes their weighted pre-exposure trends parallel to the treated units (NV, NM, NJ, and PA). States that were always using SBM or always treated states (CA, CO, CT, DC, HI, KY, MD, MA, MN, NV, NM, OR, RI, VT, and WA), switchers on and off (KY), states that had a merged market (ME) and states that moved from SBM to FFM (HI and OR) were dropped. Finally, due to the small sample size, the result presented is based on the placebo method of SDID.
P < .10. ** P < .05. *** P < .01.
As sensitivity checks, we re-analyzed the data using the same SDID framework but included state-year indicators for Section 1332 reinsurance waivers and Medicaid Expansion. We had 2 definitions for Medicaid Expansion, the first was Medicaid Expansion in a given year and the second definition was Medicaid Expansion in a state on January 1st of the year. The results were similar in magnitude, direction and statistical insignificance. We also performed a leave one out permutation test where a control state was excluded from an analysis run. 37 Results were similar in magnitude, direction and statistical insignificance.
Discussion
Our findings suggest that transitioned from Healthcare.gov to a state-based marketplace (SBM) did not result in significant changes in ACA individual market enrollment, average paid premiums, or risk scores. These results remained robust across various sensitivity analyses, including permutation testing and single-state evaluations. While prior expectations and policy arguments suggested that SBMs may have enhanced enrollment through increased state autonomy and tailored outreach efforts, our analysis does not provide strong evidence to support these claims. Moreover, our evidence suggests that any increases in enrollment are likely to be small (<.0387 logged member months) with large error bands for changes in premium, and at most, small decreases in state average plan liability risk scores.
States that opted to transition to SBMs often did so with the expectation of improving consumer engagement and enrollment outcomes. For instance, New Jersey intended to substantially increase outreach and advertising to support enrollment on their state’s new marketplace. 38 An issue brief prepared for the state of New Hampshire argued that operating an SBM gives states enhanced flexibilities that could be used to facilitate enrollment. 39 New Mexico has leveraged their SBM to add state-funded subsidies, reduce administrative burden of CSR plans by renaming them as Turquoise plans and create a new subsidy formula that differs from the default federal formula.40,41 Our results do not provide strong evidence for or against the success or failure of these policies.
The transition from the FFM to an SBM may create administrative burdens for enrollees. 42 CMS and new SBMs engage in a long process of synchronizing data, mapping current enrollees to new plans that they will be automatically re-enrolled to and other tasks to make the transition from the FFM to a new SBM as smooth as possible. However, there are still friction points which may increase transition and hassle costs. These friction points could include the need to re-establish new log-on credentials and pointing current enrollees to a new website. Prior research has found that the imposition of small administrative burdens in the form of making token premiums can substantially reduce or shift in time enrollment and renewal.25,43 Gurel has suggested that Healthcare.gov has generated a substantial competitive advantage over state-based marketplaces by reducing administrative frictions for broker assisted enrollment through the use of Ref. 44 Enhanced Direct Enrollment (EDE) allows for brokers to use a single sign-on portal and to serve multiple states from a single application. Through the 2024 Open Enrollment Period, no state-based marketplace had EDE-like functionality. Further investigation is needed to determine the role of brokers as a means of reducing learning and compliance costs for lower income enrollees.
Limitations
The decision to switch enrollment platforms was not random. The 4 states examined in this time period are systematically different from states that have always used the FFM. The 4 intervention states had partial or complete Democratic state governments during the study period. The states made the decision to switch during the first Trump Administration but most of the post-transition period occurred during the Biden Administration. These 2 administrations have substantially different policies to support or repel enrollment in the ACA individual health insurance markets.45,46 Future transitions that were planned during the Biden Administration will be implemented during the second Trump administration and may have different impacts as the federal policy environment will differ. We are also unable to observe state-level changes in advertising or outreach in this study. Additionally, New Jersey and New Mexico instituted supplementary state funded premium subsidies concurrently with the switch to the SBM; however, this would lead to a bias of increased enrollment. Finally, the standard errors are large and may reflect measurement error due to the small number of intervention states. This limits our ability to generalize our findings to other states and other times.
Conclusions
States that are considering SBM conversions should consider the association of the conversion to minimal or negative enrollment changes after this conversion. States engaging in SBM conversions should take steps to minimize all potential conversion friction points. Other state goals such as increased political and policy autonomy may be considered as primary objectives of this substantial policy change.
Supplemental Material
sj-docx-1-inq-10.1177_00469580251371893 – Supplemental material for Changes to ACA Individual Insurance Markets After States Leave Healthcare.gov 2016-2023
Supplemental material, sj-docx-1-inq-10.1177_00469580251371893 for Changes to ACA Individual Insurance Markets After States Leave Healthcare.gov 2016-2023 by David M. Anderson, Sukriti Beniwal and Salpy Kanimian in INQUIRY: The Journal of Health Care Organization, Provision, and Financing
Supplemental Material
sj-docx-2-inq-10.1177_00469580251371893 – Supplemental material for Changes to ACA Individual Insurance Markets After States Leave Healthcare.gov 2016-2023
Supplemental material, sj-docx-2-inq-10.1177_00469580251371893 for Changes to ACA Individual Insurance Markets After States Leave Healthcare.gov 2016-2023 by David M. Anderson, Sukriti Beniwal and Salpy Kanimian in INQUIRY: The Journal of Health Care Organization, Provision, and Financing
Supplemental Material
sj-xls-3-inq-10.1177_00469580251371893 – Supplemental material for Changes to ACA Individual Insurance Markets After States Leave Healthcare.gov 2016-2023
Supplemental material, sj-xls-3-inq-10.1177_00469580251371893 for Changes to ACA Individual Insurance Markets After States Leave Healthcare.gov 2016-2023 by David M. Anderson, Sukriti Beniwal and Salpy Kanimian in INQUIRY: The Journal of Health Care Organization, Provision, and Financing
Footnotes
Author’s Note
Sukriti Beniwal is now affiliated to Dartmouth University, Hanover, NH, USA.
Ethical Considerations
We did not apply for institutional review board review as all data is aggregated, public use files.
Funding
The authors received no financial support for the research, authorship, and/or publication of this article.
Declaration of Conflicting Interests
The authors declared the following potential conflicts of interest with respect to the research, authorship, and/or publication of this article: Dr. Anderson has received consulting fees from Alliant Health Plans, Evensun LLC, Meapta LLC, and Silverspread Consulting LLC for non-related ACA work and from Pharmaceutical Care Management Association for Medicare Part D work. He has received research funding from the Commonwealth Fund, AHRQ and the Pharmacy Care Management Association Foundation for non-related work. Ms. Beniwal has no conflicts to declare. Ms. Kanimian has no conflicts to declare.
Data Availability Statement
All data is available upon request to the corresponding author; no restrictions on the use of the data are placed.
Supplemental Material
Supplemental material for this article is available online.
References
Supplementary Material
Please find the following supplemental material available below.
For Open Access articles published under a Creative Commons License, all supplemental material carries the same license as the article it is associated with.
For non-Open Access articles published, all supplemental material carries a non-exclusive license, and permission requests for re-use of supplemental material or any part of supplemental material shall be sent directly to the copyright owner as specified in the copyright notice associated with the article.