
Abstract
We investigate whether the membership of a non-profit hospital’s CEO on its board of directors is associated with CEO pay and several measures of hospital performance, including price, operating margin, quality, and service to low-income patients. Although the consequences of CEO board membership for for-profit firms have been studied extensively, the consequences for non-profits in general, and non-profit hospitals in particular, have received less attention. Because most hospitals are non-profit and non-profit hospital prices have increased rapidly over the past 20 years, this gap is important. We use regression models to estimate the association between various measures of hospital performance and CEO board membership, holding constant fixed effects denoting the hospital’s county of location, hospital board size, and other hospital characteristics. We find a strong positive association between CEO board membership and non-profit hospital prices, operating margins, and CEO pay, with a weaker positive (negative) association between CEO board membership and quality (service to low-income patients). We conclude that non-profit hospitals’ CEO board membership is likely associated with increases in agency costs due to a lack of separation between management and control.
Highlights
● We use regression models to estimate the association between various measures of hospital performance and CEO board membership, holding constant fixed effects denoting the hospital’s county of location, hospital board size, and other hospital characteristics.
● We find a strong positive association between CEO board membership and non-profit hospital prices, operating margins, and CEO pay, with a weaker positive (negative) association between CEO board membership and quality (service to low-income patients).
● We conclude that non-profit hospitals’ CEO board membership is likely associated with increases in agency costs due to a lack of separation between management and control.
Introduction
Does the membership of an organization’s CEO on its board of directors affect the organization’s performance? CEO board membership has risen over the past century, 1 but fallen over the past decade. 2 Corporate governance theory suggests that boards have 2 roles: to provide strategic direction for the organization and to mediate agency conflicts between the organization and its management. 3 In this framework, CEO board membership can reduce or increase the costs of agency conflicts. On one hand, it can establish a “unity of command” in the organization and facilitate the board’s use of management’s private information to enhance the organization’s value. 4 On the other hand, it can reduce the independence of the board from management and thereby impede the ability of the board to punish the CEO’s failure to pursue the organization’s interests. 5 The existence and relative importance of these 2 effects is therefore an empirical question.
Most empirical corporate governance research has focused on the consequences of CEO board membership for for-profit firms. The consequences of non-profit CEO board membership have received less attention. Non-profits differ from for-profits in fundamental ways. Non-profits have no shareholders and typically have broader goals than simple maximization of revenues minus costs. However, like for-profits, non-profits also face agency conflicts between the organizations’ management and their intended beneficiaries. At least in theory, both types of organizations seek a control structure that achieves the organization’s objectives with the least amount of resources.
The consequences of CEO board membership for non-profits may be even more important than the consequences for for-profits. Fama and Jensen suggest that the costs of agency conflicts that impede the ability of non-profits’ boards to punish opportunistic behavior by non-profits’ CEOs are so great that non-profits’ management should never serve on their boards. 5 Yet because of the breadth of non-profits’ goals, “unity of command” may be even more important in non-profits as well.
In this paper, we examine non-profit CEO board membership in a large sector primarily composed of non-profits: the hospital industry. In 2021, US hospitals accounted for $1.3 trillion in spending 6 ; of the 730 495 short-term acute care hospital beds, 521 403 (71.4%) were owned by private non-profit organizations. 7 We use data from 5 sources – IRS Form 990s, the AHA National Health Care Governance Survey (AHA NHCGS), the AHA Hospital Survey, Medicare, and the RAND Transparency Initiative – to create 2 samples of non-profit hospitals containing information on hospitals’ characteristics, governance, and performance. We describe 2 aspects of the governance of non-profit hospitals using IRS Form 990s and the AHA NHCGS – the number of members of the board of directors and whether the CEO is a member of the board. We examine the association of these aspects of hospital governance (holding constant other hospital characteristics and county fixed effects) with each hospital’s price to commercially-insured patients; operating margin; quality; service to low-income patients; and CEO pay.
As we discuss in more detail below, our analysis contributes to 3 literatures. First, and most broadly, it contributes to research on the consequences of organizations’ governance practices, in particular non-profit organizations. Second, it contributes to research on the determination of non-profit hospital performance, in particular pricing and quality. Hospital pricing has become an extremely important policy issue. From 2000 to 2022, hospital prices have increased faster than in any other sector, 8 and price growth has been higher at non-profits as compared to for-profits. 9 Although price growth is not necessarily socially harmful (eg, if accompanied by quality growth), a large literature suggests that much of the growth in prices for health services is due to failures of competition and other unproductive rent seeking, with adverse consequences for wages and employment in the economy as a whole. 10 To our knowledge, no previous work has examined the relationship between non-profit hospitals’ CEOs’ board membership and prices or quality. Third, it contributes to research on the determination of CEO pay, in particular the role of agency conflicts.
We find strong positive associations between CEO board membership and non-profit hospital prices, operating margins, and CEO pay, with weaker positive (negative) associations between CEO board membership and quality (service to low-income patients). Our results are consistent with Brickley et al who show a positive association between non-profit hospital CEO pay premia and boards with “insider” members. 11
Our findings provide evidence for both of the competing effects of CEO board membership hypothesized in corporate governance theory. On one hand, we find evidence that CEO board membership is associated with increases in the costs of agency conflicts. CEO board membership is positively associated with CEO pay. Hospitals with CEOs on their boards have higher prices and operating margins – goals for which other studies show CEOs are rewarded – despite the fact that higher prices and margins may not be in society’s overall interest. 10 Conversely, hospitals with CEOs on their boards have less service to low-income patients – a goal for which other studies show CEOs are not rewarded – despite the fact that service to low-income patients may be in society’s overall interest. On the other hand, we also find evidence that CEO board membership is associated with at least 1 socially beneficial measure of hospital performance – quality. This finding is inconsistent with a theory that does not consider how CEO board membership can reduce the costs of agency conflicts.
The paper proceeds as follows. Section II reviews prior research on corporate governance with a focus on the governance of non-profits and non-profit hospitals in particular. Section III describes our data and our models. Sections IV and V present and discuss our results, and Section VI concludes.
Prior Research
The consequences of CEO board membership have been the subject of extensive debate in corporate governance research. 12 According to corporate governance theory, CEO board membership can reduce or increase the costs of agency conflicts between an organization’s management and its intended beneficiaries. One arm of this literature explains how CEO board membership establishes a “unity of command” in the firm by vesting authority over both governance and management in a single individual. This work emphasizes the reduction in agency costs that can result from explicitly linking the development and implementation of a firm’s strategic direction. 4 Another arm explains how CEO board membership reduces the independence of the board from its management. This work emphasizes the increase in agency costs that can result from opportunistic behavior by the CEO that takes advantage of the lack of separation of management and control. 5
The existence and relative importance of these 2 effects is an empirical question. A large empirical literature has investigated the relationship between for-profit organizations’ performance and the degree of the board’s independence from management. In the for-profit context, “the evidence that conventional measures of board independence matter is inconclusive.” 13 Of course, this work recognizes that interpreting these “effects” is difficult because they may be heterogeneous or due to a third, unobserved factor associated with both characteristics and profitability.
Similar evidence from non-profit hospitals is also mixed. Molinari et al examine the association between CEO board membership and operating margin using data on 90 California hospitals from 1985 to 1990. 14 They find that CEO board membership is positively associated with operating margin. Alexander and Lee find that non-profit hospitals governed by “corporate-model” boards, which they characterize as less independent, generally have higher occupancy, admissions, and market share than those governed by “philanthropic-model” boards, which they characterize as more independent. 15 In contrast, Collum et al find that the presence of hospital management on the boards of 637 non-profit and public hospital boards is negatively associated with total margin, but that the association between CEO board membership and total margin is statistically insignificant. 16 Bai finds no association between the presence of physicians on California non-profit hospital boards and community benefits (such as uncompensated care spending), 17 but Ragland and Plante find that non-profit hospitals with physicians and health administrators on the board have less restrictive guidelines for charity care. 18
To our knowledge, no previous work has investigated the association between CEO board membership and non-profit hospital price or quality. Two papers, however, find that board characteristics more generally are associated with hospital quality, which suggests that there may be a relationship between CEO board membership and quality. Based on a survey of 722 chairpersons of non-profit hospital boards, Jha and Epstein find that hospitals with board chairpersons who report that quality of care is 1 of 2 top priorities are more likely to have high quality as measured by the Hospital Quality Alliance program. 19 Based on surveys of 104 (predominantly public) hospitals in the US and the UK, Tsai et al find that hospitals with boards that pay greater attention to clinical quality have management that better monitor quality performance. 20
Empirical corporate governance research also provides inconclusive evidence about the relationship between for-profit CEO pay and board independence. 21 However, the few papers that investigate the relationship between non-profit CEO pay and board independence report a negative effect, consistent with the concerns expressed by Fama and Jensen. Babenko et al find that CEO pay dropped by 2% to 3% when New York legislation reduced the ability of non-profits’ CEOs to influence their own pay. 22 Newton finds that non-profit CEOs’ perquisites and pay relative to employees are negatively associated with an index of non-profit organizations’ governance quality, which is partially determined by board independence. 23 The paper most similar to ours finds a positive association between non-profit hospital CEO pay premia and boards with “insider” members. 11
This paper seeks to fill the gaps in prior research. First, we provide new evidence about the relationship between non-profit hospital CEO board membership and the price and quality of care. Second, we extend the existing literature about the relationship between board independence and hospital financial performance to examine CEO board membership in particular. Third, we estimate the association between CEO board membership and CEO pay to update and refine the analysis in Brickley et al.
Data and Methods
Data
We use data from 5 sources – IRS Form 990s, the AHA National Health Care Governance Survey (AHA NHCGS), the AHA Hospital Survey, Medicare, and the RAND Transparency Initiative. We create 2 distinct samples of non-profit hospitals containing information on hospitals’ characteristics, governance, and performance.
The first sample (Sample I) matches 2021 data from IRS Form 990s on boards with 2021 data from the AHA Hospital Survey, Medicare, and RAND. Sample I consists of 1742 hospitals. The second sample (Sample II) matches 2021 to 2022 data from the AHA NHCGS (or 2018 data, when 2021-2022 data do not exist) with 2021 or 2018 data from the AHA Hospital Survey, Medicare, and RAND. As we describe below, using data from 2 different years of the AHA NHCGS significantly expands the size of Sample II. Sample II consists of 741 hospitals. No hospitals in Sample II appear in both 2018 and 2021 to 2022. We describe each data source in turn.
IRS Form 990s
We obtained the Form 990 filings for non-profit hospitals from the IRS website. 24 Form 990 is the tax return filed by non-profit organizations. Form 990 contains the names of all members of non-profit hospitals’ boards. Form 990 is indexed by the filer’s employer identification number (EIN). We determined which EINs belonged to non-profit hospitals, along with a crosswalk between EIN and Medicare’s unique hospital identifier (CCN, or CMS Certification Number), from Community Benefit Insight, a website developed and maintained by the Research Triangle Institute. 25 We counted the number of unique individuals listed on each hospital’s Form 990 who were members of the hospital’s board (capping the number of board members at 100).
Form 990 also reports which members of each hospital’s board, if any, were key employees of the hospital and if they were key employees, their title and total pay. We follow the approach outlined in Song et al for determining which key employee is CEO. 26 We flag a key employee to be considered for classification as CEO if the employee had one of the following strings (or a closely-related misspelling) in the employee’s title:
CEO or chief executive
Pres
Chief admin
Chief
Administrator
If >1 key employee has a title with one of these strings, we choose the employee with the string that is ranked highest; if >1 key employee has a title in the highest-ranked string, we choose the employee with the highest pay.
Form 990 data are indexed by EINs – which are unique to a tax-exempt entity, whereas all of the other data are indexed by CCNs, which are unique to a Medicare-designated inpatient facility. An EIN may include multiple CCNs. When we use data from Form 990s, we roll up all the other sources of data to the EIN level using the EIN-CCN crosswalk from Community Benefit Insight discussed above. When we roll up CCN-level data to the EIN level, we construct raw sums of the number of beds and the components of operating margin and patient-weighted averages for all of the other variables, with patient counts from the 100% Medicare claims data used to construct HHIs. Rolling up the CCN-level data to the EIN level in Sample I aggregates the 1742 hospitals into 1354 EINs, which are the basis for our Sample I models.
AHA NHCGS
The American Hospital Association conducted surveys of its member hospitals’ CEOs in 2018 and 2021 to 2022. The response rate for the 2018 survey was 26.2% (=1316/5031); the response rate for the 2021 to 2022 survey was 17.8% (=933/5232). 27 These surveys both included questions about the number of members on the hospital’s board and whether the CEO was a voting member of the board. Our analysis sample includes 2021 to 2022 data for those hospitals that report 2021 to 2022 data, and 2018 data (when reported) for those hospitals that do not report 2021 to 2022 data. 28
AHA Hospital Survey
From the 2018 and 2021 AHA Hospital Survey, we obtained data on non-profit ownership, teaching (whether the hospital has >20 full-time-equivalent resident physicians-in-training), and system (whether the hospital is a member of a multi-hospital system) status; and the number of beds (fewer than 100, 100-299, 300-699, 700 or more). These facility characteristics may be associated with board characteristics, and previous research has shown that these facility characteristics are associated with measures of hospital performance. 29
Medicare
We obtained from the National Academy for State Health Policy Hospital Cost Tool 2018 and 2021 data on operating margin (= [net operating revenues – operating costs]/net operating revenues) and the proportion of a hospital’s services provided to patients with low incomes (= [billed charges for patients classified as charity care, uninsured, bad debt, Medicaid, SCHIP, and other low-income program participants]/total billed charges). 30
We calculated 2018 and 2021 Hirschman-Herfindahl Indices (HHIs) of hospital market concentration based on 100% MEDPAR inpatient hospital claims data, 31 defining the HHI for hospital j during year t, HHIjt, as

where j and k index hospitals and patient zip codes, respectively; ajkt is the share of elderly Medicare patients who live in zip k admitted to hospital j, for all k within 100 mi of j; and bkjt is the share of patients admitted to hospital j who live in zip k, for all j within 100 mi of k. The bkjt-weighting assumes that the characteristics of hospital j’s market depends on the weighted average of all of the zip-code patient residence areas that it serves. In calculating the HHI, hospitals that are members of a system are considered to be 1 entity; and shares ajkt and bkjt are based on all hospitals that admit Medicare patients, not just the hospitals in Samples I and II.
RAND Transparency Initiative
We obtained data on each hospital’s price for inpatient services to commercial insurers from rounds 4 (based on 2018-2020 data) and 5 (based on 2020-2022 data) from the RAND Transparency Initiative. 32 RAND reports the ratio of the actual private allowed amount (ie, the actual including amounts payable by the health plan and the patient) divided by the Medicare allowed amount for the same services provided by the same hospital. The actual private allowed amounts are actual transaction amounts from private employer-sponsored health plan claims, not billed charges; the universe of claims on which the allowed amounts are based varies by hospital.33,34 RAND also reports each hospital’s CMS Hospital Compare star rating (ranging from 1 to 5). CMS Hospital Compare star ratings summarize a variety of measures across 5 dimensions of quality: mortality, safety, readmission, patient experience, and timely and effective care. 35 Doyle et al show that the measures underlying the star ratings are positively associated with patient health outcomes and therefore valid assessments of true quality. 36
Methods
Our regression models estimate the association between various measures of hospital performance and CEO board membership, holding constant fixed effects denoting the hospital’s county of location, hospital board size, and other hospital characteristics. These regression models are of the following form:

where
i indexes hospitals (for models based on Sample II) or EINs (for models based on Sample I);
αc is a county fixed effect;
Yi is ln(commercial price index), star quality rating, CEO pay, low-income patient mix, or operating margin;
Xi is a vector of board characteristics, including indicator variables for the CEO holding board membership (for models based on Sample I), the CEO holding voting board membership (for models based on Sample II), and board size (<11 members, 11-17 members, base group >17 members);
Zi is a vector of hospital characteristics including the HHI, indicator variables for hospital bed size (<100 beds, 100-299 beds, 300-699 beds, base group >699 beds), indicator variables for teaching and system status, and year = 2021 (for models based on Sample II, which include a mix of data from 2018 to 2021-2022); and
εi is an error term.
Results
Table 1 presents descriptive statistics on the variables used in our analysis. Panel A of the Table presents statistics from the AHA Hospital Survey. The first column shows that there are 2648 short-term, general medical/surgical non-profit hospitals from 1560 unique counties in the US. The second and third columns report descriptive statistics for Sample I. The second column reports descriptive statistics for the full Sample I of 1742 hospitals (1354 EINs); the third column reports descriptive statistics for the 884 hospitals (698 EINs) in Sample I that also have data from RAND. The fourth and fifth columns report descriptive statistics for Sample II. The fourth column reports descriptive statistics for the full Sample II of 741 hospitals; the third column reports descriptive statistics for the 611 hospitals in Sample II that also have data from RAND. We do not roll up hospitals in Sample II to the EIN level because it is unnecessary; unlike IRS Form 990s, the AHA NHCGS reports board data at the hospital level.
Descriptive Statistics, US Non-Profit General Medical Short-Term Hospitals.

Comparing the results in Panel A across columns shows that the hospitals in Samples I and II are larger and more likely to be teaching hospitals than the average US non-profit hospital. System membership among the hospitals in Samples I and II is more similar to system membership among all US non-profit hospitals. Hospitals in Sample I have slightly lower system membership (although hospitals in Sample I with data from RAND have system membership ie, almost identical to the US average, compare 0.770-0.769), whereas hospitals in Sample II have slightly higher system membership.
Panel B of the table presents statistics from Medicare. Panel B shows that the distributions of the HHI and the proportion of low-income patients in Samples I and II are similar to the distribution in all US non-profit hospitals. The hospitals in Samples I and II generally have higher operating margins than those of all US non-profit hospitals, although the operating margin for hospitals in Sample I is almost identical to the margin in all US non-profit hospitals.
Panels C and D, respectively, present statistics from IRS Form 990s and the AHA NHCGS. These panels show that most non-profit hospitals’ CEOs are members of the hospital’s board, and voting members in particular – depending on the sample and data source, between 56.6% and 68.3%. This is similar to the 57.8% share of CEOs who served as the chairperson of their firm’s board during the 2000 to 2011 period in the sample of NYSE and Amex-listed firms analyzed by Graham et al, although smaller than the share of S&P 500 CEOs who served as chairperson of their firms’ boards of 47% in 2019 and 41% in 2023. 2
The panels also show that non-profit hospital boards are large relative to for-profit firms’ boards in general, even boards of very large firms. According to Form 990s, the average hospital board has 15.6 members, with 10 (17) members on the 25th (75th) percentile hospital’s board; according to the AHA NHCGS, the average hospital board has 16.7 members, with 13 (18) members on the 25th (75th) percentile hospital’s board. By comparison, the average firm analyzed by Graham et al had 8.96 board members, and the average S&P 500 firm had 10.7 members in 2019 (10.8 members in 2023, Spencer Stuart 2024).
Panel C also shows that the average CEO pay in our Form 990 sample was approximately $1.6 million in 2021. This is larger than the average CEO pay in 2019 of $1.3 million reported by Jenkins et al, although their sample included fewer unique EINs than ours (N = 868 in 2019, compared to N = 1354 in 2021 in Sample I). Panel D does not report statistics on CEO pay because the AHA NHCGS does not contain this information.
Panel E shows that the average commercial price indices in our samples were very similar (2.47-2.48), that is, that the average commercial price charged by hospitals in those samples was 247% or 248% of the amount that Medicare would have paid for the same patient mix. The average star quality rating in the 2 samples was also very similar (3.3-3.4).
Figure 1 provides additional detail about Sample II and the overlap between Samples I and II. Of the 741 hospitals in Sample II, 343 have data from 2018 and 398 have data from 2021 to 2022. Of the 398 hospitals with 2021 to 2022 data, 146 have no Form 990 data and 252 have Form 990 data. Of the 252 hospitals (209 EINs) that have 2021 to 2022 AHA NHCGS data and 2021 Form 990 data, the board statistics are very similar. According to Form 990s, 67.9% of CEOs were board members in 2021; according to the AHA NHCGS, 69.6% of CEOs were voting board members in 2018/2021 to 2022. The distribution of board sizes across the 2 data sources were also similar.

Additional detail, AHA board survey and form 990 samples.
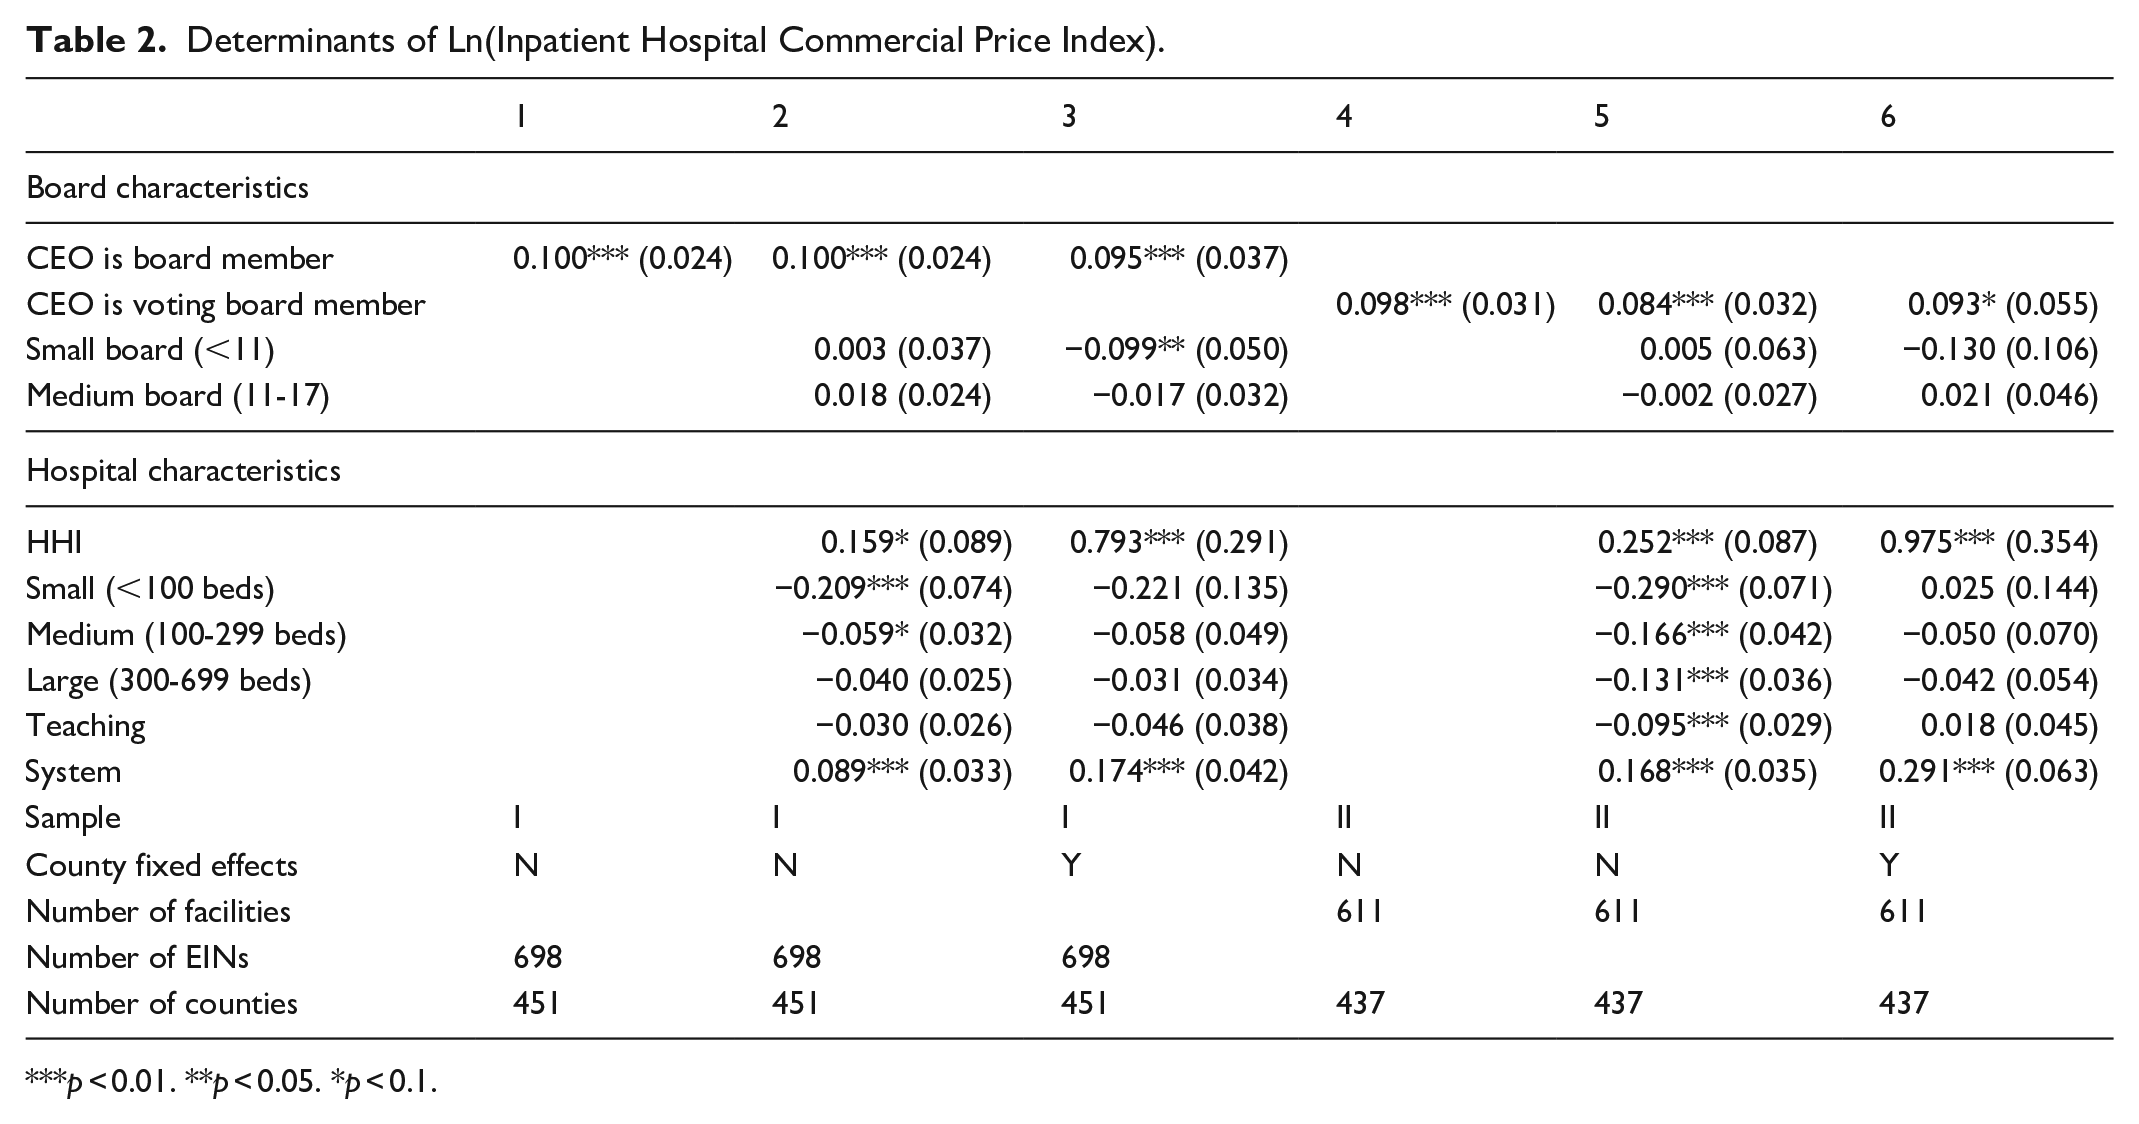
Table 2 presents estimates that have ln(commercial price index) as the dependent variable. Columns (1) to (3) of the table show that hospitals with a CEO on the board charge commercial prices that are 9.5% to 10% higher; hospitals with a voting CEO on the board charge commercial prices that are 8.4% to 9.8% higher, with varying degrees of statistical significance depending on specification (columns [4]-[6]). Controlling for other board and hospital characteristics has little effect on the estimate’s magnitude. In our most comprehensive model (columns [3] and [6]) the range of estimates across Samples I and II is even more narrow, 9.3% to 9.5%. The association between board size and price is weaker; in Sample I, hospitals with small (<11 member) boards have statistically significantly 9.9% lower prices than hospitals with large (>17 member) boards, but only in a model with county fixed effects. Coefficients on the HHI are consistent with other work documenting a positive association between hospital market concentration and hospital prices 37 ; coefficients on the system indicator are consistent with other work documenting a positive association between system membership and prices holding constant market concentration. 38
Determinants of Ln(Inpatient Hospital Commercial Price Index).
p < 0.01. **p < 0.05. *p < 0.1.
Table 3 presents estimates that have star quality rating as the dependent variable. The Table shows that hospitals with a CEO on the board (voting or not) have a star quality rating that is approximately 0.2 to 0.4 stars higher (on a scale of 1-5) in 5 of the 6 variants of our model. On a mean quality of 3.3 to 3.4 (Table 1), this amounts to a difference of approximately 10%. The effect is negative and statistically insignificant in a model based on Sample II with county fixed effects (column [6]). The association between quality and board size is weaker, although there is some evidence of a positive gradient in models based on Sample I.
Determinants of Inpatient Hospital Quality Star Rating.

p < 0.01. **p < 0.05. *p < 0.1.
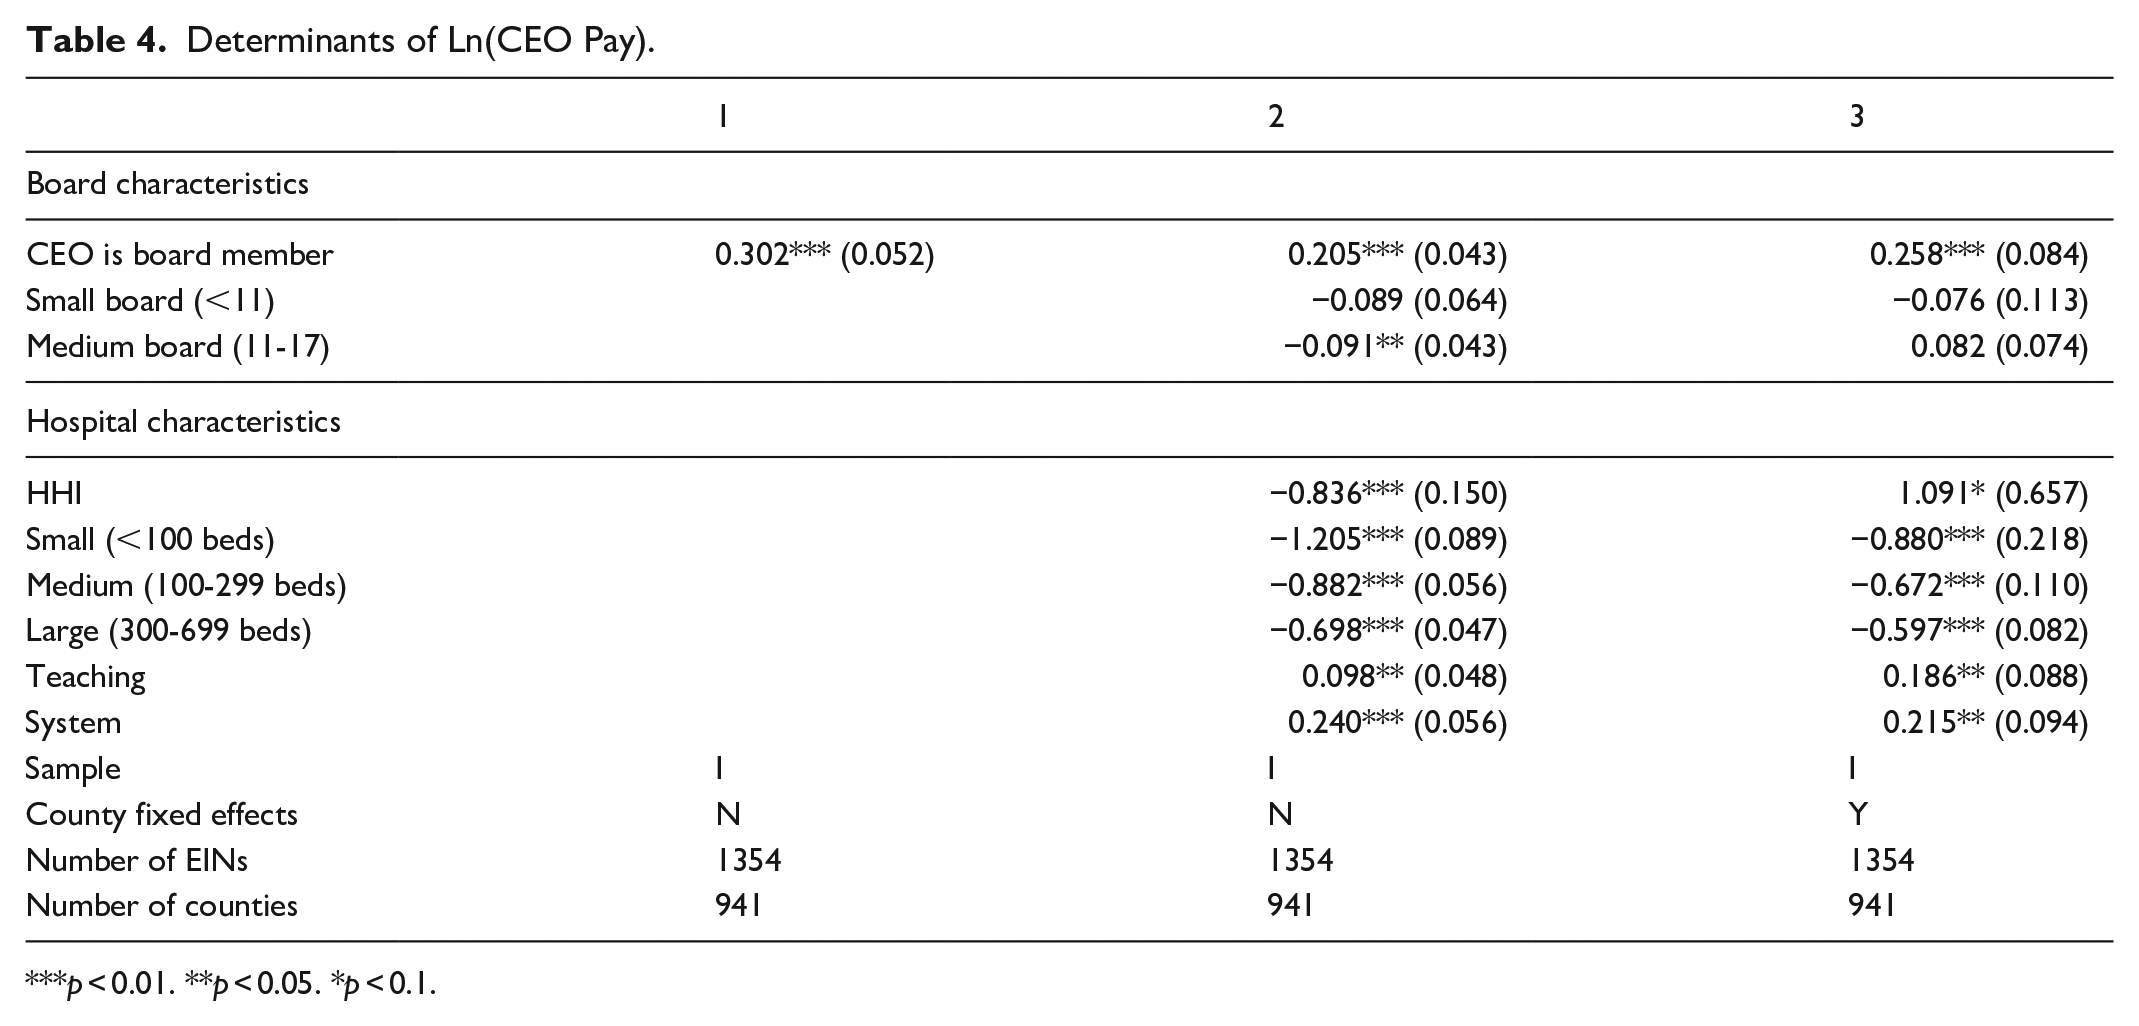
Table 4 presents estimates that have ln(CEO pay) as the dependent variable. All estimates in the table are based on Sample I since neither the AHA Hospital nor the AHA NHCGS includes information on CEO pay. The table shows that CEOs who are members of their hospitals’ boards are paid 20% to 30% more than those who are not. CEO pay is positively associated with board size (ie, CEOs of hospitals with larger boards are paid more) in a model without county fixed effects, but this effect disappears once county fixed effects are included. CEOs of larger and teaching hospitals are paid more. In a model with county fixed effects, CEOs of system hospitals and hospitals in concentrated markets (which have higher prices, Table 2) are paid more.
Determinants of Ln(CEO Pay).
p < 0.01. **p < 0.05. *p < 0.1.
Table 5 presents estimates that have low-income patient mix as the dependent variable. Low-income patient mix is significantly negatively associated with CEO board membership in Sample I. On a mean low-income patient mix of approximately 0.2 (Table 1), the estimated effect of approximately −0.02 in columns (1) to (3) amounts to a difference of approximately 10%. There is not a systematic association between board size and low-income patient mix, although hospitals with small boards (<11 members) treat more low-income patients than do hospitals with large boards (>17 members) in all specifications, statistically significantly in Sample I.
Determinants of Low Income Patient Mix.

p < 0.01. **p < 0.05. *p < 0.1.
Table 6 presents estimates that have operating margin as the dependent variable. Operating margin is significantly positively associated with CEO board membership in Sample I. On a mean operating margin of approximately 0.127 (Table 1), the estimated effect of approximately 0.015 to 0.030 in models (1) to (3) amounts to an approximate difference of 12% to 24%. This is consistent with Table 2 (hospitals with higher prices have higher operating margins, all else equal). The other coefficients on HHI, hospital size, and system status are consistent with those in Table 2 as well.
Determinants of Operating Margin.

***p < 0.01. **p < 0.05. *p < 0.1.
Discussion
Understanding how the presence of a non-profit hospital’s CEO on its board of directors affects its performance is relevant to several areas of economic research. According to corporate governance theory, CEO board membership can have 2 opposing effects. Bringing the board closer to management can reduce agency costs, if management has better information than the board on the organization’s operations. This same phenomenon can also increase agency costs by making it more difficult for the board to punish the CEO’s failure to pursue the organization’s interests. Although this tradeoff has been investigated extensively for for-profit firms, less work has investigated how it applies to non-profit organizations or non-profit hospitals in particular. Because the terms of this tradeoff might be even more dramatic for non-profits as compared to for-profits, this gap is important.
The determinants of hospital performance have always interested health economists, but in recent years, health economists have become very interested in 1 aspect of that performance – pricing. Despite the fact that most hospitals are non-profit organizations, hospital prices in general, and non-profit hospital prices in particular, have increased faster than other sectors. To the extent that a conflict between the private interests of non-profit hospitals’ CEOs and their organizations’ broader goals have caused even a small part of this increase, the effects of non-profit hospital CEO board membership are relevant to public policy. Non-profit hospitals, like non-profit organizations more generally, hold a highly privileged tax law position. Donations to non-profit hospitals are tax deductible, and non-profit hospitals are essentially untaxed on the revenues in excess of costs that they earn. At least in theory, the governance of non-profit hospitals is supposed to contribute to patient and social welfare in exchange for the hospitals’ favorable tax treatment.
In this paper, we examine the consequences of non-profit hospital CEO board membership for hospital performance. We find a strong positive association between CEO board membership and non-profit hospital prices, operating margins, and CEO pay, with a weaker positive (negative) association between CEO board membership and quality (service to low-income patients).
Our results are consistent with the findings in the prior empirical literature. Our results are consistent with Brickley et al who show a positive association between non-profit hospital CEO pay premia and boards with “insider” members. Our results are also consistent with several recent papers that examine the incentives of non-profit hospital CEOs. Indeed, our results suggest that CEO board membership may be 1 of the underlying factors behind these papers’ findings. Jenkins et al find a positive association between non-profit hospital CEO pay and revenues in excess of costs, but not the volume of charity care. 39 Lewellen et al find that “CEO pay and turnover are sensitive to financial performance but are unresponsive (or less responsive) to nonfinancial goals, including the quality of medical treatment, patient satisfaction, and charity provision.” 40 Mulligan et al find non-profit hospital CEO pay has “a stronger relationship with financial performance than with non-profit performance measures.” 41 Kramer and Santerre find a positive association between non-profit hospital CEO pay in Connecticut and the substitution of privately-insured for uncompensated-care and publicly-insured patients. 42
Our findings provide evidence for both competing effects of CEO board membership hypothesized in corporate governance theory. On 1 hand, we find evidence that CEO board membership increases the costs of agency conflicts along the lines suggested by Fama and Jensen. CEO board membership is positively associated with CEO pay, holding other board and hospital characteristics constant. Hospitals with CEOs on their boards charge higher prices and operating margins – goals for which other studies show CEOs are rewarded – even though higher prices and margins may not be in society’s overall interest. Conversely, hospitals with CEOs on their boards provide less service to low-income patients – a goal for which other studies show CEOs are not rewarded – even though service to low-income patients may be in society’s overall interest.
On the other hand, we also find evidence that CEO board membership is positively associated with at least 1 socially beneficial measure of hospital performance – quality. This finding is consistent with the “unity of command” theory suggested in Finkelstein and D’Aveni: CEO board membership could decrease the costs of agency conflicts by facilitating the board’s use of management’s private information to improve quality.
The magnitudes of our estimates suggest that the costs of increases in agency conflicts associated with CEO board membership likely exceed the benefits of decreases in agency conflicts. We estimate that CEO board membership is associated with 10% higher inpatient hospital prices to the commercially insured. RAND does not report the price in dollars for inpatient hospital services to the commercially insured (our analysis uses the price relative to Medicare rates) so it is not possible to express our effect in dollar terms without additional assumptions. Instead, RAND reports the average price for an inpatient hospital stay including both hospital and professional (mostly physician) services, which was $28 944 in 2020 to 2022. 43 To convert this value into a price for inpatient hospital services only, we multiply it by the share of total commercial insurance payments for both inpatient and outpatient services in the RAND sample going to hospitals. In the RAND sample, commercial insurance payments for hospital and professional services, both inpatient and outpatient, were $25.767 billion in 2020 to 2022, with $22.049 billion going to hospital and $3.718 billion going to professional services. 44 Under the assumption that the share of the price of an inpatient stay going to hospitals is equal to the share of total payments for inpatient and outpatient services going to hospitals, the average price in dollars for inpatient hospital services to the commercially insured in 2020 to 2022 was $24 768 (=$28 944 × [$22.049/$25.767]). A 10% increase in this price is approximately $2477.
Patients are willing to pay much less than $2477 for a quality increase of the magnitude suggested by our estimates. Trenaman et al estimate that Medicare beneficiaries were willing to pay $1698 more for a hospital with a 1-star higher rating on clinical outcomes, over twice their willingness to pay for a 1-star higher rating on patient experience or safety. 45 Since board membership is associated with a quality increase of at most 0.4 stars, this implies that the additional quality associated with CEO board membership is worth at most $679 (=0.4 × $1698), assuming that the willingness to pay for a 1-star higher overall rating is equal to the willingness to pay for a 1-start higher rating on clinical outcomes (which according to Trenaman et al it is not).
Our paper has several limitations. Most important, because our research design is observational in nature, we cannot rule out the possibility that differences in hospital performance by CEO board membership status are due to differences in hospital or board characteristics not measured by our control variables (or endogeneity in the measurement of our control variables) that are positively associated with both performance and CEO board membership. We also cannot rule out the possibility that CEO board membership is itself caused by hospital performance, for example, that hospitals appoint CEOs to their boards in response to positive financial performance or declines in service to low-income patients. In addition, our measure of quality is coarse and far from comprehensive, despite its widespread use and validation. These limitations mean that our quantitative assessment of the costs and benefits of CEO board membership should be viewed with particular caution.
Future work might further investigate the consequences of other characteristics of hospital boards. Although board size and independence from management have been extensively examined in corporate governance research, board characteristics that have particular relevance for hospitals (other than boards’ focus on quality) have received less attention. Future work might also examine whether board characteristics and their consequences have changed over time and their association with measures of performance other than the 5 we consider here.
Conclusion
CEO board membership involves a tradeoff for non-profit hospitals. On one hand, it is associated with higher CEO pay, higher prices, and lower service to low-income patients, all of which suggest that CEO board membership increases the costs of agency conflicts. On the other hand, it is associated with higher quality, which suggests that CEO board membership decreases the costs of agency conflicts. Based on the magnitudes of our estimates, we conclude that the costs of increases in agency conflicts associated with CEO board membership likely exceed the benefits of decreases in agency conflicts, although our calculations should be viewed with caution given that the associations we measure do not necessarily represent causal effects.
Footnotes
Acknowledgements
Both authors contributed to all aspects of the conduct of this study and the preparation of this paper. This paper appeared in working paper form as NBER Working Paper 33278. We would like to thank Ross Levine, Paola Sapienza, and participants in the Hoover Research Seminar on Economics and Politics for extremely helpful comments. All errors are our own.
Ethical Considerations
This paper does not use any data on human or animal subjects, so ethical approval is not required.
Consent to Participate
This paper does not use any data on human subjects, so is informed consent/patient consent is not required.
Funding
The author(s) received no financial support for the research, authorship, and/or publication of this article.
Declaration of Conflicting Interests
The author(s) declared the following potential conflicts of interest with respect to the research, authorship, and/or publication of this article: Kessler has received speaking and consulting fees from insurers, integrated delivery systems, and other providers of medical products and services including the distributor defendants in the national prescription opiate litigation. He also serves as a senior adviser at Cornerstone Research.
Data Availability Statement
The data in this paper are publicly available, except for data obtained from the American Hospital Association, which were used under license and cannot be retransmitted. License can be obtained from the American Hospital Association, 155 N. Wacker Drive, Chicago, IL 60606. The publicly available data are available from the authors on request.
Trial Registration/Grant Number
This paper is not a trial and received no grant support.