
Abstract
This study aimed to compare 3 commonly used frailty assessment tools to examine their agreement and classification discrepancies, with the goal of informing more accurate frailty screening and personalized intervention planning in older adults. I analyzed data from the Korean Frailty and Aging Cohort Study (KFACS), a nationally representative dataset, including 3011 community-dwelling older adults aged 70 to 84 years. The CHS Frailty Index, Korean version of the FRAIL scale, and Korean Frailty Index were used. Participants’ general health-related characteristics were also collected. Descriptive statistics and Pearson correlation analyses were conducted to evaluate the relationships between the tools. Missing data were excluded. All 3 tools successfully classified individuals as robust, pre-frail, or frail. The strongest correlation was observed between the CHS Frailty Index and the Korean FRAIL scale (r = .565), while the weakest correlation was found between the Korean FRAIL scale and Korean Frailty Index (r = .427). Although the tools showed significant associations, discrepancies in frailty classification across tools were identified. The findings suggest that while all 3 tools are appropriate for assessing frailty, differences in classification thresholds imply that tool selection should consider the health profile and the context in which screening occurs. The findings indicate that while all 3 tools are valid, differences in classification thresholds suggest that the choice of tool should depend on the screening context. Complementary use may enhance frailty identification and guide individualized care.
Introduction
Population aging is accelerating worldwide. By 2050, the number of people aged 65 years and older is expected to more than double, while those aged 80 and above will more than triple. 1 As the global population ages at an increasing rate, there is increasing interest in maintaining health and vitality in old age, making aging a focal point of discussion. 2 In particular, South Korea is experiencing a rapidly aging population, in line with declining birth rates. The proportion of elderly individuals is expected to steadily rise to 24.3% by 2030 and reach 40.1% by 2060. 2 Such demographic shifts increase the susceptibility of older adults to various age-related diseases. Additionally, the aging process itself can lead to physical, mental, and social impairments irrespective of the onset of specific illnesses. Frailty is associated with adverse health outcomes such as hospitalization, falls, disability, and mortality.3,4
Frailty, a state of increased vulnerability to possible stressors with decreased physiological reserves, is a common geriatric problem and is associated with adverse health outcomes in older adults.5,6 Several longitudinal birth cohort studies have reported increases in the relative prevalence of frailty among more contemporary generations of older adults compared with their generational predecessors.7-9 Frailty is a geriatric syndrome characterized by the accumulation of multiple factors including reduced physical activity, sensory decline, and social isolation. When frailty worsens, irreversible disorders occur, resulting in increased hospitalization, poor quality of life, and increased mortality.10,11 Frailty, defined as a state of increased vulnerability to stressors with decreased physiological reserves, leads to adverse health outcomes such as hospitalization, falls, disability, and mortality. It refers to a condition characterized by inadequate physiological responses to minor stressors, leading to an increased risk of falls, hospitalization, nursing home admission, disability, and death. However, it is insufficient to define senescence only by poor functional status and poor prognosis; therefore, there has been no consensus on the definition or measurement tools of frailty. 12
In O’Caoimh’s study, 240 studies related to frailty were analyzed to investigate frailty among 1 755 497 individuals worldwide. 13 Participants were over 50 years of age, with 12% physical frailty and 46% pre-frailty. The prevalence of physical frailty was higher among females (15%) than males (11%). According to a national survey of the older adults conducted in Korea in 2008, the prevalence of frailty among older adults in Korea was 46.8%, 46.3%, and 6.9% frail. 14 According to the Geriatric Emergency Department Guidelines released in the United States, all older adults were encouraged to use frailty screening tools regardless of visiting the emergency room, and doctors recommended using appropriate medical resources for at-risk patients. 15
The method of evaluating frailty can be largely divided into a method of diagnosing several abnormal phenomena and a method of expressing them as the total score of the items with abnormalities among various survey items. 16 The former is the most famous Fried criterion 3 and the latter is the most representative of the Rockwood Frailty Index. 17 In addition, fatigue, resistance, ambulation, illness, and loss of weight (FRAIL) scales are examples of frailty evaluation tools that can be easily applied in clinical practice and have minimized measurement time. However, since there is no specific tool for diagnosing frailty, such as CT or MRI, these evaluation tools are highly dependent, and reliability and validity are important.
This study aimed to generate foundational data for the prevention of frailty by identifying general health characteristics of older adults and evaluating the comparability and correlation among commonly used frailty assessment tools.
First, the participants’ general health characteristics—including sex, age, education level, nutritional status, cognitive function, depressive symptoms, and body mass index—were examined.
Second, participants were classified as frail or pre-frail using 3 different frailty assessment tools.
Third, the comparability of these tools was assessed through correlation analyses to determine the degree of agreement among them.
Materials and Methods
Collection of Research Participants and Data
This study employed a cross-sectional design using secondary data from the Korean Frailty and Aging Cohort Study (KFACS). 18 The KFACS is a nationwide longitudinal cohort that initially recruited approximately 3000 community-dwelling older adults aged 70 to 84 years to investigate frailty and aging-related outcomes in South Korea.
The age range of 70 to 84 years was selected because it represents a transitional phase during which the risk of frailty increases significantly, and it is a key target group for preventive interventions. Participants were recruited from 10 hospitals and public health centers that agreed to participate in the KFACS, which were selected to represent a diverse range of geographical regions across the country.
For this study, a total of 3011 older adults who completed frailty-related assessments during the 2018 to 2019 data collection cycle were included. All data were collected through standardized, face-to-face interviews conducted by trained personnel at the participating research centers. Although the original cohort study obtained written informed consent at enrollment, this secondary analysis used anonymized data; therefore, additional consent was waived in accordance with IRB policy.
The survey included structured questionnaires evaluating demographic characteristics, health-related factors, and geriatric syndromes. Of the 96-page full instrument, 80 items were extracted based on their relevance to the study’s objectives and theoretical framework.
Inclusion criteria: (1) community-dwelling older adults aged 70 to 84; (2) those who had provided informed consent during initial cohort enrollment; (3) those who completed the baseline frailty assessments.
Exclusion criteria: (1) MMSE score <18, indicating severe cognitive impairment and (2) participants with missing data in essential frailty-related or demographic variables.
No formal sample size calculation was conducted due to the use of preexisting cohort data. Instead, all eligible participants were included in the analysis.
General Information of Participants
Age, education level, nutritional status (Mini Nutritional Assessment Short Form [MNA-SF]), cognitive status (Mini-Mental State Examination [MMSE]),mental status (Geometric Depression Scale [GDS]), and Body Mass Index (BMI) of older adults who participated in this study. The GDS shows that 0 to 4 points were normal, and higher GDS scores were indicative of higher levels of depression. 19 The MMSE is regarded as a normal finding if it is 24 points or higher, and the higher the score, the higher the cognitive level. 20 MNA determines that there is no risk factor for a score of 24 or higher, and the lower the score, the higher the nutritional risk status. 21
Evaluation Tools of Frailty
In this study, 3 tools were used to standardize the frailty evaluation process. The CHS Frailty Index, the Korean version of the FRAIL scale, and Korean Frailty Index were chosen for their proven reliability and validity. These tools were modified to ensure cultural relevance and accuracy in the Korean population. The frailty evaluation tool is most frequently used worldwide in the Korean version.
Cardiovascular Health Study (CHS) Frailty Index
As an indicator presented by Fried et al, 3 3 or more out of 5 items, such as weight loss, decreased vitality, weakness, walking speed, and decreased physical activity, were defined as frailty, and if 1 or 2 findings were not seen, it was identified as pre-frailty. Fried suggested, 3 or more of the 5 items were defined as frailty if weight loss, vitality reduction, physical activity reduction, walking speed reduction, and grip reduction were positive, and if 1 or 2 were positive, it was classified as pre-frailty and robust if none of the above findings were seen. The Cronbach’s alpha value was .64. The 5 items were as follows:
Weight loss: It was defined as an unintended loss of more than 4.5 kg (or 5% of weight) over the past year.
Vitality reduction: When asked, “Did you feel hard about everything?” or “Did you feel like you couldn’t get through it?” At least 1 case 3 days a week was evaluated as 1 point, and if it was less than that, it was evaluated as 0 points.
Physical activity reduction: Based on the International Physical Activity Questionnaire short form, which has been verified both domestically and internationally, this study weighted the type of activity according to the energy requirements defined by METs.
22
The method for calculating each score is as follows: (1) MET-min/week = 3.3 × walking min × walking day. (2) Moderate MET-min/week = 4.0 × moderate-intensity activity min × moderate days. (3) Vigorous MET-min/week = 8.0 × vigorous-intensity activity min × vigorous days.
The integrated total score is the total score of each result, and in this study, the lower 20% was given 1 point by dividing it into male and female groups.
(4) Reduced walking speed: 1 point was given to the bottom 20% by measuring the walking speed at 4 m and distinguishing gender.
(5) Decreased grip force: adjusted by sex, giving 1 point to the lowest 20%. In this study, the average value of each middle finger was calculated by holding the second joints of the left and right middle fingers at right angles to the grip of the grip meter, straightening the arm, and naturally dropping it down to prevent the grip meter from touching the body.
Korean Version of FRAIL
It is divided into 5 areas (fatigue, resistance, ambulation, illness, and loss of weight). 16 The Korean version of the FRAIL questionnaire is as follows. (1) Fatigue: Have you ever felt tired during the past month? 1 = Always to 5 = Not at all (If you answer 1 or 2, you get 1 point, otherwise 0 points); (2) Resistance: Is it hard to climb 10 stairs without any help? Yes = 1 point, No = 0 points; (3) Ambulation (move): Is it hard to travel 300 m alone without help? Yes = 1 point, No = 0 points; (4) Illness: Have you heard of any of the following diseases (high blood pressure, diabetes, cancer, chronic lung disease, myocardial infarction, heart failure, angina, asthma, arthritis, cerebral infarction, and kidney disease) 0 to 4 were 0 points, 5 to 11 were 1 point; (5) Loss of weight: How much weight was 1 kg ago? One point indicates a decrease of 5% or more over a year and 0 points indicates a decrease of less than 5%. In the Korean version of the FRAIL questionnaire, if the total score is ≥3, it is determined as the senescence stage for 1 to 2 points, and if it is 0 points, it is normal. The Cronbach’s alpha was .786.
Korean Frailty Index
This study used the number memorization test, a component of the language test within the 11 Korean versions of the Wechsler Adult Intelligence Scale (K-WAIS) test. 12 This subtest assesses short-term auditory memory and attention. It comprises 7 questions for immediate memorization and 7 additional questions for reverse memorization. The total score is derived from the sum of the correctly memorized items in both directions. The simplicity and ease of the test instructions render the number memorization test valuable for evaluating older adult patients and individuals with dementia. The Cronbach’s alpha was .65.
Variable Definitions
A total of 3011 participants who completed frailty-related assessments were included in this study. The analyzed variables comprised age, sex, education level, body mass index (BMI), cognitive function (MMSE), depression (SGDS-K), and nutritional status (MNA). A total of 80 items were extracted from the original 96-page questionnaire.
Statistical Analysis
Based on the variables described above, descriptive statistics were used to summarize participants’ demographic and health-related characteristics. Pearson correlation coefficients were calculated to assess the associations among the 3 frailty assessment tools, consistent with prior comparative studies. 23
The internal consistency of each tool was evaluated using Cronbach’s alpha, a standard psychometric method for reliability analysis. 24 Missing data, which accounted for 24.9% of the dataset, were excluded from the analysis. Only complete cases were used for statistical analysis. All analyses were conducted using SPSS version 26.0 (IBM Corp., Armonk, NY, USA).
This study followed the Strengthening the Reporting of Observational Studies in Epidemiology (STROBE) guidelines for reporting cross-sectional studies, 25 and a completed STROBE checklist is included in the Supplemental materials.
Results
General Information About the Subject
Of the total 3014 participants in the 2019 frailty cohort dataset, cases with missing values were excluded separately for each tool. Specifically, 750 cases (24.9%) were excluded from the CHS frailty index analysis, 1048 cases (34.8%) from the Korean FRAIL scale analysis, and 514 cases (17.1%) from the Korean Frailty Index analysis. For descriptive analysis of general characteristics, 62 participants with incomplete demographic or health-related variables were excluded, resulting in 2952 cases. Table 1 describes the average values of the data, excluding missing values among general demographic variables. The variable that showed the largest difference in the average value of the older adult males and females was the level of education. The average education level was 10.7 years for men and 6.7 years for women. For other average values, there were statistically significant differences between men and women, but all were in the normal category.
General Information About Participants Used as Control Variables.
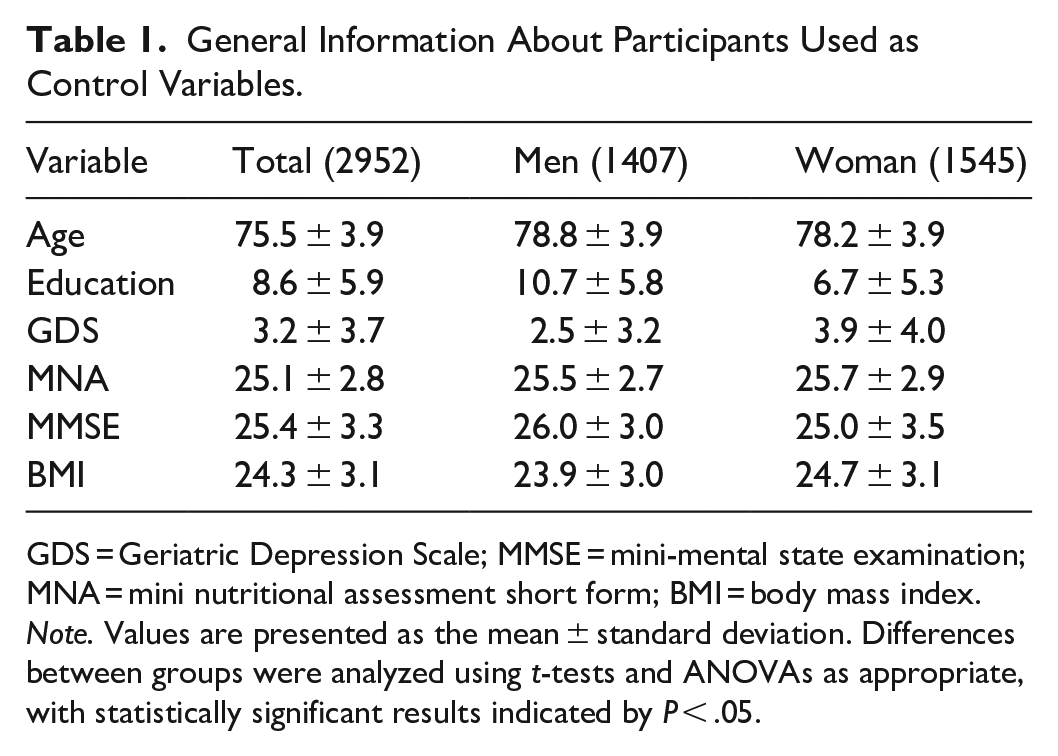
GDS = Geriatric Depression Scale; MMSE = mini-mental state examination; MNA = mini nutritional assessment short form; BMI = body mass index.
Note. Values are presented as the mean ± standard deviation. Differences between groups were analyzed using t-tests and ANOVAs as appropriate, with statistically significant results indicated by P < .05.
Results of Frailty Evaluation Tools
The total score was calculated based on the manual of the 3 evaluation tools used in this study, and if even 1 question had a missing value, it was excluded from the result.
Descriptive Statistic of Frailty Evaluation Tools
Descriptive statistics using the CHS frailty index revealed that 24.4% of participants were classified as robust, 59.0% as pre-frail, and 16.6% as frail (Table 2). A total of 750 (24.9%) responses had missing values.
Descriptive Statistics of CHS.

These findings indicate a high prevalence of prefrailty and frailty among older adults, underscoring the importance of early screening and intervention strategies using standardized assessment tools such as the CHS frailty index.
In the Korean version of frailty, 43.1% were robust, 44.3% were pre-frail, and 12.6% were frail (Table 3). One thousand and forty-eight responses had missing values (34.8% of the total).
Descriptive Statistics of Korean Version of Frail.

In the Korean Frailty Index, 59.5% were robust, 33.8% were pre-frail, and 6.7% were frail (Table 4). A total of 514 responses had missing values (17.1%).
Descriptive Statistics of Korean Frailty Index.

Correlation Analysis of Frail Evaluation Tools
All 3 evaluation tools showed significant (P < .01) and positive correlations (Table 5). Among them, the correlation coefficient between the Korean version of frailty and the CHS frailty index was the highest at .565, and the correlation coefficient between the Korean version of frailty and the Korean frailty index was the lowest at .427.
Result of 3 Evaluation Tools of Pearson’s Correlation Analysis.

P < .01.
Discussion
This study aimed to compare the classification criteria and sensitivity of 3 commonly used frailty assessment tools among community-dwelling older adults in Korea: the CHS Frailty Index, the Korean version of the FRAIL scale (K-FRAIL), and the Korean Frailty Index (KFI). All 3 tools effectively categorized individuals into robust, pre-frail, and frail statuses; however, significant differences were observed in their thresholds and sensitivity levels for classification.
The strongest correlation was found between the CHS Frailty Index and K-FRAIL (r = .565), while the lowest was between K-FRAIL and KFI (r = .427). These findings align with previous research indicating that variations in frailty assessments may reflect differences in tool components and conceptual frameworks. 26 Notably, the KFI classified a higher proportion of older adults (59.5%) as robust compared to the CHS Frailty Index (24.4%), highlighting substantial discrepancies among tools. This underscores the necessity of carefully selecting frailty assessment tools according to the specific health profile and context of the target population. 27
The K-FRAIL scale demonstrated high sensitivity when compared to the CHS criteria, indicating its effectiveness as a quick and simple screening tool. 28 Furthermore, K-FRAIL showed strong correlations with the multidimensional frailty index derived from comprehensive geriatric assessments, suggesting its applicability in clinical settings. 29 Similarly, the KFI exhibited comparable distribution patterns to the CHS criteria in classifying frailty, aligning with findings from prior research .
A notable aspect of these findings was the significant gender difference observed in educational levels among older adults. This educational disparity likely reflects historical and socioeconomic contexts in Korea and supports findings from previous research, which linked lower educational levels with increased frailty risks. 30 Future intervention strategies should consider addressing socioeconomic disparities, particularly educational background, as a preventive measure against frailty.
Moreover, cognitive function scores (MMSE) observed in this study were consistent with those from previous Korean cohort studies. 31 Given that participants required adequate cognitive abilities to respond effectively to extensive questionnaires, selection bias may have influenced the representativeness of this sample. Consequently, results from this study should be generalized with caution.
The limitations of this study should also be acknowledged. First, because this study utilized existing cohort data, no formal power calculation was performed to determine the optimal sample size. This may affect the external validity and generalizability of the findings.
Second, reliance on self-reported questionnaires may have introduced reporting bias, particularly regarding participants’ physical and mental health conditions.
Third, a considerable amount of missing data was excluded from the analysis; however, the potential influence of these missing data on the study outcomes cannot be entirely ruled out.
Future studies should address these limitations by employing a prospective design with pre-calculated sample sizes and integrating objective measures alongside self-reported assessments to minimize biases. Additionally, further research should evaluate the efficacy and practicality of these frailty assessment tools across diverse healthcare settings and populations to enhance their generalizability and utility.
Conclusions
Frailty is a multidimensional construct that cannot be accurately captured by a single tool across all populations. This study compared 3 commonly used frailty assessment tools and found significant differences in both classification outcomes and correlation levels. These findings suggest that tool selection should be guided by the intended purpose, clinical setting, and characteristics of the target population. In Korea’s rapidly aging society, early detection of frailty is essential. Therefore, tailored and flexible screening strategies that leverage the strengths of each tool are recommended to improve detection accuracy and support individualized care. Ultimately, aligning frailty screening practices with population-specific needs is crucial for enhancing older adults' health outcomes and maintaining functional independence.
Supplemental Material
sj-docx-1-inq-10.1177_00469580251363877 – Supplemental material for Comparative Analysis of Three Frailty Assessment Tools: A Cross-Sectional Study
Supplemental material, sj-docx-1-inq-10.1177_00469580251363877 for Comparative Analysis of Three Frailty Assessment Tools: A Cross-Sectional Study by DaSol Park in INQUIRY: The Journal of Health Care Organization, Provision, and Financing
Footnotes
Acknowledgements
The author would like to thank Professor Chang Won Won and the research team at Kyung Hee University School of Medicine for providing access to the frailty cohort data used in this research.
Ethical Considerations
This study was approved by the Institutional Review Board of the National Evidence-based Healthcare Collaborating Agency (NECA IRB No. NECAIRB21-020-6, approval date: March 15, 2021). All data used in this study were derived from anonymized secondary cohort datasets.
Consent to Participate
Due to the use of existing anonymized cohort data, the requirement for informed consent was waived by the IRB.
Author Contributions
The sole author, DaSol Park, was responsible for the conception, design, analysis, interpretation of data, and manuscript writing.
Funding
The author(s) disclosed receipt of the following financial support for the research, authorship, and/or publication of this article: This study was supported by the Kyungnam University Foundation Grant (2023).
Declaration of Conflicting Interests
The author(s) declared no potential conflicts of interest with respect to the research, authorship, and/or publication of this article.
Data Availability Statement
The data supporting this study are available from the corresponding author upon reasonable request.
Supplemental Material
Supplemental material for this article is available online.
References
Supplementary Material
Please find the following supplemental material available below.
For Open Access articles published under a Creative Commons License, all supplemental material carries the same license as the article it is associated with.
For non-Open Access articles published, all supplemental material carries a non-exclusive license, and permission requests for re-use of supplemental material or any part of supplemental material shall be sent directly to the copyright owner as specified in the copyright notice associated with the article.