
Abstract
Climate variability, particularly global warming, is expected to have a significant impact on the interactions between pathogens, vectors, and animal and human hosts. Trypanosomiasis, a neglected zoonotic disease, is particularly sensitive to changes in climate, as increased temperatures can accelerate vector development and expand geographical range. This disease remains prevalent in Zimbabwe, with the Binga District being disproportionately affected. This study aimed to explore the effects of climate variability on the epidemiology of trypanosomiasis in the Binga District of Zimbabwe from 2008 to 2023. A multi-method approach was used to incorporate secondary data sources and a data-collection guide. Data collection involved a checklist and questionnaire administered using the Kobo Collect Toolbox. Bivariate correlations were employed to investigate the association between climate variability and trypanosomiasis occurrence. Rainfall and temperature data are presented as line graphs and maps at 3-year intervals for the period 2008 to 2023. Spatial analysis was conducted by overlaying climate data with the reported suspected cases of trypanosomiasis. The findings revealed a notable increase in annual case reports, correlating with increasing maximum and fluctuating average temperatures. Specifically, higher annual average temperatures were recorded in 2008 and 2017, coinciding with an increased incidence of trypanosomiasis. These findings underscore the critical role of climate variability in shaping trypanosomiasis trends in the Binga District of Zimbabwe. These findings highlight the importance of effective disease control strategies in response to climate-induced changes.
Keywords
Highlights
● Binga saw increased trypanosomiasis cases with rising temperatures.
● The study linked climate data and spatial analysis to disease trends.
● Temperature showed a moderate positive correlation with cases (0.5).
● Rainfall had a strong negative correlation with cases (-0.68).
● Binga remains high-risk, emphasising climate-aware control strategies.
Introduction
African Trypanosomiasis, also known as sleeping sickness or nagana, is a vector-borne disease affecting both humans and animals. 1 Climate change significantly affects the occurrence and distribution of diseases spread by climate-sensitive vectors (tsetse flies). 2 In a study by Moore et al, 3 trypanosomiasis was deemed to be 1 of the 12 infectious diseases likely to spread due to climate change. The study further predicted that by 2090, over 46 million people will be at risk of exposure to trypanosomiasis. 3 Studies have revealed that increasing temperature and rainfall are associated with an increased prevalence of African trypanosomiasis in West Africa. 4 Furthermore, studies have shown that changes in temperature and rainfall are associated with an increased prevalence of African Trypanosomiasis. Studies indicate that optimal temperatures for tsetse fly survival and reproduction range between 23°C and 25°C, with high relative humidity levels of 75% to 90% being essential for pupation and overall survival. 4 These conditions significantly affect the capacity of trypanosomes to establish and mature within the tsetse fly, thereby affecting their transmission rates to human and animal hosts.3,4
Several scenarios arise because of climate variability which in turn affects the survival and distribution of the vector, thereby resulting in changes in exposure to the parasite. These include the emergence of new suitable environments for the vector owing to the warming of previously colder areas of higher elevation, habitat fragmentation due to human activity, increased human-animal contact as anthropogenic activities expand into wildlife territories, changes in the biology of the vector, and changes in humidity levels.5,6 It has been noted that the distribution of tsetse and its abundance play an important role in the epidemiology of trypanosomiasis; therefore, intervention programmes have mostly been targeted at eliminating insects. 7 Several studies have been conducted to understand tsetse population dynamics, which have resulted in an increased understanding of the link between the environment and tsetse presence and abundance. It has also been established that tsetse is highly dependent on habitats for survival; therefore, ecological and land-use changes have a major impact on fly populations and their associated disease risks.7,8 Several other vector bone diseases have been shown to be sensitive to changes in temperature and rainfall, such as malaria, danger, and leishmaniasis. 9
According to Shereni et al, 31 species of tsetse flies inhabiting 11 million km2 have been identified. Trypanosomiasis is one of the major constraints to rural development in Sub-Saharan Africa, where primary vectors are found in the semi-arid, sub-humid, and humid lowlands of 37 countries with a potential distribution range of 8.7 million km2.10,11 In 2022, the World Health Organization (WHO) recorded just under 1000 cases across 26 African countries. 12 Over the last century, control efforts have been made; however, the disease remains persistent across sub-Saharan Africa in various strains. 13 Tsetse flies are particularly well-situated to move to previously disease-free areas under climate change scenarios. 13 This means that most at-risk populations are likely to be unprepared. Trypanosomiasis remains a debilitating and fatal disease in livestock and humans if left untreated.13,14 For instance, trypanosomiasis in livestock causes a loss of over 4 billion USD due to a 70% reduction in cattle density, a 50% reduction in dairy and meat sales, a 20% reduction in calving rates, and a 20% increase in calf mortality in sub-Saharan Africa. 14
In Zimbabwe, 265 tsetse-transmitted trypanosomiasis cases were reported countrywide between 2009 and 2015, with 240 cases of Animal African Trypanosomiasis (AAT) and 25 cases of Human African Trypanosomiasis (HAT). 10 Two savannah species of tsetse flies have been found in the country namely Glossina morsitans and Glossina pallidipes. 11 Shereni et al 11 stated that half of Zimbabwe is ecologically suitable for the 2 species, although currently, the tsetse distribution is mainly restricted to the northern districts along Zambezi Valley. This includes the study area of this study, Binga District. Binga has been subjected to major tsetse control operations over the years; however, the disease remains prevalent in the area. 11 Therefore, this study sought to explore how climate change over the last 15 years has affected the epidemiology of trypanosomiasis within the district. This study aimed to explore the effects of climate change on the epidemiology of trypanosomiasis in the Binga district of Zimbabwe. The distribution, prevalence, and impact of vector-borne diseases are often affected by anthropogenic environmental changes that alter the interactions between the host, parasite, and vector. 10
Methods
Study Area/Setting
Binga is located in Zimbabwe, a landlocked country in southern Africa known for its dramatic landscape and diverse wildlife, many of which lie within parks, reserves, and safari areas. 15 A village on the southeastern shore of Lake Kariba in the province of Matabeleland North, Zimbabwe, is rich in biodiversity and supports several iconic wildlife species, such as elephants, buffaloes, rhinos, lions, and cheetahs. 16 It is home to Chizarira National Park, which is Zimbabwe’s third largest national park covering 2000 km2. It has various tourist attractions, such as hot springs, sand beaches, fishing, crocodile farms, game reserves, Chijalile Pass, Swamps in the Simatelele Ward area, several stunning gorges, and natural rock outcrops. 17 As of 2023, the average daily temperature ranges from 33°C during the cold season to 28°C to. 15 The area is characterised by high humidity since the wet season lasts 4 months from November to March, with a more than 33% chance of rain each day. The area is not well developed, with a population of less than 200 000 people where commercial cultivation of kapenta, bream, tilapia, and tiger fish are part of the district’s livelihood strategies.17,18 A map of the study area is shown in Figure 1.

Study area map.
Study Design
This study was designed as a cross-sectional, multi-method survey. This design was chosen to facilitate the collection of both quantitative and qualitative data from various sources, thereby enabling a comprehensive analysis of the relationship between climate variability and trypanosomiasis incidence. The study utilised Bivariate correlation analysis was used to statistically examine the relationship between climate data (temperature and rainfall) and trypanosomiasis occurrence. This statistical approach allowed the identification of significant associations between climatic conditions and disease prevalence, providing insights into how variations in climate may influence trypanosomiasis trends. In addition to the quantitative analysis, qualitative data were collected through structured interviews and field observations. These methods helped contextualise the quantitative findings, offering deeper insights into the local perceptions of climate change impacts on trypanosomiasis and the associated socio-economic factors, enabling researchers to track the precise locations of reported cases over the selected years (2008-2023). By integrating both quantitative and qualitative approaches, this study produced prevalence and predictive maps to enhance our understanding of how climate variability affects the epidemiology of trypanosomiasis in the Binga District of Zimbabwe.
Study Population
The study was conducted among patients who had been identified by the Binga District Hospital as having symptoms of sleeping sickness and provided written consent to participate in the study. Owing to the lack of available diagnostic tools in the district to confirm a positive test for the disease, the cases were classified by the researcher as suspected cases. The criteria used were a history of symptoms where patients presented with symptoms associated with trypanosomiasis, as well as confirmation from physical examinations, such as the presence of cutaneous lesions and/or swollen lymph nodes in the cervical region. Although malaria also presents with the same symptoms, malaria cases were eliminated using the available clinical assessment tools that confirmed malaria cases. Consequently, identified cases were classified as suspected, acknowledging the potential for undetected or misclassified cases. This approach deviates from the standard case definition by MoHCC of Zimbabwe with support from The University of Zimbabwe and WHO relied primarily on clinical history rather than laboratory confirmation. This approach, which is not ideal, reflects the reality of disease surveillance in resource-limited settings and highlights the need for improved diagnostic resources to enhance accurate case identification in future studies.
Data Collection
A data capture form was used to identify the requirements of this study, and all data were collected using this tool. To determine trypanosomiasis trends over the years, secondary data from health facilities (Chibondo Clinic, Dandamera Clinic, Doma Clinic, Mabhiza Clinic, Mwalukanga Clinic, and Nyamiyu Clinic) were reviewed at Binga District Hospital with the help of local healthcare professionals and our data extraction guide. The researcher captured the coordinates of reported cases during the intended period of this study (2008-2023), which was purposively selected to provide an overview of the disease distribution over the last 15 years. The timeframe for the study was cross-sectioned into 3-year intervals for this period, meaning that data were collected for the years 2008, 2011, 2014, 2017, 2020, and 2023. Climate data were accessed from the Meteorological Department of Zimbabwe and remotely sensed imagery for selected years.
GIS Data Acquisition
Data on trypanosomiasis cases were collected from the Binga District Hospital, which maintains comprehensive statistics for the area. Researchers followed up the exact locations of these reported cases to obtain their actual coordinates. Locations where cases occurred, such as schools, hospitals, and homesteads, were documented.
The coordinates were then imported into ArcGIS software to map the distribution of these cases within the district. Additional data were sourced from the Google Earth Engine, which provides meteorological data to map the temperature and rainfall patterns for the selected years (2008, 2011, 2014, 2017, 2020, and 2023). Specifically, Land Surface Temperature data from the Moderate Resolution Imaging Spectrometer (MODIS) was downloaded to capture remotely sensed temperature trends. Precipitation data were acquired from the Climate Hazards Group Infrared Precipitation with Station data (CHIRPS) product on Google Earth Engine. The area of interest, Binga, was clipped, and raster files were downloaded separately in Tag Image File Format (TIFF) for the selected years for both temperature and precipitation variables. These datasets were imported into ArcGIS for further processing. In ArcGIS, kriging was performed to interpolate the temperature and precipitation data from the Google Earth Engine, along with the data obtained from the Meteorological Department. This geostatistical technique allows for the generation of continuous surface maps representing the spatial distribution of these variables, and for visualisation, additional styling, labelling, and colour schemes are applied to enhance the clarity of each dataset. Maps were created for each variable across the selected years, allowing for a clear representation of trends. To highlight the association between temperature and rainfall, layers for each variable were overlaid with layers representing trypanosomiasis cases in each selected year.
Zimbabwe Trypanosomiasis Risk Map
A risk map was also created to highlight the hotspot areas that are environmentally conducive for the vector and to identify the potential for the occurrence of the disease for the whole country. Data on environmental risk factors were gathered from Google Earth Engine (Table 1). Weights were assigned to each variable based on their influence on the vector survival. These weights were designed according to an experimental study by Pollock which confirmed the most conducive set of environmental variables favourable for the survival of the vector. 26 The variables were then layered and hotspots were identified based on the overall weights. The variables used to obtain the map and their weights are presented in Table 1.
Variables and Weights in Risk Mapping.

Data Management, Analysis, and Presentation
The data collected in this study were stored for analysis. This data was analysed to come up with descriptive statistics to denote the occurrence of the disease in the area as well as inferential statistics to determine relationships of different variables and incidence/ prevalence. Line graphs were used to present trypanosomiasis trends over the years for which data were available to determine whether there were any notable increases or decreases in the number of cases owing to climate change. The cases were then mapped separately for the selected years.
To quantify the association between the 2 climate variables and the prevalence of trypanosomiasis, the Bivariate Correlation Coefficient was calculated using the following formula

Output Presentation
The results from this study are presented in the form of layered maps which also highlight hotspots for disease occurrence. The risk map was one of the intended outputs of this study. Risk maps have proven to be important tools for public health decision-making and priority setting for vector-borne diseases, because they assist with the targeting of prevention and control efforts.
Reliability and Validity
To ensure reliability, for validity, the data was GPS data points were captured twice with 2 different devices to ensure the consistency and reliability of the data. Data from the Google Earth Engine were combined with data collected from the Zimbabwe Meteorological Department during processing to ensure the accuracy of the output maps.
Informed Consent and Ethics Clearance
The research proposal was reviewed by the National University of Science and Technology (NUST) Institutional Review Board (IRB) and ethics clearance granted
Results
Zimbabwe Trypanosomiasis Risk Map
Figure 2 shows the existence of vectors across countries. The Binga District is a high-risk area conducive to the persistence of tsetses.

Zimbabwe trypanosomiasis rish map.
Trypanosomiasis Trends in Binga District (2008-2023)
Cases were recorded for the period 2008 to 2023 in 3-year intervals, and the statistics were for the years 2008, 2011, 2014, 2017, 2020, and 2023. Suspected cases were listed as cases that had symptoms of the disease; however, due to the lack of diagnostic tools to confirm a positive test, these were recorded as suspected trypanosomiasis cases. There was an increase in the number of cases as years progressed. The results are shown in Figure 3.

Trypanosomiasis trends in Binga District (2008-2023). This figure illustrates the annual reported cases of trypanosomiasis in the Binga District from 2008 to 2023. Notable observations include a significant increase in reported cases from 2015 onwards. The data indicates a consistent upward trend, highlighting the growing incidence of trypanosomiasis in the region, which correlates with changes in climatic conditions.
Temperature and Rainfall Patterns (2008-2023)
Temperature and rainfall data were collected from the Met Department of Binga District. Records were obtained for both the minimum and maximum temperatures and the average was calculated. The following graph presents the 3 temperatures for each selected year in Degrees Celsius (°C). There was a slight increase in the overall temperature as years progressed. The findings are shown in Figure 4.

Temperature and Rainfall Patterns (2008-2023). This figure displays the minimum, maximum, and average temperatures recorded in the Binga District from 2008 to 2023. Notable trends include a consistent increase in maximum and average temperatures over the years, particularly evident between 2017 and 2023, where maximum temperatures approached 30°C. Minimum temperatures also show a slight upward trend, indicating overall warming in the region. This data underscores the climatic shifts that may influence the epidemiology of trypanosomiasis.
Spatial View of Temperature Trends
There was a notable warming of the region by 2020, indicating the highest temperatures in all years. A spatial view of the temperature distribution across the districts is shown in Figure 5.

Spatial view of temperature distribution across Binga. This series of maps illustrates the spatial distribution of temperature trends in the Binga District from 2008 to 2023. Each map shows temperature variations across the district, with colour gradients indicating temperature ranges. Notable observations include a discernible increase in temperature across the region, particularly in the northeastern areas, where maximum temperatures reached up to 35°C in 2023. The consistent warming trend over the years may have implications for local health dynamics, including the incidence of trypanosomiasis.
Annual Rainfall Patterns
The annual rainfall patterns were recorded for the selected years and are presented in the graph below. There was a fluctuation in the temperature averages over the years, with the highest recorded temperatures in 2008 and 2017. The results are shown in Figure 6.
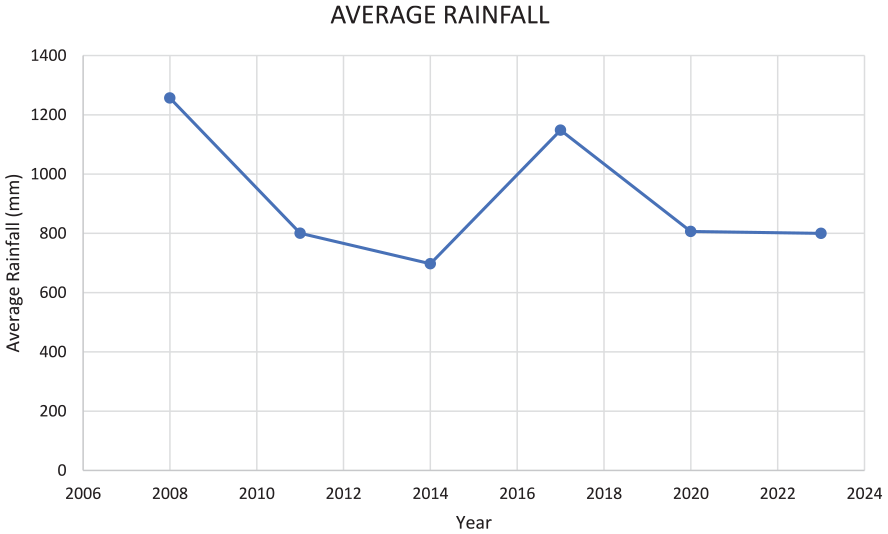
Annual rainfall patterns. This line graph depicts the average rainfall recorded in the Binga District from 2006 to 2023. The data indicates a noticeable decline in average rainfall from 2006 to 2014, followed by a slight recovery in subsequent years. However, rainfall levels have remained relatively stable around 800 mm since 2018. These trends are critical for understanding water availability and its potential impact on agricultural practices and disease vectors in the region.
Spatial View of Rainfall Patterns
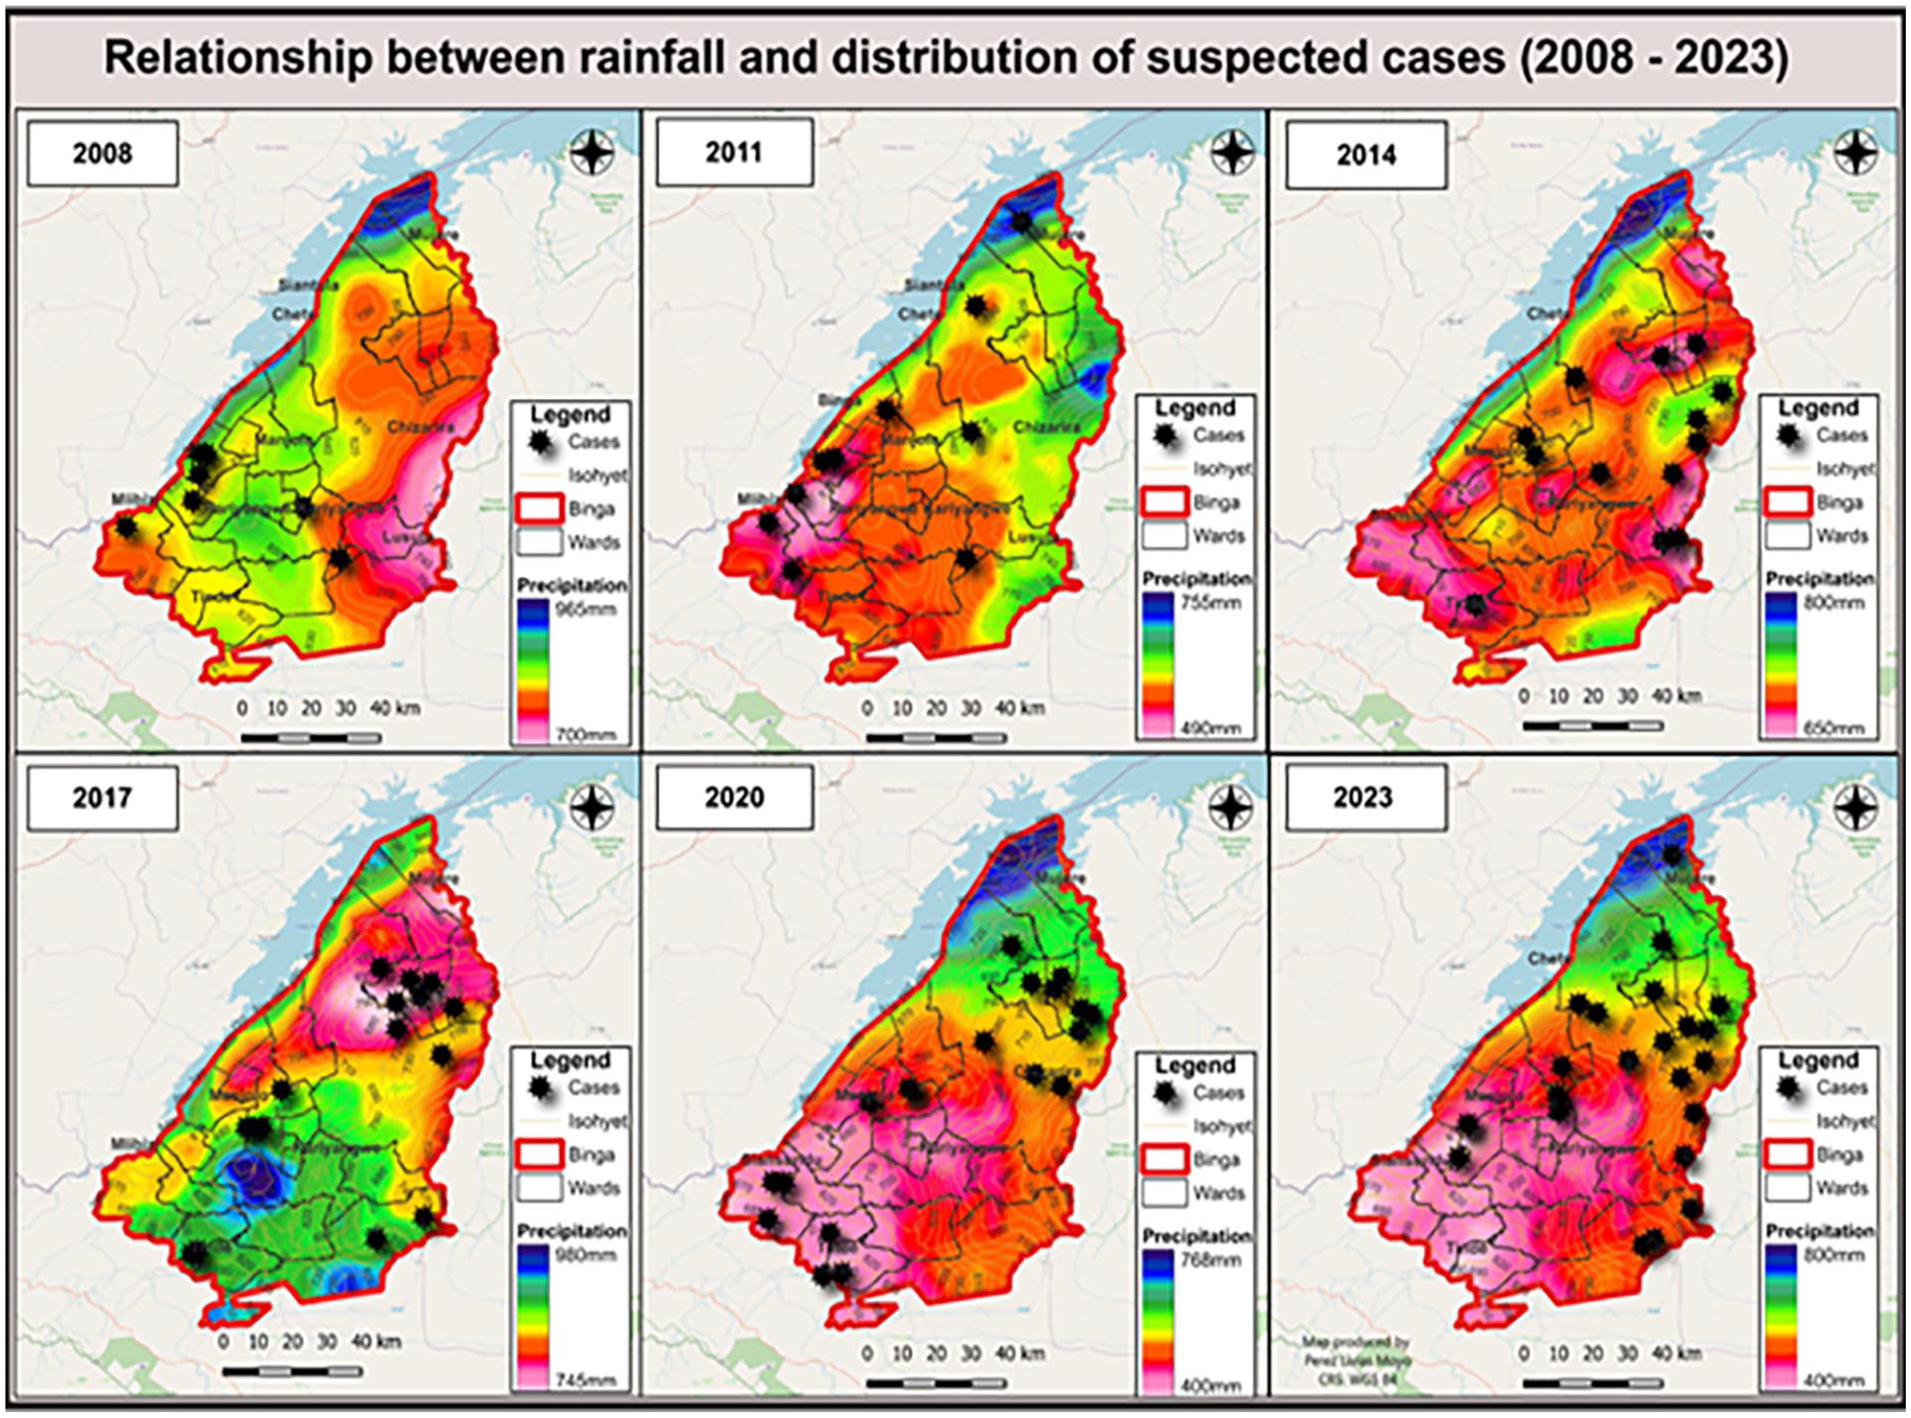
A spatial view of the annual average rainfall patterns across the district is shown in figure below. High precipitation values were observed during 2008 and 2017. Low precipitation values were noted in 2020, indicating that the region has not received as much rainfall in recent years. The results are shown in Figure 7.

Spatial view of annual average rainfall patterns across Binga District.
Spatial Distribution of Trypanosomiasis Cases (2008-2023)
Coordinates of locations where the cases were recorded. The spatial distribution of suspected cases of the disease is presented in figure below. The number of cases has increased from 2008 to 2023, indicating that a conducive environment remains for the vector to survive and remain infectious. The results are shown in Figure 8.

Spatial distribution of trypanosomiasis cases (2008-2023).
Association Between Changes in Climate and Distribution of Cases
The bivariate correlation coefficient between temperature and number of cases was .5, indicating a moderate correlation. This indicates that an increase in the number of cases correlates with an increase in the temperature. The number of cases increased as the region became warmer. These findings are presented in Figures 9 and 10, respectively.

Association between changes in temperature and distribution of cases.
Association between changes in rainfall and distribution of cases.
Relationship Between Precipitation and Distribution of Suspected Cases
The bivariate correlation coefficient between rainfall and the number of cases was −.68 which indicates a strong negative relationship. This correlation indicates a complex relationship between rainfall and the prevalence of trypanosomiasis, where factors such as vegetation changes, vector dynamics, and other environmental factors may have influenced the results. It should also be noted that this relationship does not establish causality because it does not account for long-term climatic trends, and underreporting may have influenced the reliability of secondary data on cases. The number of cases for each year was overlaid with rainfall distributions to show how changes in rainfall patterns impacted the distribution of cases over the years. These findings are summarised in Figure 11.

Number of suspected cases.
Discussion
Climate is a dominant factor determining the distribution of trypanosomiasis vectors, and there is a need to understand how climate change affects the occurrence of the disease. Understanding how changes in climate at the local scale affect the spatial and temporal distribution of tsetse fly species is critical for identifying the most likely vulnerable locations and for better targeting limited resources to eliminate the disease.8,19 The main indicators of climate change used in this study are temperature and rainfall, which are easy to record and monitor and significantly impact tsetse fly ecology.2,3,20,21
A significant increase in the number of suspected cases has been recorded between 2008 and 2023. This indicates that vector remains present in the environment despite efforts to eliminate it. These findings are consistent with a study by Mambondiyani, 22 who stated that sleep sickness transmission in humans is still taking place, with several cases reported in the country. The lack of confirmed cases speaks to the absence of diagnostic tools for the surveillance of the disease indicated by some studies that one of the key issues the Health Ministry discovered was the low suspicion index or lack of diagnoses which is why there is a need to redevelop a standard case definition and surveillance. 22 It has been reported that 7 of 10 cases go unreported, and for each death, 12 more cases remain undetected. This is due to poor surveillance, in which only 2% of the continent undergoes active surveillance. 23
The moderately positive correlation between temperature and the number of reported cases of African Trypanosomiasis is consistent with other studies on the relationship between climate and infectious diseases.3,20,24,25 Many vector-borne diseases, including African Trypanosomiasis, are sensitive to temperature and rainfall changes. However, it is important to keep in mind that this correlation does not imply causation. 26 Vector-borne diseases are sensitive to changes in the temperature and rainfall. 22 High temperatures can enhance the development and survival of tsetse flies. This ecological adaptation allows for a greater vector presence and increased transmission potential, as warmer conditions may extend the active season for these vectors. While there is evidence to suggest that climate variability can affect the prevalence of African Trypanosomiasis, other factors such as human activities, land-use change, and access to healthcare can also play a role. 27
A bivariate correlation of −.68 between rainfall and the number of reported cases of African Trypanosomiasis indicated a strong negative relationship between these 2 variables. 26 As rainfall increased, the number of reported African Trypanosomiasis cases decreased. This indicates the sensitivity of the vector to certain rainfall levels. However, this finding is somewhat counterintuitive, as previous studies have suggested that higher rainfall can provide more habitats for tsetse flies, which are vectors of disease.28,29 According to Pollock, 30 rainfall does not have any direct effect on tsetse but does so indirectly by affecting humidity and causing local flooding which may drown many pupae and maintain different vegetation zones, depending on how much rain falls and the duration of the rainy season.
There are several possible explanations for the negative correlation between rainfall and the number of reported cases of African Trypanosomiasis, as supported by previous studies. In some regions, African Trypanosomiasis is more prevalent during the dry season, when there is less vegetation and animals are concentrated around the water sources.28,31,32 Agricultural practices and land-use changes can affect the prevalence of the disease, and these activities may be influenced by rainfall patterns.33,34 Research by Elisha Bayode Are 20 suggests that the risk of tsetse and trypanosomiasis is strongly dependent on the extent of future climate change. They further stated that the temperature increase in the Zambezi Valley of Zimbabwe may be so severe in the coming decades that tsetse populations will decline in these hot regions of the country. Comparatively, areas such as the Hwange District have also reported fluctuating prevalence rates of trypanosomiasis, influenced by similar climatic factors and land-use changes. 2 This underscores the relevance of our findings in the Binga District, as they reflect the broader trends seen across Zimbabwe. However, with increasing temperatures, cooler areas higher up the escarpment are predicted to become more favourable to tsetse; thus, the disease is likely to persist in the environment.2,20
Limitations
The major limitation of this study is that both human and animal trypanosomiasis are among the most frequently reported diseases in the country. Fèvre et al 35 reported that, across the continent, a figure of 70 000 cases per year is cited; and approximately 50 000 HAT cases may be undetected, and thus unaccounted for in the burden calculations, in any given year.
The lack of surveillance tools has resulted in the poor detection of cases, and healthcare professionals have had to rely on symptoms to diagnose the disease.This reliance can result in misdiagnosis or missed cases, particularly in regions where access to diagnostics is limited. Consequently, this study may not fully capture the dynamics of trypanosomiasis in the Binga District, as the data could reflect only a fraction of actual cases.
Additionally, the use of secondary data limits the ability to account for real-time changes in environmental and socioeconomic factors that could influence disease epidemiology. Factors such as land-use changes, agricultural practices, and variations in healthcare access could impact the relationship between climate variability and trypanosomiasis trends but may not be adequately represented in historical datasets.
Conclusion
There has been a notable increase in the number of cases in the Binga District over the years. The influence of climate variability on the increase in cases was moderate to low which may indicate that other factors may have caused the increase which needs to be further investigated. Therefore, this study provides valuable insights that should be considered in the design and implementation of trypanosomiasis management interventions in this district. Given the complex relationship between climate variability and the prevalence of African Trypanosomiasis, it is important to adopt a multifaceted approach for disease prevention and control. Developing climate-based early warning systems that can predict the risk of African Trypanosomiasis outbreaks based on climate variability can aid in disease prevention and control. There is a need to emphasise the urveillence and diagnostic capabilities of healthcare facilities to ensure timely detection and case reporting, thereby reducing the number of unattended infections. It is imperative for future studies to uncover more of the interactions between climate variability and vector ecology. Understanding these dynamics is crucial for the development of comprehensive and effective disease prevention strategies that are not only reactive but also proactive in mitigating the impact of climate variability and change on trypanosomiasis transmission.
Supplemental Material
sj-docx-1-inq-10.1177_00469580251339381 – Supplemental material for A Cross-Sectional Study Examining the Role of Climate Variability in Shaping Trypanosomiasis Trends in Binga District, Zimbabwe (2008-2023): A Multi-Method Survey
Supplemental material, sj-docx-1-inq-10.1177_00469580251339381 for A Cross-Sectional Study Examining the Role of Climate Variability in Shaping Trypanosomiasis Trends in Binga District, Zimbabwe (2008-2023): A Multi-Method Survey by Nozithelo Ndiweni, Perez Livias Moyo, Wilfred Njabulo Nunu and Joyce Tsoka-Gwegweni in INQUIRY: The Journal of Health Care Organization, Provision, and Financing
Footnotes
Acknowledgements
Acknowledgement goes to Mr. B Khumalo from the GIS Department at the National University of Science and Technology for assisting with remote sensing.
Ethical Considerations
The research proposal was reviewed by the National University of Science and Technology (NUST) Institutional Review Board (IRB) and ethics clearance granted (certificate number: NUST/IRB/2024/060) as part of the approval process to conduct this study. Both the methodology and the data collection instruments were adjusted by considering the input received.
Consent to Participate
Consent was obtained from the Binga District Hospital for trypanosomiasis case data recorded between 2008 and 2023. In addition, the Meteorological Department of Zimbabwe was consulted with the climate data.
Consent for Publication
An information sheet detailing the purpose of the study was available to the participants before they sought their consent for participation. Written consent was obtained from all the participants.
Author Contributions
This study is part of the partial fulfillment of a Master’s Degree in Environmental Health at the National University of Science and Technology. NN conceptualised the research idea and drafted the research. PLM developed downloaded the shapefiles and together with NN developed maps. WNN and JTG supervised the Master’s research, guided the student, coordinated the manuscript writing process, and revised the draft manuscript. All authors have read and approved the manuscript.
Funding
The author(s) received no financial support for the research, authorship, and/or publication of this article.
Declaration of Conflicting Interests
The author(s) declared no potential conflicts of interest with respect to the research, authorship, and/or publication of this article.
Data Availability Statement
Not applicable.
Supplemental Material
Supplemental material for this article is available online.
References
Supplementary Material
Please find the following supplemental material available below.
For Open Access articles published under a Creative Commons License, all supplemental material carries the same license as the article it is associated with.
For non-Open Access articles published, all supplemental material carries a non-exclusive license, and permission requests for re-use of supplemental material or any part of supplemental material shall be sent directly to the copyright owner as specified in the copyright notice associated with the article.