
Abstract
Physical activity is recommended for older adults; however, the benefits of previous active engagement in physical activity that can be sustained after one becomes inactive remain to be determined. This study investigated the longitudinal associations between physical activity engagement patterns and older adults’ well-being. This population-based cohort study used data from the China Health and Retirement Longitudinal Study between 2015 and 2020. People aged 60 years and above were included, and they were categorized as active engagers if they reported engaging in at least 10 min of moderate and/or vigorous exercise consecutively per week in each survey year. Older adults’ well-being was evaluated using the healthy aging score, and geographical variations were visualized. The generalized estimating equations model was adopted to examine the differences between various physical activity engagement patterns and older adults’ well-being. Among the 3300 older adults (50.5% men; age 66.9 ± 5.7 years) during the five years of follow-up, engagement in physical activity increased from 31.7% to 59.6%. However, their well-being decreased gradually, especially among those who were inactive engagers (beta = −0.20 to −0.21). Physical activity engagement patterns appeared to slow decline in well-being. Geographical variations were noted, with more favorable healthy aging scores observed in northern China than in southern China. As older adults age, well-being deteriorates, and disengagement of physical activity accelerates the rate of decline. Re-engagement in physical activity can slow the rate of decline in well-being. Early identification of and intervention in inactive engagement in physical activity reduce the detrimental effects on older adult’s well-being. A national health initiative is an effective strategy to create a supportive environment for older adults to continue and engage in physical activity. The participation of healthcare professionals and community parties is important to encourage and engage older adults in physical activity.
Introduction
The global population is growing slowly, whereas the proportion of older adults (OAs) is increasing rapidly. 1 By 2050, 22% of the global population (2.1 billion individuals) is estimated to be aged 60 years and above. 2 Increasing attention has been focused on the well-being of OAs because their poor health status increases the burden on health systems. In response, the World Health Organization (WHO) has introduced a healthy aging framework to guide policy makers worldwide in developing and implementing actions that promote the well-being of OAs. 3 This framework emphasizes creating environments and opportunities that enable OAs to lead fulfilling lives, regardless of any disease or frailty. 1 Several key domains are identified in the assessment of healthy ageing, including physical functioning, mental health, and social support. And the national studies have indicated that a low level of healthy aging increases the risk of all-cause mortality among OAs.4 -7 Slowing age-related declines in the well-being of OAs is essential to reduce mortality rates.
Physical activity is highly recommended to maintain health for all age groups, including OAs. 8 Various exercise programs developed for OAs have been demonstrated to be safe and effective.9-11 A harmonized analysis of 8 longitudinal aging studies suggested that OAs who engage in physical activity tend to maintain a more stable level of well-being than those who do not. 12 However, changes in physical activity engagements can significantly influence well-being. In a national longitudinal study, Hamer, Lavoie and Bacon 13 compared changes in physical activity engagement between 2 periods (2002-2003 and 2006-2007) and examined their influence on healthy aging among 3051 participants. The results revealed that participants who were active engagers or became active engagers were more likely to experience better well-being than those who remained inactive (odds ratio [OR]: 3.37-7.68). Furthermore, the participants who became inactive engagers were healthier than those who remained inactive (OR: 2.36). 13
Although previous studies demonstrated significant health benefits for those who became active engagers, the inclusion of middle-aged adults may have affected the applicability of their findings to OAs.12,13 Furthermore, Hamer et al. study could not demonstrate whether those who were active-active-inactive had similar health as those who were active-inactive-inactive. 13 This information determines whether the benefits of early-life physical activity engagement can be sustained later in life, and it is crucial for the development and modification of intervention. Given the increased life expectancy, 1 the development of age-friendly cities, communities, and policy has been advocated by the WHO to support and promote healthy aging. 14 The change of physical activity engagement patterns could reflect the implementation of healthy aging interventions. For example, the improvement of medical services maintains OA’s physical and mental health that allow them to be physically active. Their physical activity engagement patterns have changed. In addition, the development of age-friendly sport facilities increases their engagement in physical activity.
The process of population aging in China is occurring rapidly. China reached the milestone of having 14% of its population are OAs in only half of the time taken for other high-income countries. 15 In response to the foreseeable challenges posed by population aging, the Chinese government launched a national health initiative, Healthy China 2030, on 25 October 2016. This national initiative aims to improve the health of citizens at various levels, such as increase average life expectancy and health literacy, and reduce premature mortality and the individual spending on health expenses. 16 In line with the WHO recommendation of physical activity in all age groups, a key objective of this initiative is to integrate and promote physical activity in daily life. To support this goal, the initiative includes the construction of cycling trails, national fitness centers, and sports parks, with the target of providing at least 2.3 m2 of sports venue area per capita by 2030. 16
Evidence regarding the effects of different physical activity engagement patterns on healthy aging over time across the national population remains limited. Previous study showed only the engagement in physical activity between 2 time points, 13 which could not demonstrate the sustainable effect of early-life physical activity engagement later in life and the ongoing effects of national health initiative. This study investigated the longitudinal associations between different physical activity engagement patterns and healthy aging among OAs. In addition, this study examined the geographical variation and ongoing effects of the national health initiative, Healthy China 2030, on the physical activity engagement of OAs using data from a nationwide population-based cohort study.
Methods
Study Design and Participants
We analyzed individuals from the China Health and Retirement Longitudinal Study (CHARLS), which was conducted in 2015, 2018, and 2020. The CHARLS 2020 survey data were released on 16 November 2023. The study design, sampling procedures, data collection methods, and follow-up strategy of the CHARLS were published previously. 17 Briefly, Chinese residents aged 45 years and older from 28 regions (provinces, municipalities, and autonomous areas) were selected using a multistage stratified probability-proportionate-to-size sampling method. This study included those aged 60 years and above whose data were available in 2015. Individuals who did not participate in the follow-up surveys in 2018 and 2020 were excluded.
Informed consent was obtained from all the participants, and the study was approved by the Institutional Review Board of Peking University (IRB00001052-11015). 17
Measured Variables
Healthy aging was assessed using the following 8 domains validated by John et al. 18 : physical functioning, cognitive function, mental health, sleep, quality of life, balance and falls, social connection, and self-rated overall health. Each domain was scored from 0 to 2, with the maximum total score of healthy aging being 16. A higher total healthy aging score (HAS) indicated better well-being. The matching of the CHARLS variables to each healthy aging domain is shown in the Appendix (Supplemental Table S1).
Individuals were categorized as active engagers if they reported engaging in at least 10 min of moderate and/or vigorous exercise consecutively per week. We acknowledge that the duration of physical activity available in the survey was a low threshold from the WHO recommendation. 8 However, a national representative study showed that replacing 10 min of light physical activity with moderate-to-vigorous physical activity improved cardiovascular health. 19 The item used in this study is a valuable indicator to assess their engagement in physical activity.
In addition, on the basis of a previous study, 20 details on several sociodemographic variables, such as sex, age, and residential area, were extracted from the 2015 CHARLS survey data as baseline characteristics. 17
Data Analysis and Visualization
We evaluated the normality of continuous variables using skewness and kurtosis statistics and normal probability plots. No continuous variable deviated from the normal distribution. Thus, the study data are presented as means and standard deviations for continuous variables and as frequencies and percentages for categorical variables.
The outcome variable of interest was the HAS. This variable was assessed in 3 waves of surveys conducted in 2015, 2018, and 2020. The explanatory variable of interest was the physical activity engagement pattern across the 3 waves, categorized as
1: 2015 (Y)_2018 (Y)_2020 (Y),
2: 2015 (Y)_2018 (Y)_2020 (N),
3: 2015 (Y)_2018 (N)_2020 (Y),
4: 2015 (Y)_2018 (N)_2020 (N),
5: 2015 (N)_2018 (Y)_2020 (Y),
6: 2015 (N)_2018 (Y)_2020 (N),
7: 2015 (N)_2018 (N)_2020 (Y), and
8: 2015 (N)_2018 (N)_2020 (N),
where Y and N correspond to meeting and not meeting the criteria of engaging in at least 10 min of moderate-to-vigorous intensity physical activity every week, respectively.
The distribution of the HAS in 2020 in different regions was visualized using Datawrapper (https://app.datawrapper.de), with darker colors indicating higher scores and gray representing areas without data.
Given that the HAS generally exhibited a decreasing trend across the 3 waves of measurements and that our focus was on the population average (across the 8 groups of physical activity engagement patterns), rather than individual differences in HAS changes, we used a generalized estimating equations (GEE) model instead of a mixed-effects model to examine the differences among physical activity engagement patterns associated with the decreasing trend (slope) of the HAS. The model included the calendar year to account for the time effect on the HAS. In addition to the linear time effect, the physical activity engagement pattern and the interaction term of engagement-pattern-by-time were included in the GEE model. The first physical activity engagement pattern [2015 (Y)_2018 (Y)_2020 (Y)] served as the reference group. The GEE regression coefficients for the engagement-pattern-by-time interaction term indicated differences between the slopes of the underlying physical activity engagement pattern groups and that of the reference group. Both mixed-effects and GEE models can account for intra-correlated longitudinal data, but unlike the mixed-effects model which needs correctly specified correlation structure, GEE is generally robust to misspecification of the working correlation structure. All statistical analyses were conducted using IBM SPSS 29.0 (IBM Corp., Armonk, NY, USA) with the significance level set at 0.05 (two-sided).
Results
Initially, 4063 OAs with complete data in 2015 were identified. After loss to follow-up in 2018 and 2020, 3030 OAs were included in this study. In 2015, the mean age of the participants was 66.9 ± 5.7 years, and 50.5% of them were men. The majority of these OAs resided in rural areas (61.3%) and had an education level of primary school (76.3%), as details in Appendix, Supplemental Table S2.
Over the study period, the percentage of OAs reporting engagement in physical activity increased from 31.7% in 2015 to 56.2% in 2018 and 59.6% in 2020. However, their HAS decreased gradually over these years (Table 1). Figure 1 shows that the OAs in 11 regions exhibited suboptimal performance in healthy aging (lightest blue: Anhui, Fujian, Guangxi, Hebei, Heilongjiang, Hubei, Liaoning, Shaanxi, Shanghai, Sichuan, and Yunnan), whereas those in six regions showed the best performance in the 2020 CHARLS survey (darkest blue: Beijing, Guizhou, Jiangsu, Shandong, Shanxi, and Tianjin). Figure 2 depicts the performance of healthy aging in accordance with different physical activity engagement patterns. Among these OAs, 24.5% (743/3030) of the initially physically inactive OAs became active engagers in 2018 and remained active in 2020 (pattern 5). Furthermore, 20% (606/3030) of the OAs remained inactive throughout the survey years (pattern 8), whereas 16.1% (487/3030) remained active (pattern 1). OAs who were inactive engagers in both 2018 and 2020 experienced a sharp decline in their HAS when compared with OAs with other physical activity engagement patterns (Figure 2).
Physical Activity Engagement Patterns and Mean Healthy Aging Scores from 2015 to 2020 (n = 3030).

HAS = healthy aging score, SD = standard deviation.

Distribution of healthy aging scores across different regions in 2020.

Healthy aging score across the study waves by physical activity engagement patterns.
OAs who were active engagers across all time points [pattern 1: 2015 (Y), 2018 (Y), 2020 (Y)] were indicated as the reference group. GEE analysis revealed that the reference group exhibited a significant decrease in the HAS from 2015 to 2020, with an average annual decline rate of −0.10 [95% confidence interval (CI): −0.15 to −0.06] in Table 2. Two physical activity engagement patterns were significantly associated with a greater decrease rate in the HAS when compared with the reference group. OAs who remained physically inactive over all survey points [pattern 8: 2015 (N), 2018 (N), 2020 (N)] and those who were active engagers initially but became inactive at the last 2 survey points [pattern 4: 2015 (Y), 2018 (N), 2020 (N)] showed additional annual decline rates of −0.10 (95% CI: −0.16 to −0.04) and −0.11 (95% CI: −0.20 to −0.02) in the HAS, respectively. Other physical activity engagement patterns were not associated with a greater decrease in the HAS when compared with the reference group (Table 2).
Generalized Estimating Equations Analysis for Examining Between-Group Differences in the Healthy Aging Score from 2015 to 2020.

CI = confidence interval.
P < .05.
We compared data between 2018 and 2020 to investigate the ongoing effects of the Healthy China 2030 initiative on the health of OAs. As shown in Table 3, 19% of OAs became active engagers, whereas 15.6% of OAs became physically inactive, resulting in a net increase of 3.4% in the number of OAs engaging in physical activity. We included OAs who were active engagers in 2018 and 2020 in the reference group. The GEE analysis revealed that OAs who remained inactive exhibited a significant decline in the HAS. However, no significant difference was noted among the other changes in physical activity engagement patterns.
Ongoing Effects of the Healthy China 2030 Initiative on Physical Activity Patterns, Healthy Aging Scores, and Between-Group Differences in Healthy Aging From 2018 to 2020 (n = 3030).
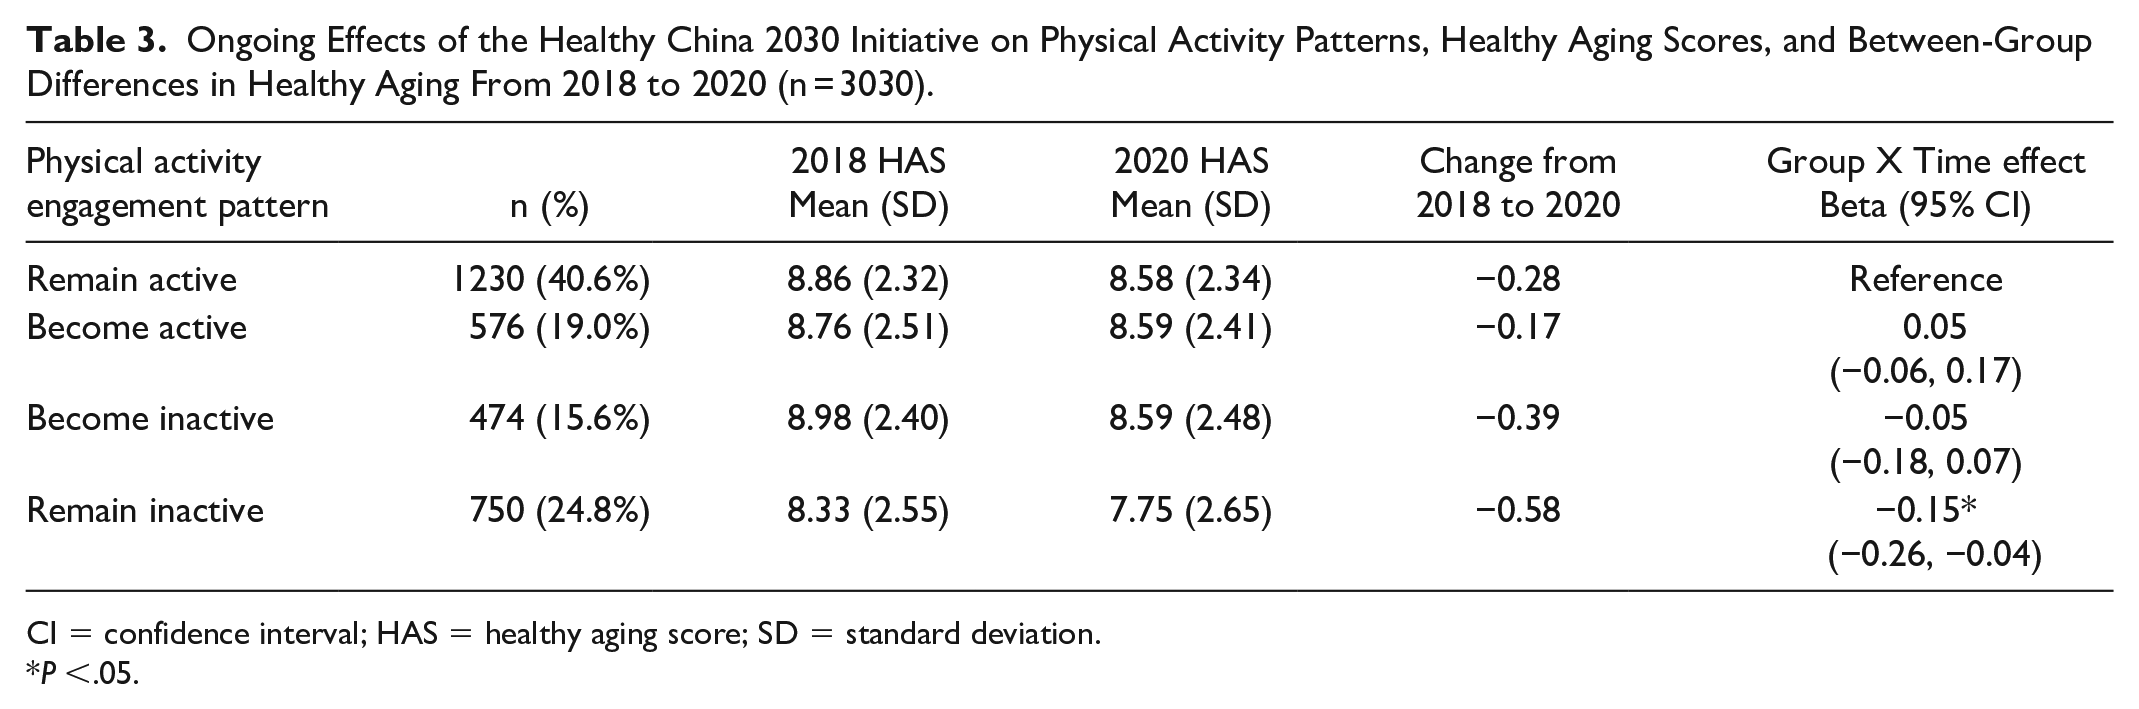
CI = confidence interval; HAS = healthy aging score; SD = standard deviation.
P <.05.
Discussion
The results of this study revealed an increase in engagement in physical activity in the same cohort of OAs from 2015 to 2020. Geographical variations in healthy aging were observed, with OAs in northern China generally outperforming those in southern China. In particular, 4 regions in northern China, namely, Hebei, Heilongjiang, Liaoning, and Shaanxi, had suboptimal HASs, whereas 7 regions with suboptimal HASs were located in southern China. Similarly, only two regions in southern China, namely, Guizhou and Jiangsu, exhibited the best performance in terms of healthy aging, and the remaining four best-performing regions were in northern China. Previous studies have indicated that a greater proportion of Chinese individuals in northern regions practiced suboptimal lifestyle behaviors than those in southern regions.21,22 This finding suggests that OAs in northern China have suboptimal health, which should result in a lower HAS. The inclusion of self-rated overall health in the HAS may explain the contradictory findings of this study. Declining health conditions are common among OAs. However, with advancements in disease management, OAs can live well if their health condition is managed effectively. 23 In recent years, the expansion of high-quality medical services in China has provided all individuals, including OAs, with more opportunities to receive such services and manage their health in a better way, resulting in improved self-rated health. 24 Studies showed that self-rated health was significantly improved by the age-friendly outdoor spaces, buildings, 25 and policy. 26 The assessments of healthy aging including items of self-rated health could capture the development of age-friendly cities and communities and the implementation of age-friendly policy at individual level. In turn, the better HAS in northern China in our study suggests the better development and implementation of healthy ageing interventions than those in southern China. Future studies should be conducted to identify factors contributing to the success of those best-performing regions.
The detrimental effects of physical inactivity later in life are substantial. In terms of physical activity engagement patterns between 2015 and 2020, we observed that 4.8% of OAs who were active engagers in 2015 became consistently inactive in both 2018 and 2020 (pattern 4). In our GEE analysis, we found that their HAS decreased significantly, similar to those who had remained inactive since 2015 (pattern 8). This finding is concerning because it suggests that regardless of whether OAs were actively or inactively engaged in physical activity in their early years, their health deteriorated similarly when they disengaged physical activity over a 2-year period later in life. Continuous disengagement in physical activity reduces the muscle mass and strength resulting a decrease in muscle function. 27 Further, their cognitive function, cardiorespiratory fitness, and immunocompetence may be reduced that impact their well-being.
In addition, patterns 2 and 6 are concerned that OAs became inactive engagers in 2020. The detrimental effects on their well-being may accumulate and be significant in future follow-ups. Moreover, as OAs age, their well-being deteriorates exponentially in a short time once they disengage in physical activity. Conversely, we observed a slight improvement in the well-being of OAs when they engaged in physical activity in 2020 (patterns 3, 5, and 7), regardless of their physical activity engagement status in previous years. This finding suggests that although the health benefits of physical activity engagement are declining in late life, re-engagement in physical activity can slow the decline rate of OA well-being.
Our study provides an essential foundation for assessing the effects of a national health initiative, Healthy China 2030, on the well-being of OAs. A study demonstrated that the implementation of Healthy China 2030 significantly increased the frequency of physical activity. 28 In line with our study, a sharp increase of 24.5% was observed in OAs engaging in physical activity after the launch of Healthy China 2030. OAs may pay more attention to their health once they participate in the CHARLS survey. But we observed a net increase of 3.4% in OAs engaging in physical activity between 2018 and 2020, during the implementation of Healthy China 2030. Conversely, an English longitudinal study reported a net decrease of 2.9% in people engaging in physical activity. 13 Our results suggest that Healthy China 2030 is an effective national initiative to enhance OAs’ engagement in physical activity.
Implications
OA’s well-being decreases gradually over time, especially among those with continuous physical activity disengagement patterns. The significant findings of disengagement in this study demonstrate the importance of regular assessment of OA’s practice of physical activity to identify and intervene at the early stage. For example, a further assessment is suggested if the OA reports being physically inactive in two consecutive 3-month follow-ups. The WHO integrated care for older people guidance can be used to assess their needs of supports to practice physical activity. 29 Tailored interventions can be developed by multidisciplinary teams to support OAs. With the increase in smartphone ownership, mobile applications represent an effective strategy to support OAs to practice physical activity. 30
In addition to supporting the practice of physical activity, increasing retention and re-engagement in physical activity are necessary to slow the decline rate of OA well-being. The involvement of the government is crucial. Jenkin et al. 31 reported that sports facilities and physical activities designed specifically for OAs reduced the attrition rate and increased re-engagement in physical activity. The government can consider a certain percentage of sports facilities that are designed for OAs at each sport center. Additionally, appointing health ambassadors and implementing incentives are some strategies that can have sustainable effects in engaging OAs in physical activity. 32 The government can collaborate with different community parties to appoint health ambassadors to support OAs to practice physical activity, and the incentives can be a form of subsidy for medical check-ups. Eventually, OAs have suitable places and personnel to sustain regular practice of physical activity. The provided incentives allow OAs to have more opportunities to meet healthcare professionals to tailor appropriate interventions to support their engagement in physical activity.
Although a net increase of engaging in regular physical activity was found in this study, there were 15.6% and 24.8% of OAs became and remained inactive after the initiation of Healthy China 2030, respectively. In addition to assess their capacity to practice physical activity, mass participation sporting events for OAs could be launched regularly to motivate inactive OAs to engage in physical activities. 33 Then aforementioned strategies, i.e., health ambassadors and incentives, could be applied to increase their retention.
Strengths and Limitations
This study has several limitations, similar to a previous study using the CHARLS dataset. 20 First, the data were collected through a combination of interviewer observations and self-reporting by the interviewees. However, the reliability of the data is maintained by the standardized training protocol followed by all the interviewers. Second, certain potential factors affecting physical activity engagement, such as the impact of expanding pilot projects for OAs, were not analyzed in this study because of data unavailability. Third, the variables in the analysis were limited to the dataset used. We acknowledge that the criteria of physically active in the survey was a low threshold. Although the low threshold moderate-to-vigorous physical activity engagement patterns slowed the significant decline in OA’s well-being, the results should be interpreted with caution. Fourth, sample size calculation was not performed in this secondary data analysis. But we included all cases with complete data for analysis. Lastly, 2020 data collection was conducted during COVID-19, which might have impacts on the report of outcomes. However, a national study showed that people practicing physical activity and other health behaviors were similar before and during COVID-19. 34 The use of a national dataset allowed for a systematic approach to generate evidence on healthy aging at both the national and regional levels. Additionally, the longitudinal data allowed us to explore the dynamic effects of physical activity engagement on the well-being of OAs.
Conclusions
The present study revealed an increase engagement in physical activity and decline in well-being among OAs in China from 2015 to 2020. The well-being of OAs deteriorates when OAs age, and geographical variations were noted. Deterioration of well-being is accumulated when OAs disengage physical activity continuously. Like abstinence from any physical activity, continuous disengagement in physical activity later in life was found to have a detrimental effect on OA’s well-being. Furthermore, our study demonstrated that the national health initiative has had a positive impact, increasing OAs’ engagement in physical activity. Early identification and appropriate support can increase their engagement in physical activity.
Supplemental Material
sj-docx-1-inq-10.1177_00469580251314776 – Supplemental material for Re-Engagement in Physical Activity Slows the Decline in Older Adults’ Well-Being – A Longitudinal Study
Supplemental material, sj-docx-1-inq-10.1177_00469580251314776 for Re-Engagement in Physical Activity Slows the Decline in Older Adults’ Well-Being – A Longitudinal Study by Hon Lon Tam, Kai Chow Choi, Ying Lau, Leona Yuen Ling Leung, Alex Siu Wing Chan, Lilin Zhou, Eliza Mi Ling Wong and Jonathan Ka Ming Ho in INQUIRY: The Journal of Health Care Organization, Provision, and Financing
Footnotes
Author Note
Alex Siu Wing Chan is currently affiliated with the Department of Social Work, Faculty of Arts and Social Sciences, Hong Kong Baptist University, Hong Kong.
Author Contributions
Conception and design of the work: HLT, YL, EMLW; Data curation and project administration: LYLL, LZ; Data visualization: ASWC, HLT; Data analysis: KCC, HLT. Interpretation of data: HLT, KCC, LYLL, JKMH; Drafting the article: HLT, YL, LTLL. Critical revision of the manuscript: all authors. Final approval of the manuscript: all authors.
Data sharing
Declaration of Conflicting Interests
The author(s) declared no potential conflicts of interest with respect to the research, authorship, and/or publication of this article.
Funding
The author(s) disclosed receipt of the following financial support for the research, authorship, and/or publication of this article: This work was supported by the Nethersole School of Nursing (CV-2024-AT). The funder had no role in the study design, data collection, data analysis, data interpretation, or writing of the report.
Informed consent
Informed consent was obtained from all the participants, and the study was approved by the Institutional Review Board of Peking University (IRB00001052-11015).
Supplemental Material
Supplemental material for this article is available online.
References
Supplementary Material
Please find the following supplemental material available below.
For Open Access articles published under a Creative Commons License, all supplemental material carries the same license as the article it is associated with.
For non-Open Access articles published, all supplemental material carries a non-exclusive license, and permission requests for re-use of supplemental material or any part of supplemental material shall be sent directly to the copyright owner as specified in the copyright notice associated with the article.