
Abstract
Food advertising may influence food preferences and consumption. Due to these advertisements’ role in health, the present study has updated the data available on television and radio food advertisements in Iran until 2020. Meanwhile, food advertisements on billboards have been analyzed for the first time. All programs broadcast on two TV and radio channels were downloaded and saved 24 h daily for one week (November 10-16th, 2020). Also, on November 15th billboards located on the busy highways of Tehran were photographed. Validated protocols analyzed the advertisements. A total of 6026 advertisements were analyzed, including 4287 on TV, 1545 on radio, and 194 on billboards. The total duration of TV and radio advertising was 48.6 h. Food products were the most displayed advertisements on TV, radio, and billboards (33.6%). Overall, “condiments” and “desserts” were the most frequently advertised food products among all the studied media (20% and 17%, respectively). The most common advertising appeal included “High quality” on TV and billboards and “Stimulation of profiteering and profit-seeking” on the radio. Advertising violation based on Iran’s regulations, Nutrient profile model for the marketing of food and non-alcoholic beverages to children in the WHO Eastern Mediterranean Region, and International Network for Food and Obesity / Non-communicable Diseases (NCDs) Research Monitoring and Action Support (INFORMAS) was reported to be 13%, 74%, and 51%, respectively. Food products ranked the highest among all the advertisements. A clear violation of domestic and international advertising regulations was observed which given the high share of food advertising in the studied media, could endanger public health. This study supports the need for stricter regulations and adherence to international standards to improve nutritional status.
Food advertisements in Iran predominantly have promoted products high in fat, salt, and sugar and have violated advertising standards.
The content of food advertisements became known in this project. Meanwhile, the percentages of violations of advertising standards were determined.
The findings can update policymakers on the status of advertisements and the extent of violations of advertising standards, and as a result, help establish evidence-informed policies.
Introduction
Non-communicable diseases (NCDs) are among major public health concerns worldwide, 1 and were responsible for 42 million deaths globally, making up 74% of all recorded deaths. This rise in NCD-related deaths, particularly in low- and middle-income countries (LMICs), has been on the upward trajectory. 2 Iran, a lower-middle-income country, is not an exception in this regard and is facing NCDs as the major health problem of the country. Eithy three percent of deaths in the country occur due to NCDs. 3
According to epidemiological studies, the main risk factors for them worldwide are almost the same. 4 Physical inactivity, unhealthy diets, tobacco use, and the harmful use of alcohol are modifiable risk factors for NCDs.5 -7 A recent review showed that some risk factors are more prominent in Iran because of unhealthy dietary habits such as high salt consumption and high consumption of saturated oil, physical activity barriers, and widespread tobacco use. 7
Although an unhealthy diet is among the major risk factors of NCDs, it can be modified by effective health policies. Therefore, it is very important to understand the context in which the selection of junk foods is facilitated.
It is well documented that exposure to different types of food advertisements affects the food preferences and intake of children and adults.8 -10 A meta-analysis of children found that exposure to unhealthy food advertisements affected dietary intake and behaviors during or immediately after exposure. 11 It was also shown that adults who had spent more time watching TV were higher consumers of unhealthy food products such as soft drinks, sweets, and snacks. 12 Another study indicated that children came into contact with elevated amounts of “additional” sugary items, notably beverages, bread and bakery items, and dairy products. These 3 types of food had the most TV advertisements and were featured most frequently on weekly shows. 7 Furthermore, several studies indicated that food cues in marketing can influence preferences for the advertised foods and increase their consumption and purchase. In addition, exposure to unhealthy food marketing has been associated with health-related problems such as living with overweight and obesity.13 -15 Over the last ten years, Iran’s healthcare system has worked to prevent the promotion of unhealthy products and hazardous services. Significant progress has been made in regulating advertising in public spaces and print media. However, measures taken to control TV and radio ads have not been as successful. 16
Several studies have revealed the status of broadcasting food advertisements in different media in Iran, so far. Also, the effect of various types of food marketing exposure on public health and food decision-making has been investigated in the country. According to the findings, food advertisements usually displayed nutritionally low-value foods, in addition the clues that some advertisements had given to the audience, especially children, led them to make unhealthy choices.17 -19
However, the most recent published study regarding the problem was done 9 years ago. 20 Additionally, almost all studies had focused merely on TV food advertisements. 21 Therefore, to update the existing data, the current study aimed to analyze the content of food advertisements on Iran’s TV and radio in 2020. We also analyzed the content of food advertisements on Tehran’s billboards in the current study.
Materials and Methods
The study was a content analysis of advertisements. It was conducted during an ordinary week (November 10th to 16th) in 2020. The week coincided with no special religious, national, or political occasion and contained 7 consecutive full days.
Data Collection
All the programs broadcast on 2 TV channels ( I and II) and radio channels (Payam and Iran) were downloaded through the Telewebion website 22 and the Iranseda application, 23 respectively. Currently, 20 radio, 24 TV, and 33 provincial channels broadcast programs daily in Iran. However, we couldn’t check all the channels due to limited budget and personnel. Therefore, for conducting the study, we chose the most popular radio and television channels as representatives of all channels to cover all age and gender groups, meanwhile, the studied TV and radio channels were accessible throughout the country.
Four researchers independently downloaded TV and radio programs. The channels selected were the most widely broadcast in Iran. Meanwhile, on Saturday, November 15th, 2020, at the same time as the recording of radio and TV programs, all (194) billboards located on the 3 busy highways of Tehran, namely Hemmat (east and west), Chamran (north and south) and Hakim (west to east) were photographed by 1 researcher while another researcher accompanied to help her with taking photos. The mentioned highways were considered among the main highways of Tehran, and at the same time, the possibility of accessing them was more practical.
Measures
The validated protocol was used to analyze the content of the advertisements in the target media. It was developed based on the INFORMAS protocol for analyzing food advertisements. 24
Briefly, standardization was conducted in several stages. Initially, experts’ suggestions about the translated protocols of each section were reviewed, revised, and sometimes changed. Then, according to experts’ opinions face and content validities of protocols were assessed. Data from 2 recent studies were coded using the modified protocols. Eventually, the reliability of the
protocols were reported by measuring the coefficient of agreements between the researchers.
The details of the validation of the protocols have been explained elsewhere. 25 All strategies and claims were taken from the protocol. The duration of advertisements was calculated manually by subtracting the time of end from the time of initiation of each advertisement. The rate of advertising violations was measured according to Iran’s regulations, 26 the Nutrient profile model for the marketing of food and non-alcoholic beverages to children in the WHO Eastern Mediterranean Region, 27 and INFORMAS. 24
Data Analysis
The unit of analysis was an “advertisement” not the brand. In other words, if the brand of a product was shown in different advertisements all were analyzed. Data were analyzed in 2 stages. In the first stage, all the advertisements on TV, radio, and billboards were observed (or heard) and coded by the evaluators. In the second stage, only food advertisements were analyzed. Three evaluators observed and analyzed the advertisements on TV. One researcher analyzed channel 1 and 2 researchers analyzed channel 2 separately for 3 and 4 days, respectively. They fast-forwarded through TV programs and watched the advertisements in full.
Two evaluators heard the radio channels (one channel each) and fast-forwarded through radio programs to hear radio advertisements. To record the characteristics of the advertisements, the evaluators watched or heard each advertisement at least 3 times.
One evaluator viewed all photographs of the billboard advertisements to fulfill the first stage. All related data were recorded on 2 separate sheets, 1 for all the advertisements and another specifically for food advertisements.
General information recorded for each TV or radio advertisement included channel name, broadcast date, the weekday, the time of initiation and end of broadcasting, duration of the advertisement (second), brand, and the advertisement category (whether the advertised product was related to food or other products). The general data collected for the billboard included the billboard location, title of the billboard, description of the billboard, brand, and type of the advertised product. All brands of the advertised product were recorded; however, they were not divulged in the final report. Data on advertising appeals, violation of regulations of various references including Iran, WHO, and INFORMAS were collected only for food products. Food advertisements were categorized based on the items frequently advertised; therefore, the categories were either food groups (eg, dairies) or single food products (eg, tea). Advertising violations, food categories advertised, and advertising appeals were coded for all the media.
Reliability was measured for the name of the food products, brands, time duration calculated for each advertisement, frequencies of advertising violations, and advertising appeals.
To determine reliability, the method of checking the level of agreement between researchers was used (27). For this purpose, 20% of TV and 20% of radio programs were reviewed and evaluated by 2 researchers, independently. The agreement coefficient was calculated using the following formula (38). In total, the agreement coefficient ranged between 93% and 100%.

Statistical Analysis
Analyses were done using Excel (version 16.68, 2019) and IBM SPSS Statistics 26. We did not test any hypothesis and only descriptive statistics were calculated. Data have been presented as numbers and percentages.
Results
A total of 336 h of TV programs, 336 h of radio programs, and 194 commercial billboards were recorded. Overall, 4287 and 1545 advertisements were aired on 2 TV and radio channels, respectively which took 48.6 h (1 75 091 s). The frequency of different types of advertisements during the study period for all media is presented in Table 1. According to the table, regarding the frequency, food products advertisements on TV, radio, and billboards ranked first. “Home appliances and services/construction equipment” and “cosmetic, health, and pharmaceutical products” ranked second and third for all 3 advertising formats. “Sports equipment” was seen only on channel 1 of TV. “Other products” in TV advertisements included magazines, carpet washing services, plastic products, glue, traveling services, agricultural bags, textile parts, envelopes, stocks, child safety seats, and computer services. “Other products” on the radio included textile industry parts, wood industry, agricultural bags, poultry farming, glue, cardboard, silk, slaughterhouse, safety equipment, and plastic products. As can be seen in Table 1, advertisements for “home network products” and “building construction, and sales services” had only been seen on the billboard. “Other products” on the billboards were related to banks, mobiles, capital management agencies, travel services, and Friday auctions.
The Frequency of the Advertisements Broadcast on Iran’s TV, Radio, and Billboards, November 10-16, 2020.

Based on Chi-Square test the difference was significant (P < .0001).
The duration of the advertisements broadcast on TV and radio can be seen in Table 2. Based on the table, regarding the time duration, food products ranked first among other types of advertisements on TV and radio. In other words, food advertisements ranked the highest in frequency and time duration. As shown in Table 2, “home appliances and services/construction equipment,” and “cosmetic, health, and pharmaceutical products” ranked second and third on TV and radio, respectively. In addition, the advertisements of TV took almost 3 times as much as radio advertisements (36.4 h (1 31 114s) vs 12.2 h (43 977s)).
The time duration of the advertisements broadcast on Iran’s TV and radio, November 10-16, 2020.

Based on ANOVA test the difference was significant (P < .000).
As shown in Figure 1, the most frequently advertised food groups on the media were assigned to condiments (20%), followed by desserts (17%), and dairy products (13%). The healthy drinks (0.6%) were the least displayed group. Condiments included pickles, vinegar, tomato paste, ketchup, and low-fat sauces. The ingredients of the desserts were cakes, chocolates, jellies, ice-creams, candies, cookies, honey, chewing gums, and jams. By dairy, we meant all foods made of milk except butter and cream which were classified as fat spreads.
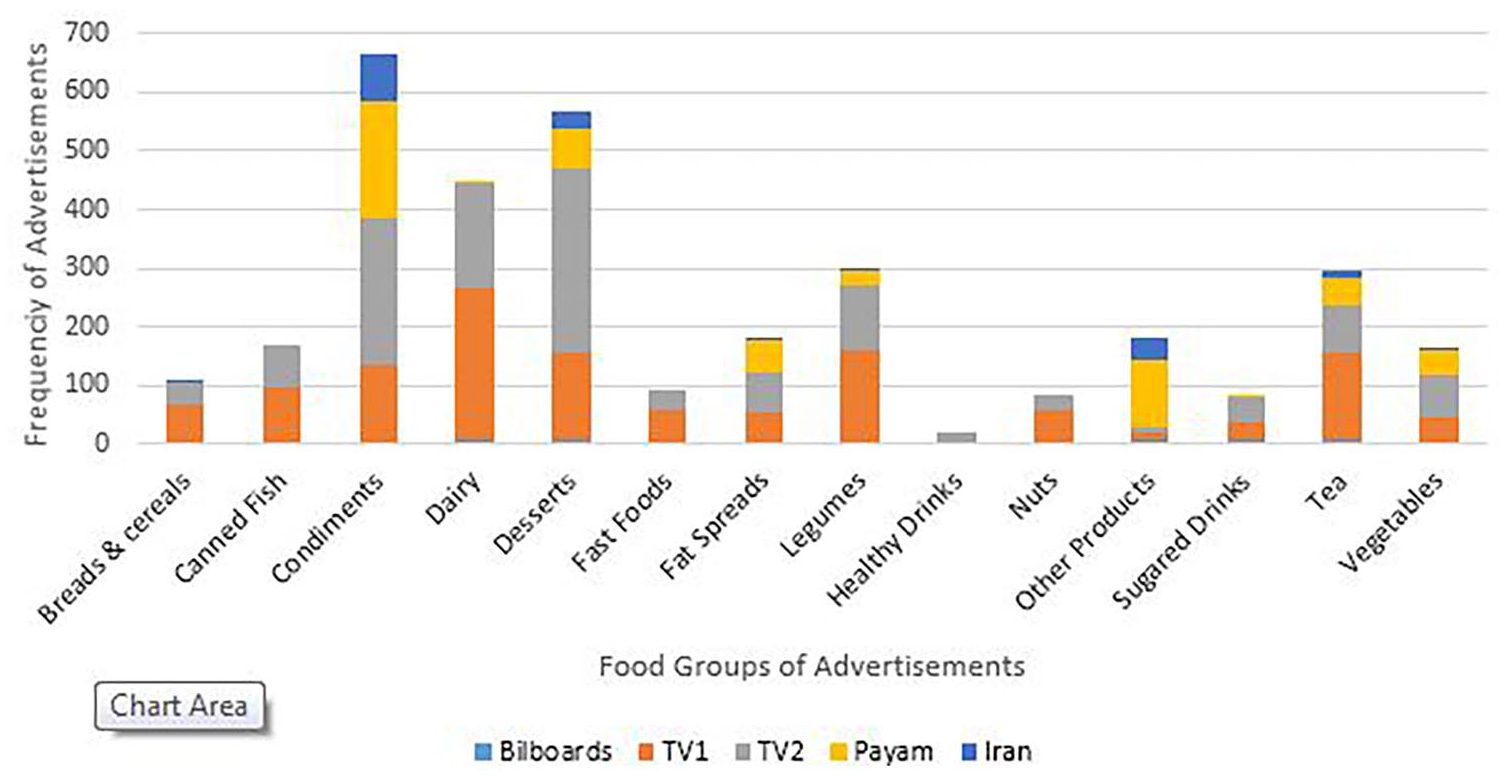
The percentage of different types of food advertisements broadcast on Iran’s TV, Radio, and billboards, November 10-16, 2020.
Regarding the advertising appeals of food advertisements (Table 3), “High quality and careful preparation” was the dominant advertising appeal on TV channels and billboards. However, “Stimulation of profiteering and profit-seeking” ranked as the most frequent advertising appeal among radio food advertisements.
The Advertising Appeals in Food Advertisements on TV, Radio and Billboards from 19 to 25 November, 2020.

According to Table 4, the rate of advertising violation based on Iran’s regulations, the Nutrient profile model for the marketing of food and non-alcoholic beverages to children in the WHO Eastern Mediterranean Region, and the International Network for Food and Obesity / Non-communicable Diseases (NCDs) Research Monitoring and Action Support (INFORMAS) was reported to be 13%, 74%, and 51%, respectively. The non-recognizable advertisements included food advertisements that depicted a brand of healthy and unhealthy options, so it was impossible to judge whether it was authorized.
Rate of Advertising Violations According to 3 References of Iran’s Regulations, Nutrient Profile Model for Food Marketing of WHO Eastern Mediterranean Region, and INFORMAS.

P = Permitted; NP = Not permitted; NR = Non-recognizable; M = Miscellaneous.
Based on Chi-Square test the difference between violation rates were significant (P < .000).
In this regard, there were more cases of permitted advertisements than unauthorized ones based on Iran’s regulations (P < .001). However, according to the WHO and INFORMAS, the unauthorized food products were advertised significantly higher than the authorized ones (P < 0.001)).
Discussion
In this descriptive study, the content of food advertisements broadcast on 2 TV and 2 radio channels on IRIB and billboards across the city of Tehran were analyzed for 1 week. During the period, food advertisements ranked first among all advertisements broadcast on radio and TV in terms of duration and frequency. More than one-third of the advertisements on TV channels were for food products; this was slightly higher on Channel 2 than on Channel 1. The frequency of food products displayed on the billboards also ranked first such that nearly one-fourth of all the investigated billboard advertisements were allocated to food products. Food products with low nutritional value were the most frequently advertised among all the studied media and advertising violation based on the standards of Iran, WHO, and INFORMAS was reported to be relatively high.
Our findings were similar to the findings of previous research conducted in Iran indicating that food advertisements compared to other advertisements ranked among the highest.28 -32
Studies conducted in Saudi Arabia, South Africa, Turkey, and Switzerland also yielded similar results and indicated that food advertisements have been commonplace, especially during children’s programs.33 -36
A noteworthy point in the recent study as compared to the previous studies is an increase in the total duration of all advertisements as well as advertisements for food products on each TV and radio channel (47 min of food advertisements out of 157 min per day on TV and 23 min of food advertisements out of 52 min per day on radio).18,28
Advertisements on TV were almost 3 times more than radio in terms of frequency and broadcast time. It could be because television is more attractive to audiences. The visual appeal of television may enhance product recall and provoke stronger reactions. So, it seems the advertisers still prefer TV to other mass media. 32
Among all the different advertising appeals on TV and billboards, “high quality and careful preparation” and “stimulation of appetite” were broadcast most of all. “Stimulation of profiteering and profit-seeking” was the most frequent advertisement appeal on the radio. It indicates that the studied advertisements were more consumer-oriented than health-oriented. The results also imply that food advertisers promote taste as a fundamental reason for selecting food products and value it more than other health-related traits.
About 16% of the advertisements used the appeal “health and healthy eating” on the billboards. This is an important point because some of the audience may be interested in the health information of the product and learn from it. Therefore, auditing the educational content of all advertisements, especially food ones, is very important.
In a similar study conducted in Iran, the most frequent promotional appeals on channels 1 and 2 on TV were “stimulation of hunger/thirst” and “stimulating curiosity/entertaining”, respectively. 31 A lack of health and nutritional desirability was also witnessed in studies conducted on advertisements broadcast during children’s TV programs in Malaysia. 32 Emotional appeals have also lured the audience to the product. 33 In a study in the UK, it was shown that emotional appeals such as fun and joy were used in advertisements to increase consumption. 34
The appeals used in unhealthy advertisements to attract customers can be used to promote and educate about healthy eating. It has been shown that sensory advertising involves consumers’ awareness, decision, and practice. For promoting healthy eating “single-sense” rather than “multiple-sense” advertisements which engage a combination of sight, touch, and smell multiply the effectiveness of the advertising. 37
The most advertised food products on the 3 media were condiments followed by desserts. Although all the members of the condiments group in the present study are not typically classified as unhealthy foods (eg, tomato paste), items such as pickles, kinds of ketchup, and tomato paste include salt or additives hereupon we cannot endorse them as healthy options. So, we can classify them as unhealthy foods. The members of the dessert group are identified by foods that are high in sugar and fat, some of them are highly processed. Furthermore, nuts and seeds were mainly salty options. According to the mentioned contents, the share of all unhealthy foods including fast foods, desserts, condiments, salty nuts and seeds, fats, and sweetened drinks, in our study was 49.8% (1672 vs 3355). In other words, half of the advertised food products were unhealthy.
The most advertised food products on the campus of a university in Ghana were sugar-sweetened drinks. 38 Based on a study in South Africa, desserts and sweets, fast foods, and sweetened drinks were also the most frequent foods advertised throughout the TV viewing time of family. 33
During the study period, the violation of health policy rules and regulations regarding advertising foods with low nutritional value was understood. According to the WHO and INFORMAS, the proportion of unauthorized food products was significantly higher than that of IRAN indicating stricter rules for monitoring food advertisements in the mentioned authorities. Of course, this may be justified by the fact that the regulations in the 2 international authorities had specifically targeted children, however, in Iran, the whole society was targeted. According to a systematic review conducted in Iran, most of the studies had disobeyed the rules and regulations of advertising. Examples of breaking the law included advertising food products of questionable nutritional value and applying claims inconsistent with scientific facts. 39 Based on a study in Guatemala according to the WHO, most broadcast food advertisements were not permitted to target children. 40 In a study that examined the extent of food advertising on the campus of Ghana’s largest university 57.6% of food commercials were unhealthy. 38
Public Health Implications
In the current study the high share of unhealthy food advertisements such as fast foods, ready-to-eat foods, mayonnaise, cakes, biscuits, and sugar-sweetened beverages was significant. Hence, close monitoring of advertisements should be among the main tasks of the officials.
Additionally, health educators can use certain persuasive methods used mostly in advertisement content to promote healthy, nutritional foods, especially for children. For instance, health promoters can collaborate with marketers to find ways to promote healthy options through persuasive strategies and encourage the viewers to try them and absorb the message that they taste good. By being aware of the advertisement’s content, effective interventions can be designed and implemented to promote the consumption of healthy foods. Furthermore, increasing nutritional awareness in the community can greatly offset the impact of unhealthy food advertisements.
The current study has strengths in several aspects. We analyzed the most popular TV and radio channels 24 h a day for a week. The selection of the channels on TV and radio was done in such a way as to include children’s programs. Also, to our knowledge, the billboards were evaluated for the first time in this study.
Although the current study is the most up-to-date study of its kind, it has some limitations. If we could analyze more radio and TV channels and billboards, we would have presented a more complete and accurate picture of the state of advertising in the country. In addition, if we could follow the advertisements in several seasons it would be possible to check rare advertisements, the advertising trend, and the advertisements depending on the season. Furthermore, conducting an experimental study in parallel with the present study could provide valuable evidence regarding the effect of advertisements on different age and gender groups. We hope that the shortcomings of the current study will be addressed by future research in which a larger number of radio and TV channels and billboards are examined, and in addition, the effect of advertising on the food choices of the audience, especially children, can be tracked in parallel.
Conclusion
The present research suggests that food advertisements had a prominent share in the investigated media. Both their duration and frequency were significant in the media investigated. Also, a clear violation of domestic and international advertising regulations was observed. This study highlights the urgent need for strategic interventions to mitigate the impact of unhealthy food advertising and promote healthier dietary behaviors among the public.
Footnotes
Acknowledgements
The authors wish to thank Shadab Shariatzadeh for her sincere contribution to data collection.
Authors Contribution
MA contributed to conception and design, data curation, formal analysis and interpretation; funding acquisition, validation, reviewed and edited the manuscript, and agreed to be accountable for all aspects of work ensuring integrity and accuracy. DGh contributed to conception and design; contributed to analysis and interpretation; drafted the manuscript; and agreed to be accountable for all aspects of work ensuring integrity and accuracy. MSh, drafted the manuscript. MSh, MB, and MAg contributed to investigation, formal analysis, validation, and agreed to be accountable for all aspects of work ensuring integrity and accuracy. NSh contributed to investigation, data curation, and agreed to be accountable for all aspects of work ensuring integrity and accuracy. All authors approved and agreed to be accountable for the content of the work.
Data Availability Statement
Data will be available upon written request to the corresponding author.
Declaration of Conflicting Interests
The author(s) declared no potential conflicts of interest with respect to the research, authorship, and/or publication of this article.
Funding
The author(s) disclosed receipt of the following financial support for the research, authorship, and/or publication of this article: This study was funded by National Nutrition and Food Technology Research Institute, Grant number 99-14883, Date: Oct/01/2021. The funding body had no role in the designing, data collection, analysis, and interpretation of data and in writing the manuscript or the decision to submit the manuscript for publication.
Ethical Consideration
This study was approved by the Ethical Committees of National Nutrition and Food Technology Research Institute, Shahid Beheshti University of Medical Sciences. All methods were carried out in accordance with relevant guidelines and regulations. Code: IR.SBMU.nnftri.Rec.1398.072.
Date of approval: 2019/Jan/04