
Abstract
In over half of US states, health planning boards monitor and control the supply of health care through certificate of need (CON) laws. The COVID-19 pandemic led several states to impose moratoria on CON regulations, hoping to bolster hospital and skilled nursing facility (SNF) beds. Using a difference-in-difference research design, we leverage 2015 to 2021 cost report data from SNFs to study the association between COVID-related CON moratoria and health care supply. Counties that imposed moratoria experienced a slight decline in per-capita SNF bed count. However, once adjusted for potential differential shocks in pre-pandemic high utilization counties, we find little evidence that moratoria led to increased nursing home capacity, overall or by urbanicity. In the context of nursing homes, we conclude that CON deregulation was relatively ineffective at mitigating pandemic-era supply concerns.
Certificate of need (CON) laws on nursing homes are associated with lower nursing home capacity, higher costs, and lower quality of care; CON states experienced higher hospital utilization during the pandemic compared to non-CON states.
This article studies how CON moratoria during the COVID-19 pandemic affected nursing home capacity and utilization.
We find that CON moratoria during the pandemic had limited effects on nursing home bed capacity, staffing levels, facility numbers, and utilization, suggesting pandemic-era policy efforts should be focused elsewhere.
Introduction
To increase the availability of health care supply during the pandemic, many states in the United States (US) imposed moratoria on enforcing certificate-of-need (CON) regulations. CON regulations, which vary by state and type of service, are used to control entry and investment by health care providers, such as hospitals and skilled nursing facilities (SNFs). Changes to existing facilities and new investments must be approved by a state commission, often composed of political appointees and experienced industry professionals representing hospitals and physicians. While many states have repealed these regulations, over half of US states continue to have CON laws, Policy reforms around CON regulations remain contentious. Proponents argue that CON laws increase access to high-quality and socially valuable care and lower spending. At the same time, critics contend that they stifle competition and innovation, potentially leading to higher costs and reduced quality.
Studies examining CON laws prior to the pandemic suggest that they limit provider entry and reduce competition. 1 Several studies have focused on SNF CON laws and how they impact capacity, prices, and quality. Harrington et al, 2 studying SNF CON between 1979 and 1993 across all states, found that states with CON faced significant reductions in the growth rate of bed capacity. Nyman, 3 studying Wisconsin, found that SNF CON led to higher prices for the privately insured. Grabowski and Angelelli 4 found that CON regulations mitigate the positive association between nursing home reimbursement and quality (as measured by pressure ulcers). CON policies may also have distorted care away from home health care, increasing health care costs further. 5 Hence, many policymakers and academics have urged for the repeal of SNF CON laws.1,6
Although the effect of CON deregulation has been documented in non-pandemic time periods, how the sudden moratoria during the pandemic affected construction has received less attention. There are 2 competing hypotheses of the role of CON moratoria during COVID-19. First, it could allow areas with greater unmet need the ability expand. Entry regulations prevent firms from providing the efficient level of capacity. Absent these rules, firms could address positive demand shocks. An alternative theory is that there would be limited effects on capacity. Labor shortages coupled with declining demand may have limited the value of expansion. We test these in this paper in the context of nursing homes.
We know of 2 studies that also examine the impact of CON moratoria during COVID-19. Mitchell and Stratmann 7 study the association of hospital bed utilization rates and CON, finding that CON states faced higher levels of utilization. Hospital bed utilization was not affected by moratoria. Roy Choudhury et al 8 studied the association of mortality and CON moratoria, finding that states with high utilization and moratoria had lower mortality than non-moratoria CON states.
However, these 2 studies did not examine whether laws were associated with changes in the number of beds or changes in investment. For example, bed utilization, defined as bed days used as a proportion of total bed days available, could reflect both changes in patient demand and capacity. These outcomes are commonly under the purview of the CON regulations. Thus, it is difficult to ascertain whether the mechanism of a mortality effect operates through CON without examining the impact on capacity and investment. For example, moratoria states with high COVID utilization may have imposed other emergency orders that led to lower mortality regardless of facility investment.
Our project builds upon these studies by focusing on the long-term care setting. SNFs were under substantial strain during the pandemic. They faced labor shortages and higher COVID transmission rates, increasing mortality.9-11 Yet, little is known about how state policies such as CON moratoria affect these non-hospital providers. We leverage SNF cost report data between 2015 and 2021 to study these outcomes and measures of utilization and staffing. Using a differences-in-differences approach, we shed light on the impact of policies meant to alleviate strain on SNFs. These quantitative findings are critical for policymakers as they consider future pandemic preparedness.
Methods
This study examines the association between CON moratoria and nursing home availability, use, and staffing. To do so, we linked data on CON policy moratoria with data from the Centers for Medicare and Medicaid Services (CMS) on SNF staffing and operations. CMS is a federal agency within the United States Department of Health and Human Services (HHS) that administers major healthcare programs, such as health insurance for older adults (Medicare).
Certificate of Need Data
To collect data on SNF CON and pandemic-era moratoria, we begin by using the 2016 annual report published by the American Health Planning Association (AHPA). This yearly report summarizes state CON regulations, including those specifically regulating SNF capacity. We supplemented these data with information on additional CON changes since 2015, which is the start of our cost report data. Since 2015, Indiana has added, and New Hampshire has partially repealed CON programs. CON moratoria during the pandemic are collected from Choudhury et al. We cross-checked these data with state emergency announcements across the lower 48 states and the District of Columbia, finding additional moratoria from Kentucky and the District of Columbia.
Nursing Home Cost Reports
To measure SNF outcomes, we used provider-reported data from the CMS Healthcare Provider Cost Reporting Information System (HCRIS). All SNFs that are paid by Medicare are required to submit annual cost reports. Across these SNFs, we obtained cost reports from 2014 through 2022. These data include information on capacity, employment, and utilization at the report level. In particular, we measured beds, admissions, paid full-time-equivalent (FTE) employed, and utilization (utilized bed days divided by bed days available).
As cost reports are submitted by hospitals based on their fiscal year and reporting periods can vary, we start by constructing a calendar year by SNF panel from 2015 through 2021, where the variables are constructed as a weighted average of data from the cost reports. We are unable to construct data for 2022 due to incomplete 2023 reports.
In particular, we stack SNF cost reports at the facility level. Then, using each submission’s start and end dates, we construct calendar-year weights for each report before collapsing to the facility and year level. For example, if a selected nursing home reports data for July 1, 2015, through June 30, 2016, and again from July 1, 2016, through June 30, 2017, then we construct 2016 data for the selected nursing home as the average of the first and second reports. Mechanically, all of these data-cleaning steps are preceded by first converting numerical data to a daily rate based on the reporting period associated with each report. We fill in time gaps between nursing home submissions using data from the older report and aggregate to the annual level. Finally, these data are further collapsed to the county and year level to facilitate our market-level analysis. Outcome variables were winsorized at the 99th percentile.
Data on County Characteristics
To measure capacity at the market level, we aggregated our nursing home panel to the county-year level. County population estimates were obtained from the U.S. Census from 2015 to 2021. To construct a county-level rural/urban indicator, we downloaded Rural-Urban Commuting Area (RUCA) codes by Census tract from the Department of Agriculture. We used the most frequent primary RUCA code by county and followed guidance from the Health Resources and Services Administration (HRSA), defining rural as a non-metropolitan area; RUCA between 4 and 10.
COVID Exposure Data
To control for county-level exposure to COVID-19, we obtained data on hospitalizations and deaths from the Centers for Disease Control (CDC). These data include estimated COVID-19 exposure at the county and week level. We calculated the total annual number of COVID-19 hospitalizations and deaths per capita for each county and year. We controlled for this variation in our regression-adjusted analyses.
Analysis
Our main analysis compares per-capita nursing home capacity between counties in states that deregulated and those that did not. Per-capita measures address the concern of differential migration away from similarly sized areas and, we argue, better reflect the ability of nursing homes to address any unmet demand. For example, large capacity changes may reflect CON moratoria but could also reflect population growth. To test for differences by urbanicity, we separately analyzed the data by urban and rural areas. We calculated the annual mean county-level capacity between states that did and did not implement CON moratoria.
To control for baseline differences across counties, we estimated event study “difference-in-difference” 12 regressions. This approach measures the regression-adjusted change in capacity in states that implemented CON moratoria relative to changes during the pandemic among states that did not change nursing home CON policies. Because our outcomes are count-level capacity measures, we estimated this regression using a Poisson regression. Additionally, to test for “parallel trends” and measure how capacity changes in the years following CON changes, we plot annual coefficients and 95% confidence intervals for each year before and after the reference year of 2019. Our results are robust to using ordinary least squares.
The control group includes all counties in CON states that did not impose moratoria during the pandemic. All regressions include county fixed effects and urban-by-year fixed effects, and cluster standard errors at the county level. The estimated coefficients are interpreted as the log difference in the average outcome in areas with and without the CON moratoria.
We also estimated a triple-difference specification, which compares counties with above and below-median SNF utilization prior to the pandemic in 2019. Utilization was measured as the total bed days filled relative to the total available bed days. More constrained markets (eg, those with higher utilization) are more likely to benefit from entry deregulation and, therefore, may differentially expand in moratoria states compared to low-utilization areas in the same states and high-utilization areas in states without moratoria.
Results
Characteristics of Counties
Figure 1 maps state CON changes during the pandemic, including states that imposed moratoria, remained under CON, and did not have a CON during the pandemic. Over half of CON states imposed a moratorium, which allowed SNFs to add temporary beds more easily. Forty-six percent of moratoria counties are urban compared to 42% in non-moratoria areas. Between 2015 and 2019, average utilization was 78% and 74% in moratoria and non-moratoria counties, respectively. Average per capita beds were 8.0 and 8.9 in moratoria and non-moratoria counties, and per capita admissions were 13.8 and 14.6 in moratoria and non-moratoria counties, respectively. See Supplemental Appendix Table 1 for baseline county-level summary statistics between 2015 and 2019.
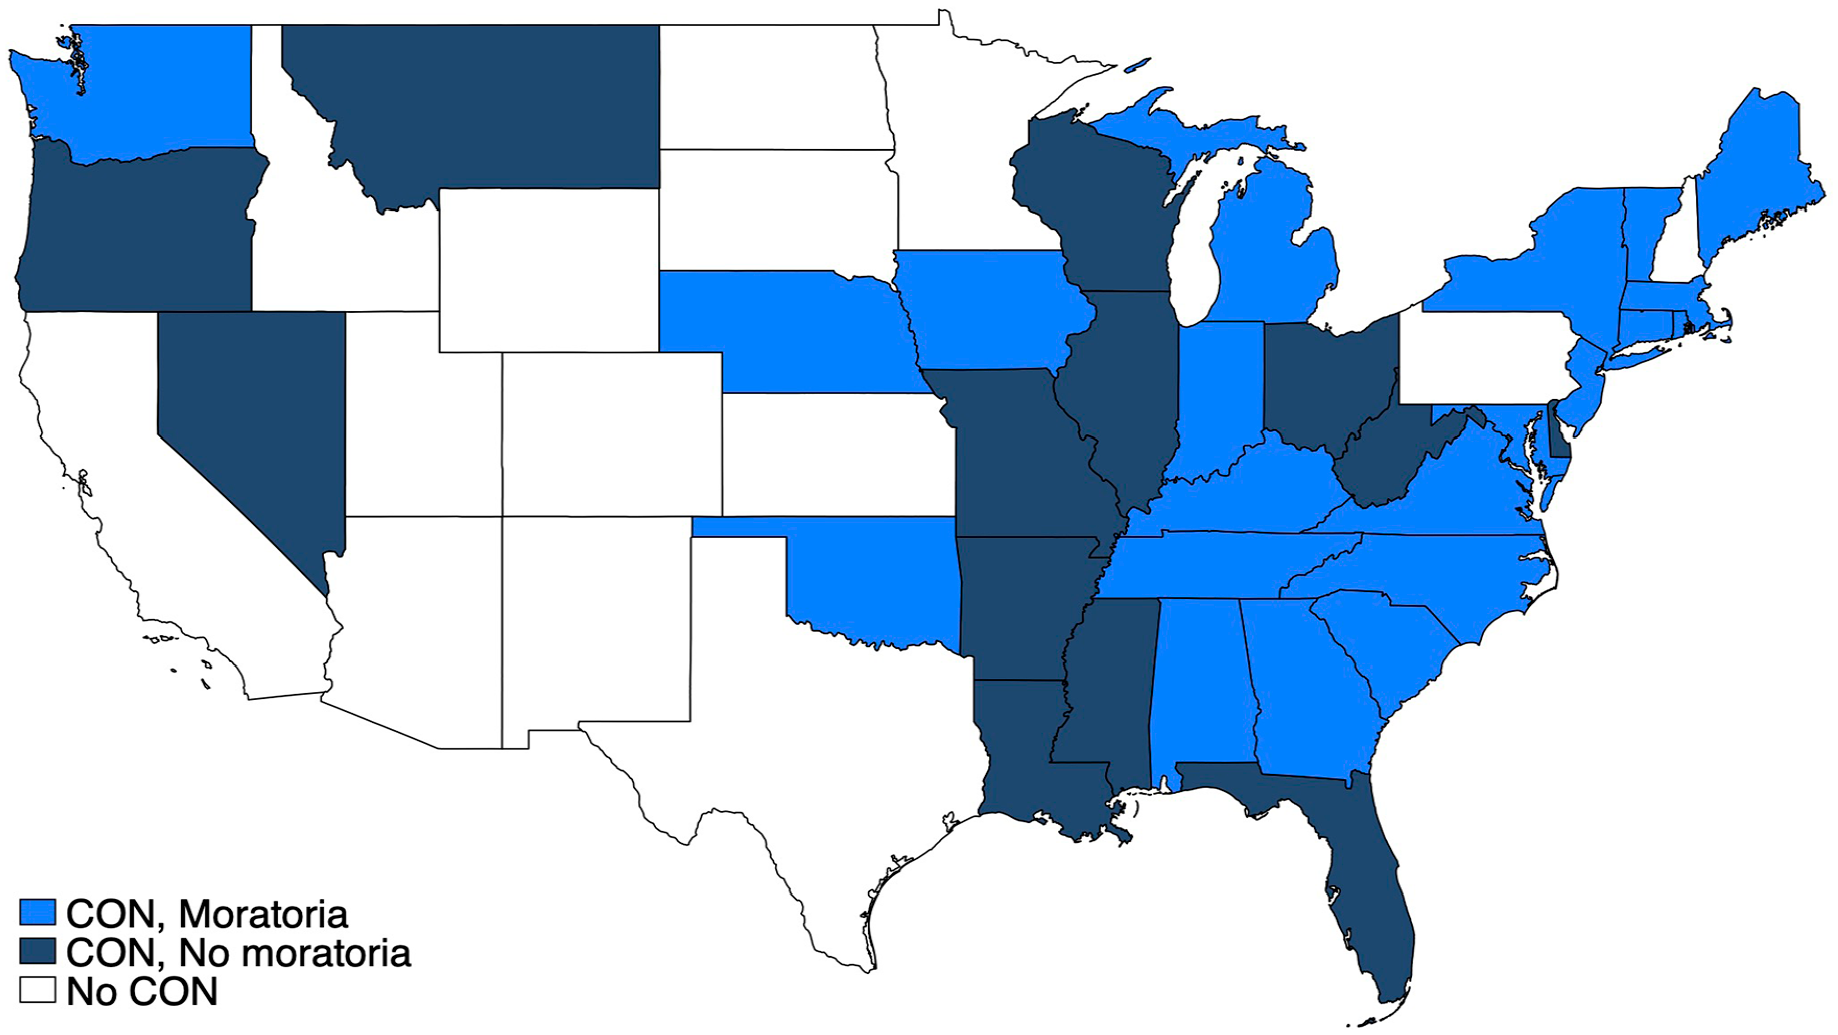
State-level skilled nursing facility certificate of need policies during COVID-19 pandemic.
Trends in SNF Bed Count
Figure 2 plots trends in SNF bed count per 1000 county residents between 2015 and 2021. Compared to non-moratoria counties, those with moratoria had lower SNF beds per capita, both before and after the pandemic. The overall difference is approximately 1 bed per 1000 residents and is relatively constant over time. Given that the average number of SNF beds per 1000 residents is 8.3, a 1-bed per 1000 resident difference represents a 12% gap in capacity. This difference is driven by a larger number of beds in urban areas of non-moratoria states. In urban counties, the difference appears to have narrowed slightly before the pandemic and then expanded slightly after 2020. Despite having fewer SNF beds overall, rural areas have more SNF capacity per resident, with limited differences between those with and without moratoria. There appear to be differential trends in rural areas without moratoria; average SNF beds per capita were higher in moratoria areas in 2015 but lower starting in 2017. However, the differences in trends are small.

Unadjusted trends in skilled nursing facility beds per 1000 residents, by certificate of need moratoria status and county urbanicity.
Regression-Adjusted Differences in SNF Bed Count
Figure 3 plots the “event study” regression-adjusted estimates of the association of moratoria on nursing home beds per capita. We document an average decline of 1.1% in areas that imposed moratoria compared to those that did not. This decline was immediately realized in 2020 and persistent through 2021. On average, counties under moratoria lost just 0.1 beds per 1000 residents. Examining associations based on county urbanicity shows similar declines in SNF beds per capita. The average decline in beds per capita in urban and rural areas is 1.7 and 0.9%, respectively. However, we cannot statistically reject that urban and rural areas experience the same effect.

Regression-adjusted association between skilled nursing facility beds per 1000 residents following pandemic-related Certificate of Need Moratoria, by County Urbanicity.
Supplemental Appendix Figure 1 plots the sensitivity test of regression-adjusted estimates, employing a triple regression difference specification. The average effect pooling across all counties is a 0.8% decline. However, after controlling for differential COVID shocks in high versus low utilization areas, the estimates are no longer statistically significant.
Regression-Adjusted Differences in SNF Count
In addition to results on per capita beds, Table 1 reports difference-in-difference estimates of the effect of CON moratoria on several outcome variables, including the number of SNFs per 1000 county residents. On average, SNFs per capita fell by 1.5%. Urban areas had a 2.4% decline compared to rural areas, with a 1.1% decline. We cannot reject that the decline in rural areas is statistically different from zero. For the triple-difference estimates, we found similar declines in per-capita SNFs, but they are no longer statistically significant.
Regression-Adjusted Association Between Skilled Nursing Facility Capacity and Staffing Following Pandemic-Related Certificate of Need Moratoria.

Note. Average effects on outcomes per 1000 residents (except for utilization) between 2020 and 2021 from Poisson regressions are displayed along with standard error in parentheses. All regressions include county and urbanicity by year fixed effects and per-capita COVID-19 hospitalizations and deaths, with standard errors clustered at the county level. Note that utilization is only populated for counties with positive nursing home beds. Triple difference specifications adjust for differences between pre-pandemic high and low utilization counties. Authors’ analysis of CMS Skilled Nursing Facility Cost Reports 2015 to 2021 merged with Certificate of Need status data during the COVID-19 pandemic.
Supplemental Appendix Table 2 reports analogous estimates, but the specifications allow for county-specific trends. We find similar results for all outcomes.
Regression-Adjusted Differences in Labor Supply
On average, we found that employment (paid FTEs per 1000) fell 2.4%. Urban areas had a 2.6% decline compared to rural areas, with a 2.2% decline. Our triple difference estimate suggests a decline of 1.9%, though it is no longer statistically significant. The negative association of the triple difference estimate is driven by rural counties. Here, rural areas, on average, experience a 3.7% decline in per capita labor, which is marginally significant.
Supplemental Appendix Table 3 provides a deeper look at contract versus non-contract employment of nursing professionals per capita. We use the broad definition of nursing in the cost reports: we count direct care hours from registered nurses, licensed practical nurses, certified nursing assistants, physical therapists and assistants/aides, occupational therapists and assistants/aides, speech therapists, respiratory therapists, and other medical staff. Our estimates suggest that reductions in salaried nursing drive the decline in overall nursing in areas that deregulate. The effect on contract nursing per capita is typically positive, suggesting some substitution, though coefficients are never statistically significant.
Regression-Adjusted Differences in Equipment Acquisitions
County-wide SNF equipment acquisitions per 1000 residents fell by 9% on average. Urban areas in moratoria states experienced a 20% decline in equipment purchases. In contrast, estimates suggest that rural areas experienced limited impacts on equipment purchases per capita. However, these estimates are not robust to the triple-differences specification.
Regression-Adjusted Differences in Admissions
We estimate that the average effect of CON moratoria on the number of SNF admissions per 1000 county residents was 0.4% and not statistically significantly different from zero. Urban areas experienced an average decline of 2% compared to rural areas, which experienced a 2.2% increase. Employing a triple-difference specification reverses the sign of the results.
Regression-Adjusted Differences in Utilization
Finally, we estimated the effect of CON deregulation on utilization, which we measured as the ratio of occupied bed days to total available bed days. The average association of CON moratoria is −0.6%, but it is not statistically significant. We also cannot reject the fact that the effects in urban and rural areas are statistically different from zero. With the triple-difference specification, we find larger average declines, though similarly insignificant.
Discussion
In non-pandemic periods, deregulating CON laws are generally associated with increased nursing home beds.2,14 However, it is not clear that these findings apply to the unique circumstances of the COVID-19 pandemic. The pandemic decreased oversight of incumbent facilities through moratoria but also may have diminished the attractiveness of new investments.
This paper examines CON moratoria for skilled nursing homes. CON laws may prevent new entry, but also importantly, delay exit of existing SNF providers. We find that CON deregulations during the pandemic were associated with small declines in county-level bed capacity, staffing, and exit. Utilization was unaffected, indicating reduced admissions in moratoria states compared to non-moratoria states.
There are 2 main potential explanations for these results. First, they could reflect a differential shock in CON moratoria areas compared to areas that continually enforce CON, such as the introduction of other COVID-19 policies. Alternatively, CON moratoria policies allowed facilities to make changes that reduced overall capacity. Several states do have laws that explicitly regulate exit, and some of these policies are regulated through the state’s CON.15-17 We tested these hypotheses using a triple-difference design that compared high versus low utilization areas prior to the pandemic. This design rules out uniform state-specific shocks but not those that affect high utilization areas in moratoria states differentially. Our results are substantially less robust; we are unable to reject that CON deregulation had no effect on capacity. These results provide evidence in favor of the first mechanism over the second mechanism.
Limitations and Future Research
This study is not without limitations. First, our study sample came from SNF cost reports. SNF cost reports come with several trade-offs. They are representative of the SNF market structure insofar as they accept Medicare patients. SNF cost reports may also suffer from incomplete reports, as some facilities fail to submit reports on time. For this latter reason, we are unable to incorporate 2022 and 2023 reports. We also aggregate this data up to the county level. Counties may be imperfect choices for market definitions, potentially being too narrow or broad. Future studies should consider alternative market definitions, such as ZIP-code or hospital referral region levels, or individual facilities.
While we verified that states imposed CON moratoria during the pandemic, we did not explore whether these rules led to changes in board meetings and enforcement decisions across all states and facility types. CON boards regulate more than SNF capacity, such as hospital beds. Future studies should consider requesting state-level data to examine approval stringency. In addition, although we control for COVID-19 mortality rates and measure additional variables such as admissions per capita to proxy for underlying demand, we cannot rule out country-specific factors that may have led to the limited association between CON moratoria and SNF capacity. Finally, we do not examine effects on quality, such as mortality rates, COVID-19 infection, or diagnostic errors. These outcomes would require additional data. Future research should examine the health effects of CON moratoria during the pandemic.
Conclusion
Overall, CON deregulation was relatively ineffective at increasing SNF capacity during the pandemic. If anything, there may have been a slight decline in SNF capacity. These results do not mean that states should not consider deregulating CON post-pandemic. During a pandemic, stimulating investment may be difficult due to decreased profitability. Moreover, slight capacity reductions may be efficient, especially if they don’t impact overall utilization. Future studies should extend the results of this paper to examine longer-run effects and potential impacts on patient health.
Supplemental Material
sj-docx-1-inq-10.1177_00469580241277444 – Supplemental material for Nursing Home Certificate of Need Moratoria During the COVID-19 Pandemic Had Little Impact on Access
Supplemental material, sj-docx-1-inq-10.1177_00469580241277444 for Nursing Home Certificate of Need Moratoria During the COVID-19 Pandemic Had Little Impact on Access by Anthony Yu and Christopher Whaley in INQUIRY: The Journal of Health Care Organization, Provision, and Financing
Footnotes
Acknowledgements
The authors thank participants of the RAND Health Care luncheon for helpful feedback.
Author Contributions
A.Y. and C.W. contributed to the conceptualization, research design, analysis of the results, and to the writing of the manuscript.
Data Availability
The data used in this study are publicly available through the Centers for Medicare and Medicaid Services, Centers for Disease Control, and U.S. Census Bureau.
Declaration of Conflicting Interests
The author(s) declared no potential conflicts of interest with respect to the research, authorship, and/or publication of this article.
Funding
The author(s) disclosed receipt of the following financial support for the research, authorship, and/or publication of this article: This research was funded by the National Institute on Aging R01AG073286.
Ethical Considerations
This study is not considered human subjects research.
Consent
Not applicable.
Supplemental Material
Supplemental material for this article is available online.
References
Supplementary Material
Please find the following supplemental material available below.
For Open Access articles published under a Creative Commons License, all supplemental material carries the same license as the article it is associated with.
For non-Open Access articles published, all supplemental material carries a non-exclusive license, and permission requests for re-use of supplemental material or any part of supplemental material shall be sent directly to the copyright owner as specified in the copyright notice associated with the article.