
Abstract
Introduction:
This study aims to examine the association between provider attributes, including network (patient panel size, degree-number of peer connections, and community size- number of a closely connected group of peers) and individual attributes (travel distance, specialties, and rural practice), and a predominant (most visited) provider.
Methods:
This study utilized South Carolina’s Medicaid claims data during 2014 to 2018, focusing on live births in hospitals. Samples were limited to pregnant women continuously enrolled in Medicaid throughout pregnancy. Predominant providers (total = 2153) were identified for 29 569 pregnancies. Network analyses involved 5520 providers, comprising 3667 antenatal care (ANC) providers and 1853 non-ANC providers. A Cartesian product (n = 45 929 845) combined five annual provider lists with all included pregnancies. Logistic regressions with repeated measures were applied to this retrospective case-control study.
Results:
The results demonstrated that a medium or large degree were associated with being a predominant provider if the community size was medium or large. A predominant provider was more likely to be located near, rather than far from, the served woman, and in rural areas rather than urban ones. They were also more likely to be specialists, midwives, and nurse practitioners than primary care physicians.
Conclusion:
The results suggest that both individual and network attributes were significantly associated with being a predominant provider. Policies aimed at addressing access issues for antenatal care should consider both the individual and network attributes of providers, as providers may not be able to alter their individual attributes but can always optimize their social network.
Individual attributes of potential providers are associated with provider-selection.
This study contributes to the field in two ways: examining the association between providers’ individual and network attributes and provider-selection; and targeting provider-selection for a predominant antenatal care provider.
In theory, the framework of provider-selection needs to include provider network attributes; in practice, providers cannot alter their individual attributes sometimes but can always optimize their social networks; and for policy, policymakers can bridge the supply-demand gap in antenatal care by understanding patients’ provider-selection.
Introduction
Many attributes of providers are associated with the patient-selection process. When considering potential providers, patients evaluate the provider’s demographics, location, specialties, availability, and perceived quality. 1 However, those provider attributes assume the independence of individual providers, overlooking the close connections and relationships within healthcare professionals. In the United States, new patients seeking a primary care physician (PCP) typically make their own choice by considering these individual provider attributes, while the selection of a specialist is heavily influenced by the PCP’s suggestion or referral.1,2 Referrals for care, particularly from such a usual source of care, significantly driver healthcare utilization by patients. 1 In the case of antenatal care, up to one-third of normal pregnancies involve a referral, and nearly half of high-risk pregnancies have at least 1 referral. 3
Providers identified through claims are the results of the provider-selection process. However, not all providers hold equal significance. A predominant provider,4,5 initially defined as the one providing the most healthcare services to a patient during a specific period, can have the most significant impact on antenatal care (ANC) utilization 6 and continuity of care (COC). 7 Such a provider, identified as a result of the ongoing provider-selection process during pregnancy, can be associated with initiating ANC, providing the majority of ANC services, and initiating referrals for specialists as well as the hospital deliveries. Consequently, these providers play a substantial role in care-seeking for pregnant women. Using South Carolina Medicaid claims, a recently updated algorithm specifically designed for ANC 8 has integrated ANC frequency and sequence information, increasing the identification rate of predominant providers from 81% to 92%.
However, the evolution and emergence of a predominant provider during the provider-selection process remain unclear. To determine the influence of physician referrals on pregnant women’s selection of their predominant providers, analyzing professionals’ social network is crucial. Previous research has employed network analysis to depict physicians’ referral networks with administrative data in North America, Europe, and Australia. 9 To the authors’ knowledge, no studies have explored the association between network attributes and patients’ selection of a predominant ANC provider. This study aims to fill this gap by utilizing Medicaid claims data from pregnant women in South Carolina (SC) to examine whether providers’ network attributes are associated with patients’ selection of a predominant ANC provider. Additionally, this study will investigate the association between that selection and other key individual provider attributes, including specialties, travel distance and rural practice, when network attributes are taken into account.
Materials and Methods
Data and Sample
A dataset encompassing 108 441 live births (with 2 155 076 claims) covered by South Carolina Medicaid between 2014 and 2018 was obtained from the SC Revenue and Fiscal Affairs Office (RFA), Budget and Control Board, which stores Medicaid data. Exemption for this study was granted by the Institutional Review Board at the authors’ institute due to the secondary analysis on de-identifiable administrative data.
The study unit was at the pregnancy level. The sample selection methodology followed a previous review on network studies employing administrative data. 9 Firstly, the full date of birth (DOB) was not disclosed to safeguard privacy. Nevertheless, in accordance with our data use agreement and employing previously published algorithms as guidance,10,11 the month of birth was estimated by utilizing the service dates and associated International Classification of Diseases (ICD) from the claims, and the appended to the year of birth provided by SC RFA. Secondly, to avert bias in the network analysis stemming from absent visit information (prior algorithms primarily relied on visit frequency4,5), only women during pregnancies with continuous Medicaid enrollment during the gestational period were included, leaving 37 359 live births (spanning over 36 838 pregnancies). Thirdly, the predominant provider was identified for each pregnancy to discern their predominant source of ANC. Given that ANC covers the entire gestational period, pregnant women have the opportunity, and frequently do, receive care from multiple providers. To identify the predominant source of antenatal care, the care was identified through ICD, Current Procedural Terminology (CPT) code, and Healthcare Common Procedure Coding System (HCPCS) codes. The visit frequency was counted for each pregnancy and each antenatal provider rendering such care. The ANC sequence was confirmed using the dates of ANC services. By employing this method, predominant providers were confirmed for 29 734 pregnancies. Further details are available here. 8 Finally, an annual list of all available antenatal care providers was generated for 2143 obstetrics-gynecologists (OBGYNs). In a previous study, some pregnant women in South Carolina drove up to 310 miles from the southern coastal area to a predominant provider located near the northern border of the state. 12 Therefore, this study presumed that every antenatal care provider in practice is potentially accessible to each pregnant woman contemplating antenatal care. Five annual lists were used to create a Cartesian product (n = 45 929 845) encompassing all included pregnancies during the year of delivery.
Study Design and Measures
This study adopted a retrospective case-control study design. The focal dependent variable was a binary variable denoting whether a provider served as the predominant provider for each pregnancy, as delineated in the preceding paragraph. The key independent variables comprised network characteristics, including annual patient volume, degree (the number of peer connections) and community size (the number of a closely connected group of providers). Although the final analysis exclusively incorporated OBGYNs, non-OBGYNs were included in the network analysis due to their inseparability from OBGYNs when constructing network attributes. Guided by a systematic review on network analysis methodology, 9 non-OBGYNs with fewer than 5 patients per year or specialties not directly engaging with patients, encompassing anesthesia, radiology, pathology, and other unknown specialties, were excluded. Laboratory claims were also excluded. Network analyses were performed on 5520 nodes, encompassing 3667 OBGYNs and 1853 non-OBGYNs, utilizing the igraph package in R version 3.6.0. If a provider possesses a degree or community size exceeding the corresponding mean, that provider is defined as an active provider due to involvement in many referrals. Otherwise, the provider is defined as inactive. Degree and community size were categorized as small (lower quartile), medium (within the interquartile range), and large (upper quartile) groups.
Additional independent variables comprised other provider individual characteristics such as specialties, travel time and rural practice. OBGYNs were categorized into 6 groups: OBGYN specialists (specialty code: 16—Gynecology, 26—Obstetrics, & 27—Obstetrics & Gynecology), midwives (06-Midwife), PCPs (12—Family Practice, 14—General Practice, 19—Internal Medicine, and 78—Multiple Specialty Group), organizations (50—Federally Qualified Health Clinics (FQHCs), 51—Department of Health and Environmental Control (DHEC), 97—Rural Health Clinics (RHCs)), nurse (86—Nurse Practitioners), and others. Given that only the 5-digit zip codes were available for the pregnant women’ residence and provider’s billing offices, the centroid of the zip code tabulation area (ZCTA) was employed to estimate the travel distances; this data was obtained from Google Maps for the Cartesian product. If the predominant provider’s ZCTA matched that of the pregnant woman, the travel distance was approximated by the ZCTA radius from 2010 Census, employing the formula
Additional covariates were integrated to account for patient and areal characteristics. Patient characteristics encompassed race/ethnicity, age, age-adjusted Charlson comorbidity index (ACCI), and pregnancy-related conditions. The ACCI was stratified into 3 levels based on severity: zero, moderate and severe. Pregnancy-related conditions comprised twelve dummy variables signifying the diagnosis of each condition. ZCTA-level information was derived from South Carolina RFA Licensure data, South Carolina SCAN project and Census American Community Survey. ZCTA characteristics included birth rates, the percentage of pregnant women paying out-of-pockets, median income, the percentage of pregnant women with obesity prior pregnancy, and the population of productive women aged 15 to 50. The analysis excluded 165 pregnancies due to missing values.
Statistical Analysis
Univariate and bivariate analysis were employed to summarize and compare patient and provider characteristics. Comparisons of patient characteristics were executed for the 29 569 pregnancies, segmented by active provider. Providers’ characteristics were also compared by predominant providers. Categorical variables were assessed using the Chi-square test, while continuous variables were analyzed using the student t-test. For multivariable analysis, logistic regression with repeated measures was employed, with the unadjusted regression serving as the reference. The repeated model was utilized to adjust for multiple pregnancies (6.1% in this study) for a given pregnant woman. The main model, incorporating all covariates, constituted an adjusted regression without interaction. If network attributes were found significant in the main model, interaction terms were incorporated in the third model. The odd ratios (ORs) were reported. All analyses were conducted using SAS software version 9.4 (SAS Institute Inc., Cary, NC) at a significance level of 95%.
Results
Table 1 summarizes the descriptive analysis for the study population. The average age of the pregnant women was 25 years old, with a significant proportion being of African American. Among all pregnancies, 6.1% represented a second pregnancy for the same woman within the study period. On average, the distance to the nearest provider was 6.9 miles, while the mean distance to the predominant provider of 24.0 miles. The majority of women scored zero on the ACCI. The prevalence of pregnancy or fetus related conditions ranged from 2.0% (liver/digestive system related conditions) to 40.4% (fetal related conditions).
Patients’ Characteristics by Active/Inactive Providers, South Carolina 2014 to 2018.

Note. Active provider was defined as whether a provider was with either a higher annual degree or community size than the corresponding mean.
Significant level: **P < .01. ***P < .001.
During pregnancy, women who visited an active predominant provider were compared with those visiting an inactive predominant provider. The results showed that pregnant women visiting an active provider were slightly older and more likely to be of Caucasian, Hispanic, multiple, or unknown races. No significant difference emerged in the probability of repeated pregnancy. Additionally, these pregnant women exhibited slightly shorter travel distance to both the nearest and the predominant providers; were more likely to have a moderate ACCI, and were diagnosed with varying pregnancy or fetus related conditions.
Regarding the specialty distribution of the 2143 antenatal care providers, 45.2% were specialists, 28.5% were primary care physicians, 8.7% represented public organizations, 7.3% were nurse practitioners, 6.4% were of other specialties, and 4.0% were midwives. Their annual patient volume averaged 84. They shared patients with 52 other providers annually. The annual provider count within a physician coordination community was 404. In comparison with non-predominant providers, predominant providers were more likely to be specialists (37.3% vs 54.9%, respectively, P < .001) and midwives (2.3% vs 6.2%, respectively, P < .001) and less likely to be PCPs (32.9% vs 22.9%, respectively, P < .001), nurse practitioners (8.4% vs 5.9%, respectively, P = .04) and other specialties (10.7% vs 1.1%, respectively, P < .001); they also served more patients (23 vs 168, respectively, P < .001), shared patients with more other providers (25 vs 90, respectively, P < .001) and coordinated within a larger community (360 vs 465, respectively, P < .001). There was no significant difference in practice rurality (15.7%) between primary and non-predominant providers (Table 2).
Provider Annual Network Attributes and Patients’ Choice of Their Predominant Provider.

Note. Degree and community size were categorized by quartiles. Small values were within the lower quartile, medium was within the interquartile range, and large was within the upper quartile.
Significant level: *P < .05. **P < .01. ***P < .001.
Table 3 presents the odd ratios from the logistic regression models, which were employed to estimate the factors associated with patients’ selection of a predominant provider. The first row illustrates the ORs from the unadjusted logistic regressions; the second row displays the ORS from the adjusted regressions without interaction; and the third row exhibits the ORs from the adjusted regressions with interactions. In the unadjusted regressions, patient size, degree and community size were positively associated with a predominant provider. These associations remained significant even after adjusting for other covariates. In the second model, however, the positive association between community size and patients’ selection transformed to negative for medium (OR: 0.66, P < .001) and large (OR: 0.60, P < .001) community size, whereas patient size (OR: 1.66, P < .001) and degree (OR—medium: 6.37, P < .001; OR—large: 9.52, P < .001) continued to display a positive association. The assessment of interactions between degree and community size revealed not significant results.
Odd Ratios (ORs) From Logistic Regression With Repeated Measures for the Selection of the Predominant Antenatal Care Provider.

Note. Total sample size: 45 929 845.
Degree-m = degree-medium; Degree-l = degree-large; Com size-m = community size-medium; Com size-l = community size-large.
Patient size was transformed with base 2 logarithm. Degree and community size were categorized by quartiles. Small values were within the lower quartile, medium was within the interquartile range, and large was within the upper quartile.
Significant level: ***P < .001.
Both the unadjusted and adjusted regression models indicated that a predominant provider was more likely to practice in a rural than an urban area (OR: 2.79, P < .001). Additionally, in the unadjusted regression, pregnant women preferred all specialties, except the other specialty group, over PCPs for their predominant provider. In the adjusted regression, pregnant women were more likely to choose specialists (OR: 3.15, P < .001), midwives (OR: 2.88, P < .001) and nurse practitioners (OR: 2.64, P < .001) than PCPs as the predominant provider; but they were less likely to choose other specialties (OR: 0.22, P < .001) than PCPs. Travel time was negatively associated with a predominant provider in both unadjusted and adjusted models. ORs from the adjusted models showed that a predominant provider was more likely to locate nearer to the served pregnant woman (OR—miles ≤ 26: 14.20, P < .001) and not to locate further (OR: 81 < miles ≤ 126: 0.07, P < .001; and OR: 126 < miles: 0.06, P < .001) than the reference group (Table 3).
Table 4 consolidates the integrated ORs for degree and community size. In comparison to providers with a small degree and a small community size, those possessing a medium degree were 4.20 times more likely to be predominant providers if their community size was medium, and 6.28 times more likely if their community size was large. Providers with a large degree were 3.85 times more likely to be predominant providers if their community size was medium and 5.71 times more likely if their community size was large.
Integrated Odd Ratios of Provider Degree and Community Size.
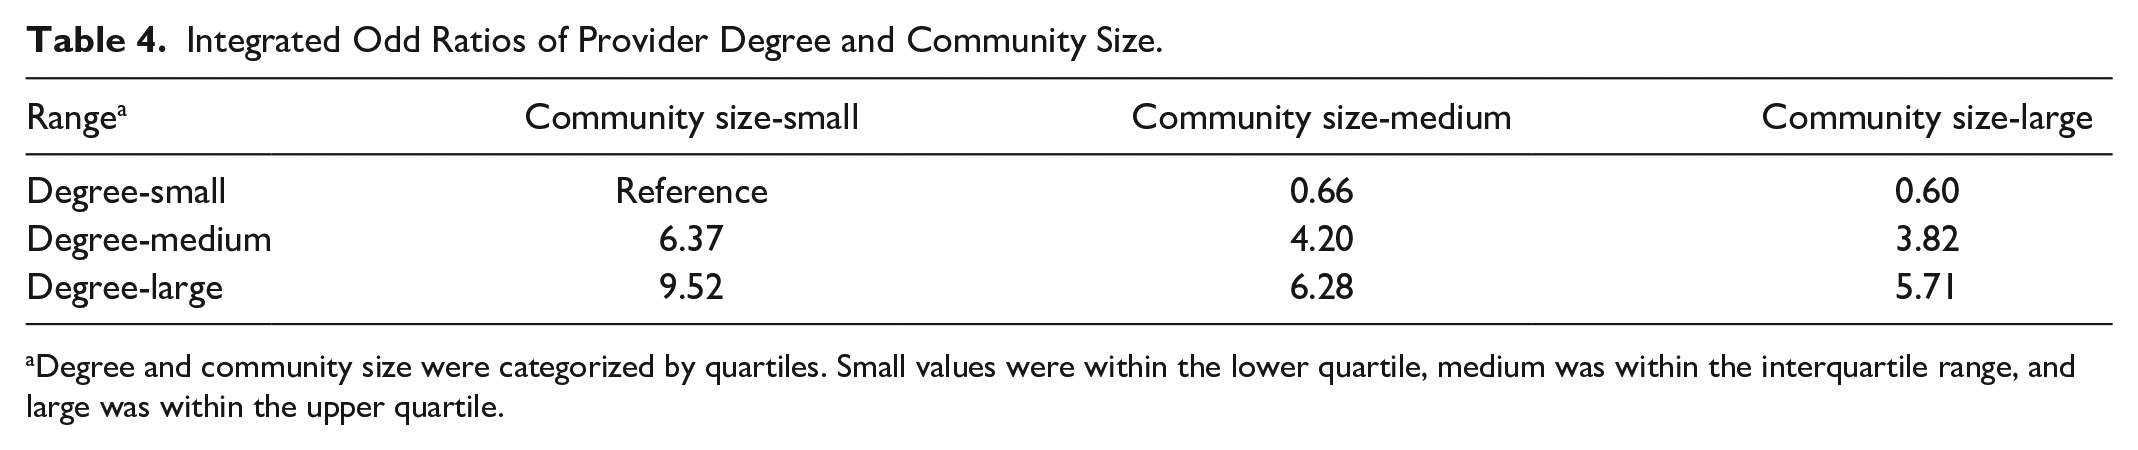
Degree and community size were categorized by quartiles. Small values were within the lower quartile, medium was within the interquartile range, and large was within the upper quartile.
Discussion
This study found that network attributes of antenatal care providers were associated with the process of selecting predominant providers. OBGYNs possessing more connections with peers were more likely to be selected as predominant providers, whereas those in a community with a greater number of peers were less likely to be predominant providers. Pregnant women tended to opt for providers located nearer to them and avoided those situated at a greater distance. They displaced a preference for rural over urban providers, and indicated a preference for specialists, midwives and nurse practitioners over PCPs.
This represents the first study that investigates the association of both individual and network characteristics of providers and the selection process on the predominant antenatal care providers. Conceptually, this study broadened the framework that encompasses provider characteristics within the provider selection process by incorporating the aspect of inter-provider relationship. Methodologically, this study has adopted an updated algorithm tailored specifically for antenatal care, which takes into account both visit frequency and sequence to identify a predominant provider. 8
The study presents several limitations, which encompass the utilization of claims data, reliance of ZCTA centroid for distance estimates, and the inability to manage factors such as referral relationship. To capture all visit information, this study exclusively encompassed pregnancies with full Medicaid coverage throughout the pregnancy. The results from this study cannot be applied to all Medicaid beneficiaries. Given that the available address information only comprised 5-digit zip codes, the travel distance was approximated using ZCTA centroids. The average radius of a South Carolina ZCTA is approximately 3 miles. This approach would exert a greater impact on the estimated distance for the nearest providers than it would on the predominant providers. Referral relationships were estimated based on shared patient within a designated time frame, which could potentially lead to an overestimation of the degree and community size among providers.
Formerly, the identification of a predominant provider was grounded in visit frequency.4,5 This study applied an updated algorithm 8 which integrates both ANC visit frequency and sequence. However, no previous study has explored the predictors for selecting a predominant provider. Results in this study provide evidence to elucidate why pregnant women are more inclined to visit these predominant providers compared to others. Beyond travel distance, network attributes could potentially stand as another pivotal factor in predicting the selecting of a predominant provider.
Transportation has been highlighted as a significant obstacle in accessing healthcare.13,14 The findings in this study not only reaffirm this but also furnish evidence in the context of the provider selection process. Notably, the travel distance to providers’ office exhibited the most substantial influence on the designation of a predominant antenatal care provider. Pregnant women displayed a higher likelihood, compared to the providers located between 26 and 81 miles, of choosing providers in closer proximity and showed a tendency to avoid those located at a greater distance—indicating that a closer ANC provider is more likely to receive frequent visits compared to those farther away. Potential explanations encompass factors such as switching costs, meeting local demand, and the physician referral network. 15
This study is pioneering in exploration of the effects of network attributes of antenatal care providers on the selection process of predominant providers. Distinct network attributes demonstrated varying effects on this process. Degree and community size exhibited opposing associations with that process, with degree displaying a more pronounced effect size. This suggests that providers who engage in more connections with other providers tend to amass more patients and visits. Providers with larger patient panel sizes were associated with expanded patients’ choice, but the association may not be strictly causal, as each patient selecting a provider as the predominant provider would inevitably contribute to that provider’s patient panel size.
Previous studies have indicated that multiple specialties other than OBGYNs may offer antenatal care. 16 The results of this study found that pregnant women tend to favor specialists, midwives and nurse practitioners over primary care physicians for their antenatal care, with the effect sizes remaining similar across all 3 specialties.
These findings suggest that enhancing a provider’s referral network and the ability to make referrals could improve care for this population. Although augmenting the number of nearby ANC providers would improve care, this is hampered by the limited supply of such providers. 17 While all pregnant women exhibited a preference for rural practitioners, prioritizing policies that support rural areas would benefit both rural and, at least, neighboring urban residents. Encouraging the increased integration of midwives and nurse practitioners in areas grappling with workforce shortages, particularly in situations where the availability of primary care physicians is restricted, would also be prudent. To enhance the capacity of midwives and nurse practitioners to offer care to these populations, initiatives to broaden their scopes of practice, qualifications for supervision, and address reimbursement issues should be explored.
In the future, studies might shift their focus from solely examining individual provider attributes to encompassing both individual and network attributes. Furthermore, understanding the role of a predominant provider could offer specific insights for workforce planning and support. Further research is warranted to delve deeper into the role of a predominant provider.
Conclusion
This study marks the first exploration of the association between provider characteristics and the selection process for predominant antenatal care providers. Both individual and network attributes of providers displayed significant association with this selection process. These findings furnish evidence supporting policies aimed at bridging the supply-demand gap in antenatal care. To achieve this, policymakers need to consider not only the individual attributes of providers but also their network attributes, given that providers may not always have the ability to alter their individual attributes but can optimize their social networks.
Footnotes
Acknowledgements
We would like to acknowledge support from the South Carolina Revenue and Fiscal Affairs Office by approving and providing us the free access to South Carolina Medicaid Claims data. That support made this study possible. The findings reported are solely those of the researchers and have not been verified by SCDHHS.
Authors’ Contribution
Songyuan Deng—Conceptualization, Methodology, Software, Writing- Original draft preparation; Kevin Bennett—Supervision, Writing- Reviewing and Editing.
Availability of Data and Materials
The data that support the findings of this study are available from South Carolina Revenue and Fiscal Affairs Office, but restrictions apply to the availability of these data, which were used under license for the current study, and so are not publicly available. Software programs are available upon request to the corresponding author through email:
Declaration of Conflicting Interests
The author(s) declared no potential conflicts of interest with respect to the research, authorship, and/or publication of this article.
Funding
The author(s) received no financial support for the research, authorship, and/or publication of this article.
Ethics Approval
Exemption for this study was obtained from the Institutional Review Board at the University of South Carolina due to the secondary analysis using de-identifiable administrative data.
Consent to Participate and for Publication
Not applicable.