
Abstract
Dramatic geographic variations in healthcare expenditures were documented by developed countries, but little is known about such variations under China’s context, and what causes such variations. This study aims to examine variations of healthcare expenditures among small areas and to determine the associations between demand-, supply-factors, and per capita inpatient expenditures. This cross-sectional study utilized hospital discharge data aggregated within delineated hospital service areas (HSAs) using the small-area analysis approach. Linear multivariate regression modeling with robust standard errors was used to estimate the sources of variation of per capita inpatient expenditures across HSAs covering the years 2017 to 2019; the Shapley value decomposition method was used to measure the respective contributions of demand-, supply-side to such variations. Among 149 HSAs, demand factors explained most of the (87.4%) overall geographic variation among HSAs. With each 1% increase in GDP per capita and urbanization rate was associated with 0.099% and 0.9% increase in inpatient expenditure per capita, respectively, while each 1% increase in the share of females and the unemployment rate was associated with a 0.7% and 0.4% reduction in the per capita inpatient expenditures, respectively. In supply-side, for every 1 increase in hospital beds per 1000 population, the per capita inpatient expenditures rose by 2.9%, while with every 1% increase in the share of private hospitals, the per capita inpatient expenditures would decrease by 0.4%. With Herfindahl-Hirschman Index decrease 10%, the per capita inpatient expenditures would increase 1.06%. This study suggests demand-side factors are associated with large geographic variation in per capita inpatient expenditures among HSAs, while supply-side factors played an important role. The evaluation of geographic variations in per capita inpatient expenditures as well as its associated factors have great potential to provide an indirect approach to identify possibly existing underutilized or overutilized healthcare procedures.
Keywords
Small areas have proven to be dependable units of analysis for investigating geographical variaions within healthcare systems. Moreover, the geographic variations in health utilization, primarily driven by supply-side factors, often reveal underlying inefficiencies.
This pioneering study applies the small-area approach to examine geographic health expenditure variations in China, the world’s largest developing country. It utilizes the shapley value decomposition method to analyze demand and supply factors driving geographical variations in health expenditures.
Our study identified the predominance of the demand factors in contributing to geographic variations among HSAs, with the emphasis on the importance of the number of beds per capita as a vital supply-side factor. This insight might be valuable in efforts to identify and address inappropriate healthcare utilization, and potentially help better understand geographical variations in health expenditures.
Background
In the past decades, there has been a dramatic surge of interest in the literature regarding the variation in healthcare expenditures across regions. While most studies investigated this issue by exploring its underlying causes, the identification of early evidence was mainly contributed by studies from the United States1 -5 which spent substantial efforts on analyzing Medicare beneficiary spending.6 -11 Recently, similar studies to investigate dramatic variations in healthcare across regions have also been conducted under the contexts of other nations, including Canada, 12 Germany, 13 Sweden, 14 Italy, 15 Spain, 16 Switzerland, 17 and China. 18 When it comes to analyzing potential determinants of variations in healthcare expenditures, such variations are typically divided by researchers into “unwarranted” and “warranted” components based on the widely accepted criteria that variations should be recognized as “warranted” only if such variations can be explained by particular demand-side factors that reflect differences in patient needs or preferences. 19 Otherwise, the variations would be considered as unwarranted if they are found to be mainly driven by supply factors, such as supplier-induced demand, 20 defensive medicine, 21 and medical arms race. 22 Unwarranted variations observed healthcare expenditures usually indicate the existence of a problematic situation where misallocated healthcare resources have compromised the overall efficiency of the healthcare system, which might refer to the overutilization or underutilization of healthcare resources, or the existence of both issues.
Striving to examine geographic variation embedded in healthcare expenditures, the selection of an analysis unit is rather essential to ensure that an accurate picture would be eventually produced to reflect the actual structure of the healthcare market. By doing so, the analysis outcomes would be reliable enough to inform the implementation of corresponding policies and planning strategies. To address this issue, hospital service areas (HSAs) have widely embraced a small-area analysis method to explore geographic variations in-depth23 -26 since it was pioneered by the Dartmouth Atlas of Health Care Project. 27 Specifically, a HSA is defined as an area within which patients receive most of their hospital care, thereby forming a region-specific pattern of inpatient care utilization. 25 Such naturally formulated boundaries become exceptionally valuable for regional variation analysis under the context of China’s healthcare system where nationwide patients are allowed to choose their preferred healthcare institutes to meet their own needs. As the result, it is not difficult to imagine that residents’ healthcare seeking behaviors would occur frequently both across administrative and political boundaries. Through the adoption of the HSAs-facilitated approach, analysis can be conducted based on distinctly established market areas, which has great potential to mitigate mismatched healthcare expenditures induced by border-crossing residents who seek medical services outside their own residential areas, thus improving the reliability of analysis outcomes via better matched supply and demand within each analysis unit.
The small-area analysis approach has been widely used in developed countries to identify unwarranted variations as well as to determine sources of such variation in healthcare expenditures. However, the adoption of such an efficient analysis approach remain very limited in most low-and-middle-income countries (LMICs) due to the lack of reliable inpatient data or the absence of automation of small-area delineation methods. 28 Over the past decades, the improved quality of inpatient data in China, 29 along with accessible delineation tools 30 have enabled researchers to address geographic variation issues under China’s context by using a small-area analysis approach. Using hospital discharge data from 2017 to 2019, we explored the underlying determinants that result in such variation, as well as the extent to which demand and supply factors accounted for such variations.
The Healthcare System in China
The Chinese healthcare system is structured around a three-tier healthcare delivery system, comprising tertiary, secondary, and primary healthcare providers. 31 The difficulty, quality, and cost of health services increase with the higher tier of care. The majority of healthcare services are provided by public health sectors, with over 80% of inpatient care being delivered by public hospitals. 32 In recent times, the encouragement of social capital investment in the healthcare sector has led to an increase in the proportion of inpatient services provided by privately-owned healthcare providers, reaching 18.31% in 2018. 33
To achieve universal health coverage, the Chinese government initiated a healthcare reform aimed at expanding social health insurance coverage for all citizens. 34 This reform seeks to provide equitable access to basic healthcare while offering reasonable financial risk protection. Despite the increase in public funding for health through the government and social health insurance channels, out-of-pocket payments still accounted for 28% of the total health expenditure in 2017. 32 To address this issue, China is exploring alternative payment methods as substitutes for the traditional fee-for-service model. These alternatives include diagnosis-related group, global budgets, case-based payments, and capitation. The aim is to reduce overall healthcare expenditures and minimize out-of-pocket costs for individuals. 35
Methods
Data and Study Area
The datasets employed for our analysis were obtained through cluster sampling, encompassing the total expenditures of inpatient episodes within Sichuan Province, China, during the third tertial (from September to December) from 2017 to 2019. This specific hospital discharge data, derived from all patients within Sichuan Province for a single quarter, is unlikely to introduce substantial variations to the relationship between demand- and supply-side factors and healthcare expenditures due to seasonal fluctuations. The datasets were retrieved from Sichuan Health Statistics Support System Database in combination with hospital-level data obtained from Hospital Administrative Reports published in the corresponding years. The hospital discharge data contains both patients’ residential locations and the hospitals where the admissions took place, which served as reliable evidence to produce a map that demonstrates specific HSAs where patients received their inpatient services. To avoid uncontrollable factors that might affect the utilization pattern of hospital services within specific regions, discharge records of non-residents of Sichuan were excluded. Townships/subdistricts are the basic units for hospital service areas delineation. Approximately 18% of patient records with incomplete addresses were excluded to ensure the accuracy of hospital service areas delineation. After excluding records with missing values from the data sources, 8 218 886 discharge records were finally retained for analysis.
This study, conducted in Sichuan Province (see Figure A.1 in the Appendix 1), mirrors the situation in China to a certain extent. China is a vast country characterized by considerable regional differences in terms of geographic features, demographic structures, and economic growth. Eastern regions, with their physical features covered by plateaus and foothills, are lower, densely populated, and much better developed than the mountainous, sparsely populated western China. Sichuan Province shares similarities with the whole nation. More population is distributed and higher levels of economic development in east Sichuan are covered mostly by plains compared with large areas of mountainous land in the western region counterparts. 36 The substantial regional disparities in Sichuan lead to disparities in the allocation of hospital care resources37,38 and geographical access to healthcare. 39 In the eastern regions of Sichuan, hospitals are more densely distributed at higher levels, resulting in higher spatial accessibility. This, in turn, influences the healthcare seeking behaviors of patients, thereby making it possible to observe geographic variation in healthcare expenditures. Furthermore, Sichuan Province is China’s fifth largest province (486 052 km 2 ) in land size, and has a resident population of 83.75 million in 2019. 40 It is also practically valuable to examine geographic variation for a healthcare system covering a large population.
Variables
Per capita inpatient expenditures
Our primary expenditure outcome was per capita inpatient expenditures in each HSA. Per capita total inpatient expenditures were calculated by dividing the total inpatient costs in a HSA by the size of population residing in that particular HSA. Age- and gender- adjusted per capita inpatient expenditures were also calculated, these expenditures across HSAs were presented in Chinese Yuan.
Demand-side variables
A list of potential predictors of regional per capita inpatient expenditures from demand-side were selected to reflect residents’ health conditions, as well as the socioeconomic status of the population. The potential demand factors include the share of population aged 65 and over, share of females, share of emergency admissions, share of patients informed of critical conditions, and average Charlson Comorbidity Index, 41 which is a method of categorizing comorbidities of patients based on the adjusted risk of mortality or resource use. All these variables were calculated by using hospital discharge data aggregated at the HSA level. Birth rate, death rate, unemployment rate, per capita Gross Domestic Product (GDP), and urbanization rate were also included and calculated at the HSA level (see Appendix 2).
Supply-side variables
According to the previous literature,3,10,11,42,43 as for supply factors, we included the number of hospital beds per 1000 population as the proxy of per capita supply of hospital resources. We also included health market share variables to reflect the “power” of the supply-side in each region. They are the share of private hospitals, the share of tertiary hospitals, and Herfindahl-Hirschman Index (HHI) which measures hospital market concentration or competition. 44 As each hospital’s market is defined as the HSA where it is located, the HHI for each HSA was calculated by using the sum of hospital beds in the HSA as the size of the market and the hospital’s count of beds as its measure of market share. We incorporated payment by social health insurance programs into our model to account for their influence on healthcare services’ availability, accessibility, and affordability. To quantify this impact, we computed the share of payment covered by insurance in each hospital service area. This was achieved by dividing the number of inpatient admissions covered by social health insurance payment by the total number of inpatient admissions. This calculation provides insight into the extent to which insurance contributes to covering the costs of inpatient care within a specific hospital service area.
Delineation of Hospital Service Areas
HSAs were delineated through three steps in our study based on the small-area approach initially proposed by Dartmouth Atlas Project. 27 Subdistricts in urban areas and towns were selected as the basic single unit for definition. First, all hospitals identified from the discharge file from 2017 to 2019 were assigned to a particular subdistrict or town where they are located to form candidate HSAs (N = 3440, see Appendix 1, Figure A.2). Second, all inpatient records were aggregated from each subdistrict or town area of patients to each hospital. When a subdistrict or town has multiple hospitals, the records were added together. Using a plurality rule (greatest proportion of inpatient), each subdistrict or town was assigned to the formed candidate HSA with the highest service volume, while ensuring the HSA is also spatially adjacent to that subdistrict or town. Third, repeat step 2 until all subdistricts or towns were assigned to the adjacent HSA and met the goal of maximizing the service volumes within HSAs and minimizing them between HSAs. In order to improve the efficiency of connecting demand- and supply- side as suggested by the previous literature,25,45 each HSA was set up to have a minimum localization index of 0.5, which refers to the proportion of patients that receive inpatient services within a single HSA out of total patients from the HSA, meaning that at least 50% of patients living in a particular HSA would receive services from hospitals that are located within the same HSA. We implemented the above steps using the GIS-automated delineation tool of hospital service areas. 24
Statistical Analysis
We examined the geographic variation of per capita inpatient expenditures across the delineated HSAs over the 2017 to 2019 period measured by the coefficient of variation (CV). Mean, max, min, and 25th, 50th, 75th quartiles were also calculated. To account for differences in demographic characteristics among HSAs and make them more comparable, inpatient expenditures per capita were age-adjusted and gender-adjusted by using direct standardization approach according to the gender- and age-distribution (from ≤14 years of age, 15-64, and ≥65) based on Sichuan Province. The unadjusted per capita inpatient expenditures and the result of adjustment for age and gender were both presented.
Next, we conducted an examination of the factors influencing per capita inpatient expenditures by employing a multivariate linear regression model. Robust standard errors were utilized in this analysis, with the dependent variable being the per capita inpatient expenditure at the hospital service area (HSA) level. To address the positive skewed distribution of the dependent variable, we employed the natural logarithm of this variable to fulfill the linearity. Within this framework, we incorporated a collection of explanatory variables encompassing both demand- and supply-related factors into the model. The equation is as follows:

where i, t denoted hospital service area and year of admission respectively,
Finally, the shapley value decomposition method was used to quantify the contribution of various factors at different levels to the variation of per capita inpatient expenditures within HSAs. 46 The shapley value is the average marginal contribution of a feature considering all possible combinations. 47 Specifically, the marginal effect of the X1 from the demand side can be expressed as:

where i, t denoted hospital service area and year of admission, respectively. R2 is the overall R-square of the linear regression. E denoted various explanatory variables from the demand side. Y denoted per capita inpatient expenditures within HSAs.
Based on the above equation, the marginal effects of different explanatory variables from supply side on R2 can also be calculated, thereby measuring the contribution of each explanatory variable to the overall R-square of the linear regression.
We performed the analysis in R version 4.0.2 with the significance level setting up at 5%.
Results
Hospital Service Areas
According to the utilization patterns of inpatient services documented over the study period, the aggregation of 3440 subdistricts and towns distributed across the study area were divided into 149 independent hospital service areas (Figure 1). In each single area, most residents chose to get locally hospitalized instead of seeking inpatient services outside that region. The propensity of patients to seek inpatient services from local hospitals is measured by the localization index, which varied from 50.01% to over 90.98%, with a median of 69.06%. More than 75% of the study population were found to reside within areas where the localization index exceeded 60%. The mean population size ranged from 55.72 (10 000 population) in 2017 to 56.20 (10 000 population) in 2019. Detailed attributes of hospital service areas are listed in Table A.1 (see Appendix 3).

Hospital service areas in Sichuan Province (a); Cumulative percentage of population of Sichuan Province according to the hospital service area localization index (2019) (b).
Geographic Variation of Inpatient Expenditure Per Capita
Our unit of analysis was based on the delineated map which contained 149 HSAs. HSA-level age- and gender-adjusted per capita inpatient expenditures ranged from 168 yuan in quartile 3 to 224 yuan in quartile 3 in 2019, a difference of 33.33%. The CV for per capita inpatient expenditures decreased gradually in 2018 and showed a slightly upward trend during 2019, from 0.287 in 2017 to 0.275 in 2019. The interquartile ranges were 54, 59, and 75 Chinese yuan respectively for each year. The age- and gender-adjusted per capita inpatient expenditures in 2019 demonstrated more than 8-fold variations across hospital service areas (Table 1, Figure 2). After adjustment, the HSA with high per capita inpatient expenditures were mainly concentrated in the central regions of Sichuan Province in 2019. The range of HSAs with high per capita inpatient expenditures expanded compared to 2017 and 2018 (Figure 3). Many demographics varied across HSAs. For example, the CV for unemployment rate and the share of tertiary hospitals was 1.08 and 1.41, respectively (Table 2).
Per Capita Inpatient Expenditures Across HSAs.

HSA = hospital service area; CV = Coefficient of Variation.
Per capita inpatient expenditures are presented in Chinese Yuan at the HSA level.

Regional variation of per capita inpatient expenditures among Sichuan hospital service areas in 2017 to 2019.

Distribution of per capita inpatient expenditures in Sichuan hospital service areas from 2017 to 2019. (a) Per capita inpatient expenditures in 2017 adjusted by age and gender; (b) Per capita inpatient expenditures in 2018 adjusted by age and gender; (c)Per capita inpatient expenditures in 2019 adjusted by age and gender.
Demographic Characteristics Within Sichuan Hospital Service Areas.

Sources of Differences in Inpatient Expenditures
Table 3 shows the factors correlated with per capita inpatient expenditures among HSAs. Before using the linear regression model, we conducted the multicollinearity test to ensure there is no strong linear relationship among predictor variables (see Appendix 1, Figure A.3). From the demand side, the GDP per capita and urbanization rate were found to be positively associated with per capita inpatient expenditures within HSAs, while the share of females and unemployment rate had a negative association. Every 1% increase in GDP per capita and urbanization rate was associated with 0.099% and 0.9% increase in inpatient expenditures per capita, respectively. In addition, for every 1% increase in the share of females and unemployment rate within HSAs, the inpatient expenditure per capita decreased 0.7% and 0.4%, respectively. On the supply side, with 1 increase in hospital beds per 1000 population, the per capita inpatient expenditures would rise by 2.9%, while with every 1% increase in the share of private hospitals, the per capita inpatient expenditures would decrease by 0.4%. Hospital market competition increase the per capita inpatient expenditures, with Herfindahl-Hirschman Index decrease 10%, the per capita inpatient expenditures would increase 1.06%.
Correlated Factors With Per Capita Inpatient Expenditures.

Variables were log-transformed. The results show the regression with robust standard errors.
Contribution of Demand, Supply factors to Inpatient Expenditures
The explained variation in the per capita inpatient expenditures is 87.4% (Table 3). Table 4 shows the contribution of each explanatory variable to the overall R2. Most of the overall geographic variation among HSAs could be explained by demand factors (86.09%), followed by supply factors (12.66%). Among all the supply factors, the hospital beds per 1000 population is the greatest contributing factor (10.23%).
Contribution of Each Explanatory Variable to the Overall R-Square.

Robust Check
According to the previous literature, 18 hospital discharge records with incomplete addresses can be randomly assigned to townships/subdistricts based on the available information to delineate HSAs. This portion of the records provides information about the county/district where the patients are located. In the robust check, the allocation of estimated patient locations to a specific township/subdistrict was randomly assigned, taking into consideration the population proportions of the 3440 townships/subdistricts among the 183 counties/districts in Sichuan Province. These proportions were determined based on the population data from the 2019 Administrative Division Handbook of Sichuan Province released by the Department of Civil Affairs in Sichuan Province. The random allocation was performed using weights derived from these population proportions. After including records with incomplete cases from the data sources, 10 023 026 discharge records were retained for robust check analysis.
We employed the adding cases with randomly assigned townships/subdistricts to test the robustness of our findings. The delineated HSA is presented in Figure A.4 (see Appendix 1).
The Tables 5 and 6 report the estimations. The results are similar to complete cases analysis in terms of signs and statistical significance of the coefficients estimates, showing the robustness of our results.
Correlated Factors With Per Capita Inpatient Expenditures.

Variables were log-transformed. The results show the regression with robust standard errors.
Contribution of Each Explanatory Variable to the Overall R-Square.

Discussion
To our knowledge, this is the first study that attempts to examine geographic variation in per capita inpatient expenditures under China’s context via the adoption of a small-area approach. Using HSA as the basic unit for analysis, a map was produced to delineate 149 hospital service areas based on hospital discharge data recorded throughout a 3-year span. Age- and gender-adjusted per capita inpatient expenditures in 2019 demonstrated more than 8-fold variations across HSAs. A set of demand-, and supply-factors were found to be associated with inpatient expenditures, which could explain 87.4% of the total variance in inpatient expenditures per capita. The demand-determined variation was found to be the highest, contributing to 86.09% of the overall R2. The hospital beds per 1000 population turned out to be the covariate that explained most of the geographic variation in per capita inpatient expenditures in the supply side.
Compared to prior research in the United States, our study showed a substantial higher variance in per capita spending. After adjustment for age and gender, per capita inpatient expenditures displayed a 8.15-fold variation in the year 2019, in contrast to Zhang’s findings, 10 which indicated a 4-fold variation in U.S. Medicare per beneficiary. In contrast, our study region exhibited markedly higher healthcare expenditure variation than Canada and the United Kingdom. Specifically, the CV for standardized per capita inpatient expenditures ranged from 0.27 to 0.28, surpassing Canada’s range of 0.06 to 0.09 and the United Kingdom’s fluctuating range of 0.09 to 0.11. 48 This substantial variation underscores potential inefficiencies within the healthcare system.
Our study highlights demand-side factors contributing to variation in per capita inpatient expenditures across hospital service areas. Urbanization rate and per capita GDP are positively correlated with per capita inpatient expenditures, aligning with previous research. Boz et al. 49 studied 35 OECD countries, observing a 46.55-dollar increase in per capita health spending for every 1% rise in urban population. In China, regional analyses 50 suggested non-linear urbanization effects on health expenditures, with higher aging populations amplifying this association. Moreover, per capita GDP growth corresponds with heightened health spending, as observed in OECD health data 51 for member nations including Canada, France, and Germany. Conversely, the negative correlation between the proportion of unemployed populations among hospitalized patients and per capita inpatient expenditures contrasts prior findings. OECD’s panel analysis 52 suggested no significant effect of unemployment on health expenditures. A U.S. study 53 showed that the average healthcare expenditures for unemployed people is higher than that of employed people, while our study suggests the contrary. The negative association may be linked to China’s current healthcare financial protection policy. Despite potentially poorer health among the unemployed, high out-of-pocket costs in a system with limited coverage could lead to reduced healthcare utilization, thereby lowering per capita inpatient expenditures. 54
Another important finding indicates a positive correlation between hospital beds per capita (1000 population) and inpatient expenditure per capita in the supply side. This aligns with Roemer’s law, 55 which suggests that built hospital beds will be used whether or not it is warranted, underscoring how the healthcare system capacity can influence resource utilization. 56 As such, our findings were consistent with the U.S. evidence, where greater hospital bed capacity per hospital referral region correlated with higher expenditures per capita. 27 However, hospital capacity might not be the leading factor that predominantly determines admission-related decision-making process, especially for certain chronic conditions such as diabetes, gastroenteritis, and chronic lung diseases. In these cases, optional admissions or medical experts’ input across hospitals can significantly influence decisions. Therefore, careful consideration is required during resource allocation-related policymaking, particularly for such conditions where unwarranted hospitalizations may arise. 57 In addition, there is a negative correlation between the share of private hospitals and per capita inpatient expenditure within HSAs. This can be attributed to the pricing policies implemented by the Chinese government. 58 Public hospitals follow government-regulated pricing for basic medical services, but they adopt a market-regulated pricing approach for specialized medical services. On the other hand, medical services provided by private hospitals adhere to a market-regulated pricing approach, allowing them to potentially lower healthcare costs through flexible pricing strategies. Finally, on the supply side, it was observed that hospital market competition is associated with a rise in per capita inpatient expenditure. This may suggest a potential trend where hospitals are inclined to promote and expand their medical facilities as a strategy to attract patients, 59 consequently leading to an increase in healthcare expenditures.
Another contribution to highlight in this study is that the respective contribution of demand-, and supply-side factors to the total variance of per capita inpatient expenditures within HSAs are divided into individual components for more in-depth analysis. Our findings show that while demand factors predominantly explain geographic variations within HSAs, supply-side factors also significantly contribute to regional variation in health expenditures. Our results are consistent with prior studies which reported similar findings. Göpffarth et al. 13 demonstrated that demographic characteristics and health status accounted for 55% of health expenditure variance in Germany. Similarly, a study on the U.S. Medicare population found that 40 to 50% of regional variation in per capita Medicare spending could be attributed to demand-side factors. 60 Studies using different sets of supply factors conveyed its importance in explaining variations in health expenditures. Culter and Sheiner, 3 using proxy variables such as the share of specialists among physicians and the share of hospital beds in for-profit institutions, found that supply factors elucidated 40% of per capita Medicare spending variance. However, it is worth noting that some factors may affect both demand and supply. For instance, HSA-level GDP serves not only as an indicator of income but also as a potential influencer on the supply side. Regions with higher GDP often have more hospital beds available, which can lead to better advanced healthcare services. Factors such as the share of the population aged 65 and over may signify healthcare seeking behavior related to age-related issues, but they can also impact resource allocations for specialized programs and healthcare facilities. Furthermore, the availability of hospital beds, while directly impacting the supply of healthcare services, can also affect the demand side by potentially causing overcrowding and longer wait times in regions with fewer beds.
In contrast to prior research in China, which has mainly examined the impact of either demand-side or supply-side factors based on administrative boundaries, our study presents a distinct approach. While Zhao’s research focused on socioeconomic disparities among individuals with physical multimorbidity and their association with catastrophic healthcare expenditures, revealing higher prevalence of multimorbidity in poorer regions, 61 Jia’s study explored provincial variations in the incidence and intensity of catastrophic health expenditure. 62 Our study challenges conventional analysis by recognizing the significant influence of cross-regional healthcare utilization. It highlights that local residents’ healthcare expenditures cannot be solely attributed to the performance of local healthcare systems. Instead, this study established a healthcare service market that aligns with both supply and demand sides to gain a better understanding of the factors contributing to variations in healthcare expenditures, which would be essential for the promotion of universal health coverage of China. 63
It is important to note that our study has several limitations. First, focusing on the geographic unit of analysis might overlook certain demand- or supply-side factors such as doctor’s beliefs, treatment patterns, and financial incentives due to measurement feasibility, potentially underestimating the explanatory power of regional expenditure variation. Nonetheless, this regional-level examination remains crucial for tailored policy implications, particularly when policies are designed to suit specific regional contexts. Second, our study establishes correlative rather than causal relationships between demand- and supply-factors, and inpatient expenditure per capita, making the possibility of reversed relationships plausible. Third, by solely analyzing inpatient data, we might overestimate the relationship between demand and inpatient expenditures per capita, as the demand-side factors at the region-level may not be as strongly associated with inpatients as assumed. Finally, the exclusion of episodes involving non-residents living outside of Sichuan Province might introduce bias into the relationship between potential factors and inpatient expenditures per capita.
Conclusions
Through the adoption of a small-area HSA approach, our study demonstrated the existence of large variations embedded in per capita inpatient expenditures across hospital service areas. Independent variables explained in total 87.4% of the variation in inpatient expenditures per capita. Demand-side factors were found to be the predominant contributors to geographic variations among HSAs while supply-side factors played an important role. The evaluation of geographic variations in per capita inpatient expenditures as well as its associated factors have great potential to provide an indirect approach to identify possibly existing underutilized or overutilized healthcare procedures. Future studies are expected to conduct more in-depth investigations to minimize those inappropriately utilized healthcare services.
Footnotes
Appendix 1
Appendix 2
Appendix 3
Attributes of Hospital Service Areas (HSAs).
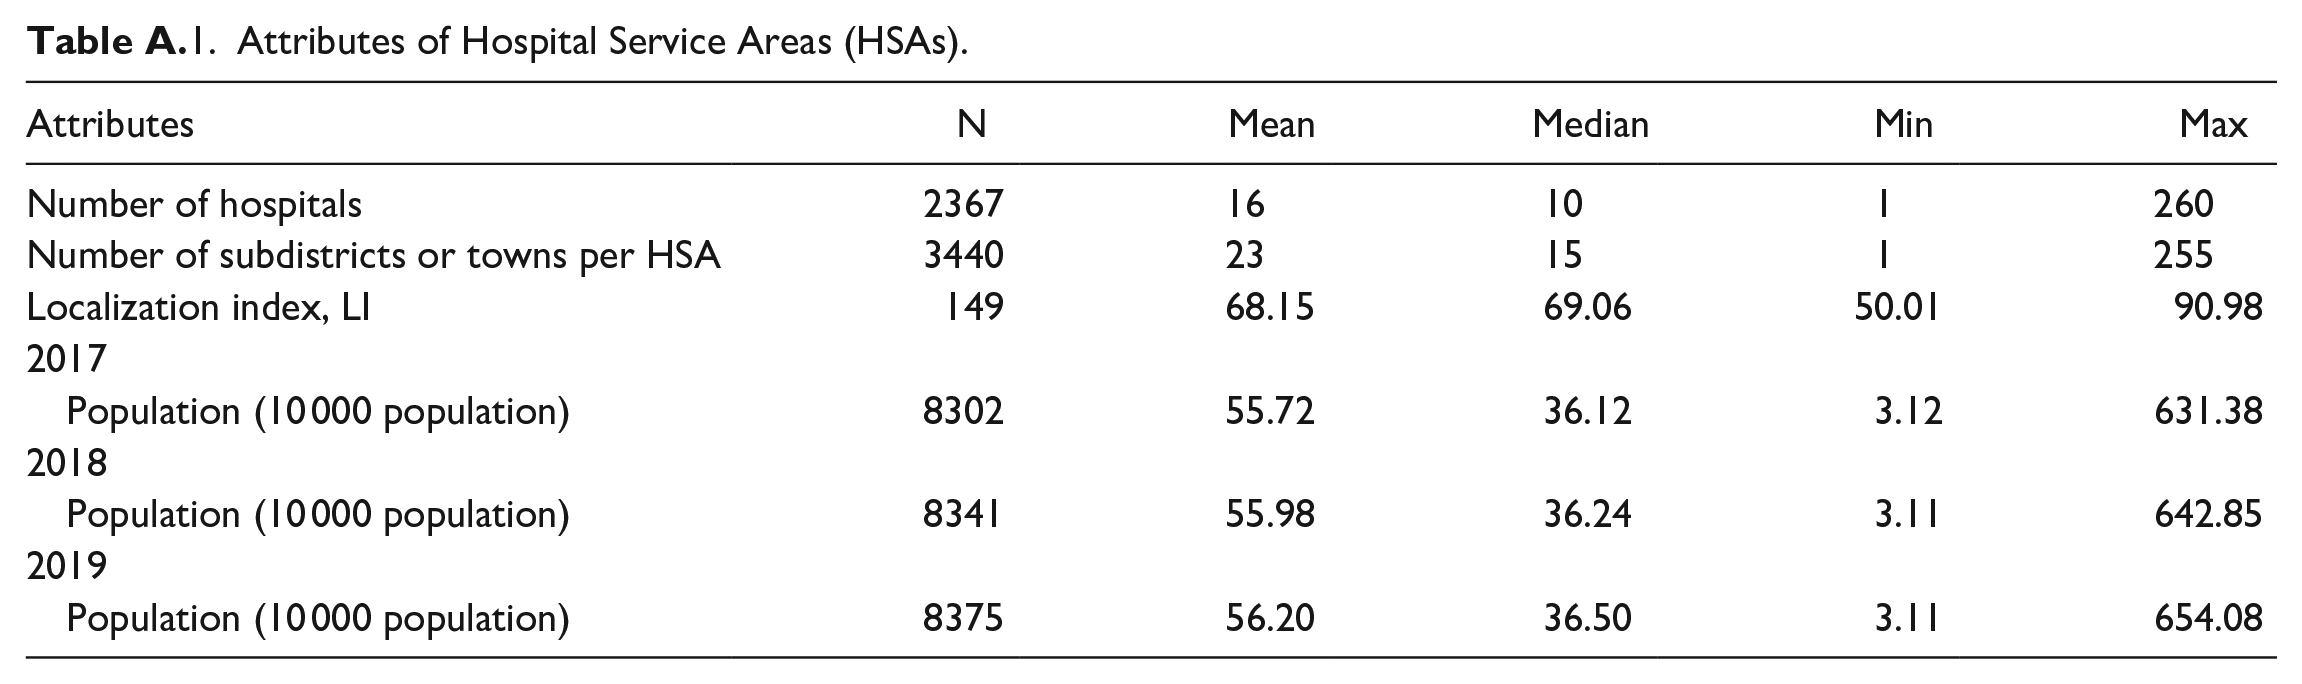
| Attributes | N | Mean | Median | Min | Max |
|---|---|---|---|---|---|
| Number of hospitals | 2367 | 16 | 10 | 1 | 260 |
| Number of subdistricts or towns per HSA | 3440 | 23 | 15 | 1 | 255 |
| Localization index, LI | 149 | 68.15 | 69.06 | 50.01 | 90.98 |
| 2017 | |||||
| Population (10 000 population) | 8302 | 55.72 | 36.12 | 3.12 | 631.38 |
| 2018 | |||||
| Population (10 000 population) | 8341 | 55.98 | 36.24 | 3.11 | 642.85 |
| 2019 | |||||
| Population (10 000 population) | 8375 | 56.20 | 36.50 | 3.11 | 654.08 |
Acknowledgements
The authors thank Yili Yang for providing English editing service to make our paper more readable, Xiaoshuang Zhao for valuable support on data cleaning, Fahui Wang for providing delineation toolbox of small areas’ delineation and Tracy Onega for valuable comments. The authors are responsible for all remaining errors.
Author Contributions
Peiya Cao and Jay Pan had full access to all the data in the study and took responsibility for the integrity of the data and the accuracy of the data analysis. All authors reviewed the manuscript.
Conception or design of the work: Peiya Cao and Jay Pan.
Data collection: Peiya Cao.
Data analysis and interpretation: Peiya Cao.
Drafting the article: Peiya Cao.
Critical revision of the manuscript: Peiya Cao, Jay Pan.
Final approval of the version to be submitted: Peiya Cao, Jay Pan.
Availability of Data and Materials
The hospital discharge data and the facility data of Sichuan that support the findings of this study are available from the Health Bureau of Sichuan Province, but restrictions apply to the availability of these data, which were used under license for the current study, and so are not publicly available. Data are however available from the corresponding author upon reasonable request and with permission of the local Health Bureaus.
Declaration of Conflicting Interests
The author(s) declared no potential conflicts of interest with respect to the research, authorship, and/or publication of this article.
Funding
The author(s) disclosed receipt of the following financial support for the research, authorship, and/or publication of this article: The research was funded by the National Natural Science Foundation of China (Grant No. 72374149 and 72074163).
Ethics Approval and Consent to Participate
Patients or members of the public were not involved in the design and other stages of this study. Health resourcing data are available in a public access repository. Healthcare services data of patients were routinely collected by the health administration department and all individual’s personal information has been desensitized. Therefore, approval and patient consent were not applicable for this study.
Consent for Publication
Not applicable