
Abstract
In an era marked by a sweeping pandemic and the encroaching shadow of an energy crisis, the well-being and lifespan of global populations have become pressing concerns for every nation. This research zeroes in on life expectancy (LE), a powerful indicator of societal health in Oman and Qatar. Our study juxtaposes 3 key factors affecting LE: health status and resources (HSR), macroeconomics (ME), and sociodemographic (SD) factors. To achieve this, we tapped into a comprehensive data set from the World Bank, encompassing a transformative 3-decade span from 1990 to 2020. The intricate interplay between these factors and LE was deciphered through robust Structural Equation Modeling (SEM). Our findings construct a compelling narrative: ME has an indirect yet considerable influence on LE—manifesting with an effect of 0.602 for Oman and 0.676 for Qatar. This influence is mediated by SD and HSR components. Similarly, SD elements impact LE indirectly—with an effect of 0.653 for Oman and 0.759 for Qatar— this effect is mediated by HSR. In contrast, HSR themselves wield a robust and direct influence on LE, indicated by an effect of 0.839 for Oman and 0.904 for Qatar. All these aforementioned effects were statistically substantial (P < .001). Our research magnifies the robust direct influence of HSR on LE in both Oman and Qatar, simultaneously highlighting the noteworthy indirect role of ME and SD factors. This emphasizes the significance of adopting an integrated policy approach that considers all the SD, ME, and HSR factors to improve the population health in both countries, which are also crucial for promoting LE growth in the Gulf Cooperation Council region.
Keywords
Research in context
Generally, Sociodemographic (SD), Macroeconomic (ME), and Health Status and Resources (HSR) determinants exert positive effects on Life Expectancy (LE).
Our findings indicate that, for both Oman and Qatar, the impacts of SD and ME on LE are relatively lesser than the effect derived solely from the HSR determinant.
These results may suggest that Oman and Qatar’s socioeconomic indicators (SD and ME) still require further improvement to bolster their LE projections.
Introduction
The aftermath of the pandemic, coupled with a global energy crisis, has thrown down significant challenges for countries worldwide, touching every aspect of life, including public health. 1 Evaluating life expectancy (LE) from a wide-angled perspective can offer crucial insights into a population’s health status. 2 Also, Social determinants of health (SDoH) have been meticulously examined in various contexts in relation to LE, underscoring the essentiality of understanding how macroeconomic (ME), sociodemographic (SD), and health status and resources (HSR) factors intertwine to shape LE longitudinally. 3
Gulf Cooperation Council (GCC) members exhibit similarities in socioeconomic fabric, cultural norms, and epidemiological profiles. 4 These nations have historically tethered their economies to the oil industry, a decision that significantly amplified their income status and facilitated the development of robust healthcare systems. 5 Despite the significant presence of migrant workers, the sociodemographic characteristics of GCC countries exhibit substantial uniformity. 6 Accompanying shifts in epidemiology, lifestyle-related maladies have surged in prevalence within these territories, rendering a comparative study of LE models not only feasible but also immensely valuable. 4
As prosperous members of the Gulf Cooperation Council (GCC), Oman and Qatar have witnessed a considerable enhancement in health metrics, including LE, primarily driven by their flourishing macroeconomic status toward the culmination of the 20th century. 5 Nonetheless, the economic problems emanating from the global financial slowdown and the flux in oil prices during the early part of the 21st century have introduced formidable challenges. 7 Also, in comparison to their GCC peers, Oman and Qatar are actively navigating their socioeconomic fabric into a post-oil era, emulating Bahrain’s course. 8 Meanwhile, Oman and Qatar are also more comparable in healthcare status due to their substantial public health involvement and similar GDP percentage for health expenditure: 2.3% for Oman and 2.49% for Qatar. 9
Given this evolving landscape, it is paramount that policymakers and stakeholders in Oman and Qatar possess a comprehensive understanding of LE models and their determining factors to frame efficacious policies for their public health output.
Literature Review
LE itself is determined by a variety of factors. On an individual level, genetic predisposition, exemplified by telomere length, plays a significant role. 10 Yet, genetics only account for about 20% to 30% of human LE. 11 At the population level, governments globally use LE at birth as a key indicator of national health status. 12 The LE at birth is interpreted as the average duration a neonate is projected to live, considering the gender- and age-specific mortality rates that are prevalent at the time of birth, and it stands as one of the most recurrently employed indicators of national health status. 12 A recent systematic review revealed that the global LE at birth is associated with macroeconomic (ME), sociodemographic (SD), and health status and resources (HSR) factors. 13
From the ME perspective, higher national income provides resources for better healthcare infrastructure, improved living conditions, and access to healthcare services, all of which contribute to longer LE.13 -15 Additionally, increased trade openness and Foreign Direct Investment (FDI) can lead to economic growth, which in turn can contribute to improved healthcare systems, better access to healthcare services, and higher living standards, all of which are associated with longer LE. 16 However, high unemployment rates are associated with increased stress, lower income levels, and reduced access to healthcare, all of which can negatively affect health outcomes and LE.17,18 Economic development, including factors such as urbanization and industrialization, also plays a role in improving LE. 14 In Oman, higher income levels have been associated with higher LE. 19 Qatar, with its high GDP per capita and economic progress, has witnessed improvements in population health, including LE. 20
From the SD perspective, there is a strong relationship between educational status and LE. 19 Elevated levels of education attainment tend to correlate positively with enhanced health conduct, healthcare accessibility, and socioeconomic possibilities. 21 Equity among genders serves as another societal demographic aspect influencing longevity. Evidence indicates that gender equality, when viewed as a socio-structural component, can introduce both favorable and unfavorable outcomes on longevity and other socio-ecological facets. 22 Aspects like social affiliations and interactions have been determined as crucial factors impacting life span. A larger network of social affiliations, encompassing both tangible and perceived aspects, has been associated with an elongated life span. 23 One’s social function may likewise play a role in determining longevity. 24 Elements such as job status and social support can influence the quality of life and, thus, life span.24 -26 Social status represents another societal demographic element linked with life span.25,26 Studies have revealed disparities in life span among different social strata. 25 Disparities in life span among varying regions and metropolitan zones have been attributed to the contextual and societal demographic attributes of these locales. 27 Other demographic factors, such as fertility rates and population structure, are also associated with LE.28 -33
Primary education enrollment rates have increased in Qatar from 80% level to 92% level between 1992 and 2011. 34 Similarly, in Oman, there is a positive correlation between primary school enrollment and LE from 1971 to 2012. 35 Infant mortality rate (IMR) also has a significant role in LE in several regions,19,36 which may be true in Oman and Qatar. Improvements in healthcare services have contributed to a decrease in IMR. 20 Additionally, demographic changes in the Gulf countries have led to a decline in fertility rates in Oman and Qatar, which may also affect LE. 37 However, it is essential to note that population growth in the Gulf is primarily driven by immigration trends. 38 Between 1971 and 2012, Oman noted a markedly negative correlation between population growth and LE. 34 On the other hand, Qatar registered the most significant annual population growth globally from 2005 to 2011. 38
From the HSR perspective, studies in Southeast Asia and Bahrain have shown a significant positive correlation between the percentage of vaccinated individuals (for diseases such as BCG, polio, diphtheria, tetanus, and DPT) and LE.3,36 Inversely, air pollution and water contamination can pose serious health risks, leading to a range of health conditions such as respiratory diseases, cardiovascular diseases, and diarrheal diseases, all of which can shorten LE. 39 Inadequate sanitation and lack of access to clean water can expose individuals to a variety of infectious diseases, which contribute to mortality, hence reducing LE. 40 Climate change can also lead to food insecurity by disrupting agricultural productivity, which can further impact health and LE. For instance, malnutrition and stunting in children can result from food insecurity and can have lifelong health consequences, including increased susceptibility to diseases and reduced LE. 39
In low- and middle-income countries (LMIC), restricted entry to health services, spanning primary, preventive, and specialized care, can augment death rates and curtail lifespan. 25 Insufficient healthcare infrastructure, scarcity of health professionals, and absence of health insurance coverage are typical hurdles in these countries that impede access to optimal healthcare.41 -43 Moreover, the supply and cost-effectiveness of indispensable drugs and vaccines significantly influence health outcomes and lifespan. 25 Furthermore, the occurrence of chronic conditions and multimorbidity is higher in LMICs compared to wealthier nations, potentially leading to increased disability and reduced lifespan. 44 Infectious diseases, such as HIV/AIDS, tuberculosis, and malaria, also contribute to elevated death rates in these nations. 45 Enhancing disease prevention, early detection, and treatment services can aid in alleviating the disease burden and augmenting lifespan. 46 Nevertheless, long lifespans also expose the elderly population in LMICs to high health risks due to diseases, disabilities, and low quality of life, which demand insight into the implications of population aging. 47
In Oman, healthcare services were scarce prior to 1970, with only 2 hospitals in the country. However, the Ministry of Health now covers over 80% of the overall healthcare expenditure, accounting for 10% to 11% of Oman’s annual budget, contributing to the increase in national LE. 37 Other factors, such as food production, have been found to have a positive relationship with LE in Oman. However, CO2 emissions showed a significant negative relationship in the short-run analysis and an insignificant relationship in the long-run analysis. 35 Qatar has been ranked by the World Health Organization (WHO) as the country with the highest per capita health expenditure among GCC countries. 38 With increasing health care services, Qatar’s average LE is expected to be the highest among other GCC countries, projected to reach 80.59 years in 2022. 38 Nevertheless, due to its significant oil and gas production, Qatar faces air pollution issues, and CO2 emissions have a substantial negative impact on LE in the country. 48
Aim and Objectives
This study aims to investigate the factors influencing life expectancy in Oman and Qatar. By analyzing the impact of Health Status and Resources (HSR), macroeconomic (ME), and socio-demographic (SD) factors on Life Expectancy (LE), we seek to gain insights into the determinants of population health in these countries. The objective is to provide a clearer understanding of how these factors contribute to improving LE. Through this research, we aim to inform policymakers and healthcare professionals about effective strategies to enhance life expectancy and promote overall well-being in Oman and Qatar. The theoretical model incorporates 6 hypothesized relationships between these 3 Latent Variables (HSR, ME, and SD) on LE denoted as H1, H2, H3, H4, H5, and H6, as illustrated in Figure 1, which was inferred from previous studies and systematic review.3,13,36,49 H1 signifies the relationship between ME and SD. H2 signifies the relationship between ME and HSR. H3 stands for the relationship between ME and LE. Furthermore, H4 represents the relationship between SD and HSR. H5 denotes the relationship between SD and LE. Lastly, H6 refers to the relationship between HSR and LE. Each of these relationships provides a lens through which we can examine the intricate interplay of these variables.

The Theoretical Model of Macroeconomic, Sociodemographic and Health Status and Resources on Life Expectancy.
Method
Study Design and Data Source
This research utilized an ecological population-based study design with retrospective observations. Secondary data from the World Bank database34,50 -61 were used as sources for the study due to their reliability and widespread use by various primary data collectors. The World Bank data is considered reliable because it adheres to globally recognized standards and norms. The World Bank collaborates with international organizations, including the United Nations (UN), the International Monetary Fund (IMF), and local financial institutions to ensure their data is reliable.62,63
The data considered the indicators of ME, SD, HSR, and LE among the citizens of Oman and Qatar. These ME, SD, and HSR indicators were scrutinized based on the previous systematic review in this area. 13 The indicators, the MVs, were exhaustively put on trials according to the chosen modeling study, and the model modifications ensue accordingly, which is explained further in the next subsection under “statistical analysis.”
The study’s observation period spanned from 1990 to 2020 because this period had the most available data. The ethical approval exemption was obtained from Medical Research Ethics Committee of Sultan Qaboos University (MREC #2644).
Statistical Analysis
The chosen method for this study is structural equation modeling (SEM), specifically the Partial Least Square (PLS) SEM, due to its suitability for exploring the complexity between latent variables and manifest variables.64,65 SEM allows for the examination of multiple factors simultaneously and provides a comprehensive understanding of the interplay between socioeconomic factors, health resources, and demographics in relation to LE.65,66 One of the key justifications for employing PLS-SEM in this research is its ability to handle non-normal data, small sample sizes, and large amounts of missing data.64,65 These characteristics are often encountered in population-based studies, making PLS SEM an ideal choice for analyzing the available data from the World Bank database.64 -66 Furthermore, this method enables the identification of pathways and relationships between latent variables and manifest variables. By utilizing Partial Least Squares (PLS) SEM, this exploratory study can effectively capture the complex nature of the relationships between SD, ME, HSR, and LE, providing valuable insights into the determinants of LE. This methodological approach can facilitate in achieving the aim and objectives of the study mentioned in the ’Introduction’ section.64,65 From here on, the terms SD, ME, HSR, and LE align with the reflective pattern in PLS-SEM (refer to Figure 1) and will be referred to as Latent Variables (LV), signifying the unseen or the latent concepts in the model’s dynamics.64 -66 Correspondingly, the indicators sourced from the World Bank database for these models will be known as Manifest Variables (MV). These MVs collectively reflect the corresponding LV’s concept (either SD, ME, HSR, or LE). MVs can be substituted with other MVs from the same concept derived from a systematic review as long as they gage population parameters and adhere to each corresponding LV’s definition.64 -66 All the collected MVs were scrutinized, assessed, and modified according to the PLS-SEM guideline, and they can be omitted or replaced to maintain the reliability and validity of the LVs constructs.64 -66 Moreover, using 1 MV under 1 LV is acceptable in research papers as long as the variable aligns with the concept according to the theoretical framework.67 -69 Following SEM principles, the specific MVs merge into a single concept under the corresponding LV, and the overall model no longer recognizes them by their individual indicators.64,65 The upcoming parameters in the next paragraphs of this section will thus clarify how to verify the LVs’ existence and their interrelations.
This study’s strength lies in the interplay of all latent variables (LVs) in the conceptual path model (see Figure 1). To ensure statistical power, a minimum expected R 2 of .25 for each LV with a minimum of 30 years of observation can achieve 80% power at a 5% significant level.64,70 Missing data, if less than 15%, was imputed according to PLS-SEM guidelines. 65 As the number of missing data within the period of 1990 to 2020 was not large, the mean replacement technique was used. 71 The conceptual model, influenced by a theoretical framework and previous systematic review, includes manifest variables (MVs) and LVs listed in Table 1. All these items impact LE, 13 as seen in Figure 1. Negative loadings in the PLS algorithm were transformed, keeping indicator reliability significant (P < .05). 66 Internal consistency reliability for each LV maintained a minimum threshold of 0.7 for Cronbach’s alpha (CA), Composite Reliability (CR), and Rhô-Alpha (Rhô-A). Convergent validity was assessed via Average Variance Extracted (AVE), with a minimum cut-off of 0.50. 66 Also, the upper bound of the Confidence Interval (95% CI) of the HTMT criterion should be <1 to establish discriminant validity between the 2 reflective constructs, which are the LVs in this study. 72 The predictive power of the model was gaged by R 2 (>.25), Q 2 (>.35), and f2 (>.35) values.64 -66,70 The comparison of study results was visually depicted via a radar chart illustrating the total effects from H1 to H6.
List of Latent and Manifest Variables with Their Respective Loadings.
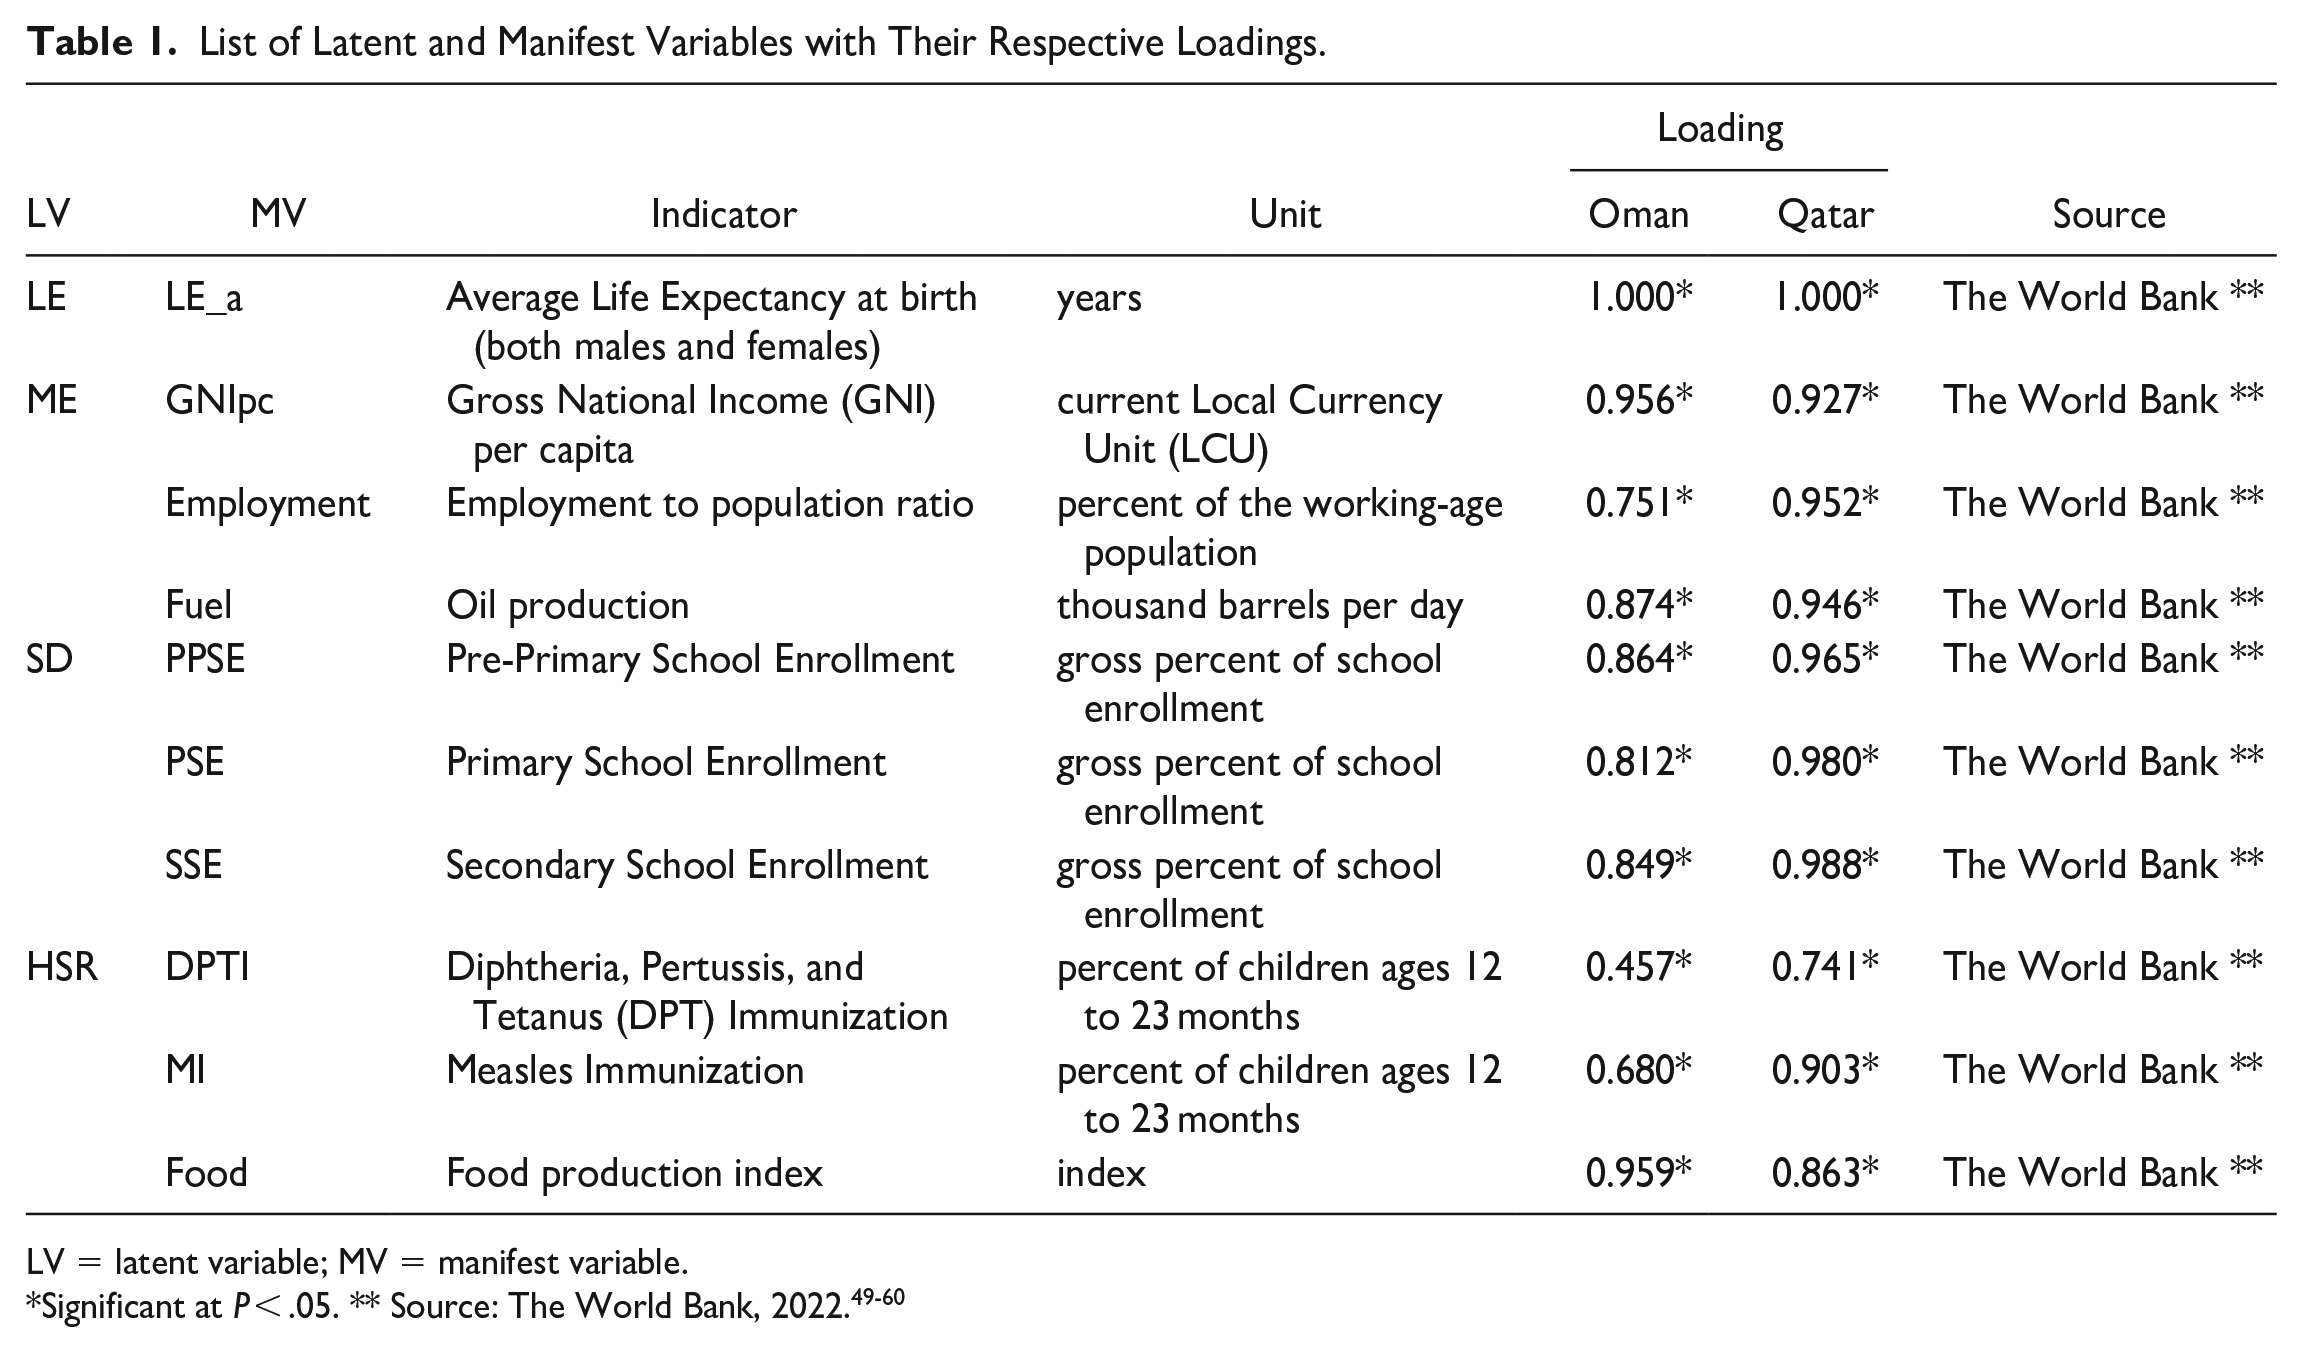
LV = latent variable; MV = manifest variable.
A radar chart is made up of evenly spaced lines, with each line representing a variable, such as a Latent Variable (LV).73,74 Each line’s length depends on the value of the variable for a particular data point, compared to the highest value of the variable across all data points.73,74 The interpretation can be made by observing which variables have higher or lower values, indicated by the distance from the center of the chart. 73 When comparing multiple data points, we can see which ones perform better on which variables. 75
Radar charts, offering a comprehensive visual representation of multi-variate data, can serve as an excellent tool for comparing 2 statistical models. The data presentation on equiangular spokes facilitates a clear comparison between models across diverse variables.76,77 In the quest to contrast the 2 models pertaining to LE determinants from the 2 countries, these charts provide an invaluable perspective. Radar charts elucidate the distinctive influence of each determinant on LE, thereby spotlighting comparative variations. 78 Several studies corroborate the utility of radar charts in various research domains, underscoring their value in comparing multiple variables and dimensions.75,76
Results
The final model for Qatar and Oman provides 1 MV for LE, 3 MVs for ME, 3 MVs for SD, and 3 MVs for HSR. LE is solely represented by the average life expectancy at birth (LE_a). The MVs for ME are Gross National Income per capita (GNIpc), Employment to Population ratio, and Oil production. The MVs for SD are Pre-Primary School Enrollment (PPSE), Primary School Enrollment (PSE), and Secondary School Enrollment (SSE). The MVs for HSR are Diphtheria, Pertussis, and Tetanus Immunization (DPTI), Measles Immunization (MI), and Food production index (Food). Each MV and its related description are displayed in Table 1 and Figures 2 and 3, and the loadings of each MV was statistically significant (P < .05).
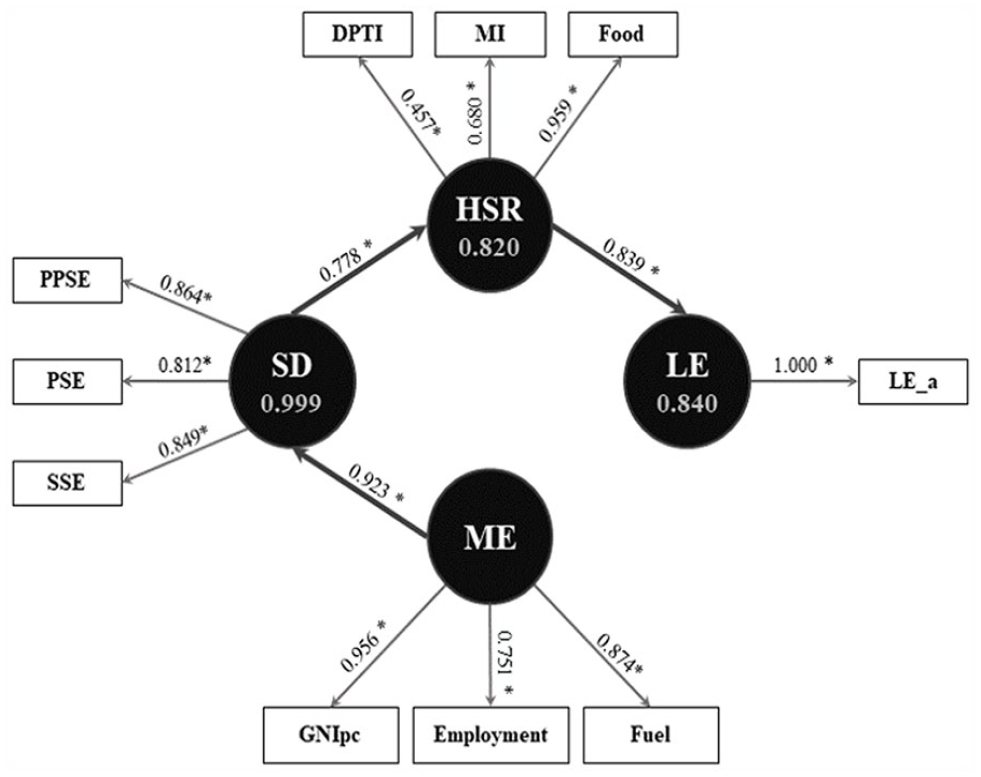
The final model of the impact of macroeconomic, sociodemographic, and health status—resources on life expectancy in Oman (1990-2020).

The final model of the impact of macroeconomic, sociodemographic, and health status—resources on life expectancy in Qatar (1990-2020).
Table 2 summarizes the reliability, validity, and predictability of each LV in the final models. The CA, CR, and Rhô -A of all the LVs involved exceeded 0.7. The AVEs were also above the threshold of 0.5. The LE variables for Oman and Qatar have a CA. CR, Rhô-A, and AVE of 1.0. The Q 2 values for Oman, as well as Qatar, are strong (Q 2 > 0.35) for SD, HSD, and LE. In the Oman model, the R 2 explains 99.9% of the variance in the SD, 82.0% in the HSR, and 84.0% in the LE. On the other hand, the Qatar model explains 74.8% of the variance in SD, 60.6% in HSR, and 80.3% in LE. Regarding the HTMT, each relationship in the final models yielded a score where the 95% CI of the estimation was below 1.0.
Reliability, Validity, and Predictability of the Latent Variables.

CA = Cronbach’s alpha (>.7); Rhô -A = Rhô-alpha (>.7); CR = composite reliability (>.7); AVE = average variance extraction (>.50); R 2 : >.25 recommended; Q 2 : <.02 (weak), .15 (moderate), >.35 (strong); SD: sociodemographic; ME = macroeconomic; HSR = health status and resources; LE = life expectancy; LV = latent variables; HTMT = hetero-trait and mono-trait ratio (95% CI < 1.0); All estimates are significant at P < .05.
All the details pertaining to the direct, indirect, and total effects are consolidated in Table 3. Each effect holds significance as every f2 value of the given direct effect exceeds 0.35. Figure 4 showcases a radar chart that compares the total effects between Oman and Qatar, as per the hypothesized relationships (H1 to H6). In Table 3, the results outline the following effects, which are all statistically significant (P < .05):
- H1: The direct effect of ME to SD (ME→SD) is 0.923 for the Oman model and 0.891 for the Qatar model, signifying a strong effect size (f2 >0.35).
- H2: The indirect effect of ME to HSR via SD (ME→SD→HSR) stands at 0.718 for the Oman model and 0.747 for the Qatar model.
- H3: The indirect effect of ME to LE via SD and HSR (ME→SD→HSR→LE) is 0.602 for the Oman model and 0.676 for the Qatar model.
- H4: The direct effect of SD to HSR (SD→HSR) is 0.778 for the Oman model and 0.839 for the Qatar model, indicating a strong effect size (f2 >0.35).
- H5: The indirect effect of SD to LE via HSR (SD→HSR→LE) is 0.653 for the Oman model and 0.759 for the Qatar model.
- H6: The direct effect of HSR to LE (HSR→LE) is 0.839 for the Oman model and 0.904 for the Qatar model, suggesting a strong effect size (f2 >0.35).
Effect Size, Direct Effect, Indirect Effect, and Total Effect of the Latent Variables.

SD = sociodemographic; ME = macroeconomic; HSR = health status and resources; LE = life expectancy; f2: Effect size <0.02 (weak), 0.15 (moderate), >0.35 (strong); All effects are significant at P < .05.

Radar chart for the comparison of total effects between Oman and Qatar.
Both Oman and Qatar models adhere to the reliability, validity, and predictability requirements of Partial Least Squares Structural Equation Modeling (PLS-SEM). The models exhibit a similar pattern, where the full model illustrates a sequence of mediation from ME to SD, SD to HSR, and HSR to LE. The primary aim of this study was to confirm the existence of positive and direct effects for H1 (ME→SD), H4 (SD→HSR), and H6 (HSR→LE). Neither country demonstrated direct effects on H2, H3, and H5. However, the results did unveil significant indirect effects for H2 (ME→SD→HSR), H3 (ME→SD→HSR→LE), and H5 (SD→HSR→LE).
The radar chart in Figure 4 offers a rough comparison between Qatar and Oman based on the latent effects of SD, ME, and HSR on their respective LE. Given that these effects are standardized within the SEM, each relationship (as dictated by each hypothesis in the study; see the “Aim and Objectives”) can be compared. A larger effect corresponds to a greater extension of the radar according to its scale.
Discussion
The final model included Gross National Income per capita (GNIpc), employment, and fuel as the MVs for ME. The GNIpc represents a measure of a nation’s total income from individuals and businesses. It is calculated by converting the income to U.S. dollars using the World Bank Atlas method and then dividing it by the midyear population. On the other hand, GDP is indicative of the cumulative worth of all goods and services manufactured within the borders of a nation by its local producers, inclusive of taxes levied on products and exclusive of specific subsidies. 79 Since many studies utilize GDP instead of GNI, countries with a significant number of foreign investments, such as GCC members, are better represented with GNI as their ME indicator, especially when considering GNI per capita.14,20,80 Nationalization of the existing job markets has increased in the past decade, 81 despite high unemployment among the local population. 40 While both countries are struggling with current economic hardship, fossil fuel provision continues to significantly contribute to ME development. 3
Interestingly, the ME determinant for both countries directly affects SD rather than LE, which is different from a previous study using the Bahrain model. 3 The SD indicators include education measures such as Pre-Primary School Enrollment (PPSE), Primary School Enrollment (PSE), and Secondary School Enrollment (SSE). The school enrollment ratio is calculated as the proportion of students who are enrolled in school compared to the total number of individuals in the corresponding age range for that educational stage. 79 Previous studies have shown that a well-educated population can access health services through economic development and make healthy lifestyle choices.19,36,82 In Oman and Qatar, SD has a direct effect on HSR, similar to the Bahrain Model. 3 However, despite high school enrollment rates, neither country has effectively addressed obesity or other lifestyle-related diseases. 83 Policymakers should consider promoting healthy lifestyles as part of public awareness and establishing sociocultural norms to enhance the positive impact of SD on HSR and LE.
The results for HSR in both models indicate that vaccination (DPT and Measles) and food provision play a significant role in contributing to LE, as observed in numerous other countries.3,13,36,40,46 Vaccination rates are defined by the percentage of infants aged 12 to 23 months who have been administered stipulated vaccines, as verified by the immunization card or the maternal account. 79 Concurrently, the food production index quantifies the volume of consumable and nutritious produce generated for consumption. 79 Implementation of a compulsory vaccination program for children by the government has resulted in decreased mortality rates and improved LE. Together with access to nutritious food, these preventive measures have the potential to consistently maintain LE projections.13,84 Both countries demonstrate a strong and direct impact of HSR on LE.
The nexus of SD, ME, and HSR holds substantial resonance for policy formulation in the field of LE improvement in Qatar and Oman. Consider, for instance, the merits of a holistic policy initiative: one that pivots on eradicating poverty, catalyzing employment opportunities, and provisioning quality healthcare services. Such a strategy holds the potential to attenuate the adverse impacts of socioeconomic disparities on health and welfare, a phenomenon well-documented in European territories by Mackenbach et al and his team. 85 Similarly; this study reveals that governmental effort for health services and infrastructure wields a direct, positive bearing on LE. As a consequence, it’s crucial to uphold, if not escalate, financial allocations for healthcare, even in the face of the current economic tribulations, in order to safeguard public health and well-being. 86 It falls to policymakers in Qatar and Oman to devise policies that stimulate the integration of the holistic model, as such transformations can catalyze advancements in LE. Through the powerful tools of education and awareness, society can be shaped toward a health-conscious lifestyle, thereby enhancing health outcomes. Findings from Raghupathi and Raghupathi substantiate that advanced education levels typically equate to superior health standards and longer lifespans, especially when compared to those possessing lower educational qualifications. Furthermore, higher educational accomplishments are correlated with a decrease in infant mortality rates, an increase in LE, enhanced child vaccination rates, and higher rates of academic enrollment.87,88
The tables and radar charts reveal that there is a minimal disparity between the 2 countries in terms of the observed effects (H1-H6). Despite variations in geographical and economic size, the study results indicate that the SDoH exerts a comparable impact on LE models in both Oman and Qatar. 89 The comparison showed that all relationships involving socioeconomic aspects (H1, H2, H3, H4, and H5) exhibit strong and significant effects. Interestingly, both countries show that the total effect of HSR on LE is stronger than that of ME (H3) or SD (H5). This contrasts with previous research on LE in Bahrain. 3
Furthermore, in addition to being supported by other research, socioeconomic development proves to be more important than health-related factors in the long run. 89 This is confirmed through a comparison between the 2 countries, suggesting that policymakers should prioritize enhancing socioeconomic development to achieve positive long-term outcomes for LE. 89 Considering that both countries have a vision for transitioning from fossil fuels, economic diversification may strengthen the positive socioeconomic effect on LE. 41 While not undermining the importance of public health, it is understandable that a relatively stable and powerful socioeconomic capacity can guide the population toward better health choices even without intervention by the local authority.89,90 As a lesson for the other GCC members, economic diversification and policies that can strengthen socioeconomic performance may elevate their rankings in terms of LE compared to other developed countries with higher LE. 90
When comparing the models of Oman and Qatar, Qatar showed a slightly stronger overall effect in terms of the influence of SD, ME, and HSR on LE. This may be attributed to Qatar’s more dynamic economic sources, as the country has pursued economic diversification more extensively.7,91 This notion is further supported by Bahrain’s economic performance, which implemented economic diversification strategies than Oman or Qatar in the post-oil era 92 and showed a strong effect of SDoH on LE. 3
Limitations
This study had several limitations that may have influenced the results. First, unlike previous studies, 13 health care expenditure was not included as a variable in the case of Oman and Qatar due to a high number of missing data from the source for the period before the year 1990. This limitation was also confirmed by Baş & Kocakaya, 92 who found that healthcare expenditure in the Middle East and North Africa region does not have a significant direct effect on LE. Second, it is important to note that the study employed an exploratory approach, which introduces the potential lack of model fit in its final results. As the dataset used aggregate population data, which might not account for subgroup exposures that can affect individuals, ecological fallacy issues may ensue. Third, from an econometric analysis perspective, the Generalized Method of Moments (GMM) is a common approach for handling time-series data in statistical models. However, due to the comparison of only 2 countries in this study, there are insufficient data points to apply GMM, and its interpretation must be approached with caution. Overall, one needs to be careful in interpreting the result of our study if the model is to be taken into account for analyzing other countries’ contexts.
Conclusion and Policy Recommendations
The conclusions drawn from our final model underscore that all the latent variables (LVs) play a substantial role in affecting life expectancy (LE), both directly and indirectly. Our studies in both Oman and Qatar reveal that health status and resources (HSR) directly bolster LE in a positive manner. In contrast, sociodemographic (SD) and macroeconomic (ME) factors influence LE indirectly yet positively. This model accentuates the crucial role of governmental backing for health services and infrastructure, even amidst socioeconomic adversities, as it is directly intertwined with LE. Additionally, the model comparison shows that Oman and Qatar have opportunities to further enhance their LE projections. This can be achieved by strengthening and integrating their SD and ME facets, as currently, these latent variables exert a lesser impact than HSR alone.
The policymakers may start the multifaceted strategies with a strong emphasis on education and awareness. Policymakers should place investments in initiatives that boost health literacy and inspire healthier habits at the forefront. Such efforts could involve campaigns stressing the crucial role of preventive healthcare, nutrition-focused lifestyles, and adept disease management. At the same time, they can also address the pivotal role of social determinants of health in shaping holistic outcomes. They can construct policies that directly tackle issues such as income disparity, education levels, housing conditions, and job opportunities. By strategically mitigating these disparities and enhancing social circumstances, they can positively impact LE.
Moreover, a concerted focus on economic development is of paramount importance. Policymakers can channel efforts toward advocating for sustainable economic expansion, fostering a diversified economy, and generating job opportunities. This active stance could elevate socioeconomic indicators, including income levels, employment rates, and living standards, which in turn can positively influence LE.
Given the array of health challenges that the populations face, targeted interventions become a necessity. Policymakers can devise and implement measures to combat prevalent health issues such as non-communicable diseases and maternal-child health by targeting specific age or demographic groups. However, these efforts should not exist in silos. Policymakers should foster collaboration and partnerships among government agencies, healthcare providers, community organizations, and other stakeholders. This cooperative ethos can support the development and implementation of comprehensive policies that consider sociodemographic, macroeconomic, and health-related factors.
Despite the valuable insights, the study acknowledges several shortcomings and constraints. These include the absence of health care expenditure as a variable, attributed to the missing data issue, ecological fallacy issue, and a lack of fit in the model. Another limitation is the study’s utilization of aggregate population data without adjusting for individual subgroup exposures. Further, the restrictions in applying the Generalized Method of Moments (GMM) due to limited data points in the country comparison must be considered. These factors necessitate careful interpretation of the study’s findings.
Footnotes
Acknowledgements
The authors would like to thank you for the comments from the reviewers.
Author’s Contributions
Designed (MFC, SJ, AM, AABW), data collection and analysis (MFC, AABW), manuscript preparation (AABW, SJ, AM, MA, KB, MFC).
Data Availability
The dataset used in this research can be made available with a reasonable request from the corresponding author.
Declaration of Conflicting Interests
The author(s) declared no potential conflicts of interest with respect to the research, authorship, and/or publication of this article.
Funding
The author(s) disclosed receipt of the following financial support for the research, authorship, and/or publication of this article: This study was funded by the International Research Collaboration Co-Fund QU-SQU (CL/SQU-QU/MED/22/01).
Ethical Approval
Ethical approval exemption was obtained by the Medical Research Ethics Committee of Sultan Qaboos University (MREC #2644).