
Abstract
Weight-related self-monitoring (WRSM) apps are often used by emerging adults to assist in behavior change. However, little is known about the relationship between WRSM among the general population of emerging adults and various physical activity and screen time behaviors. This paper examines associations between WRSM app use and various forms of physical activity and screen time among a population-based sample of emerging adults. Data come from EAT 2018 (N = 1,568, mean age = 22.0 ± 2.0 years), a population-based sample of emerging adults from Minneapolis/St. Paul, Minnesota. Participants reported on the types of WRSM apps used (physical activity and/or dietary focused), in addition to how much time they spent doing physical activity, whether they practiced yoga, compulsive exercise, recreational screen time, social media use, and whether they viewed dieting/weight loss materials. Linear and logistic regressions were used to assess adjusted means and prevalences of outcomes. We found that physical activity-focused WRSM app users engaged in more hours of total (8.7 vs 7.2, P < .001), and moderate-to-vigorous (5.1 vs 4.3, P = .002) physical activity compared to non-users. Similar results were found for dietary WRSM app users compared to non-users. However, WRSM app users had higher levels of compulsive exercise and were more likely to view dieting/weight loss materials (Ps < .001). Findings suggest that although physical activity is higher among WRSM users, the types of physical activity and screen time behaviors WRSM users are engaging in may be harmful.
Keywords
In clinical trials, physical activity-focused WRSM app use is associated with higher levels of physical activity. However, little is known about whether WRSM is associated with physical activity and screen time behaviors among a population-based sample of emerging adults.
Our findings indicate that physical activity is higher among both physical activity and dietary-focused WRSM app users. However, although WRSM users engage in more physical activity and not more screen time, the specific types of physical activity and screen time behaviors WRSM users are engaging in may be harmful.
The findings suggest that WRSM is associated with a myriad of health behaviors including health-promoting (i.e., more physical activity) and health-compromising (i.e., compulsive exercise). Therefore, until causality can be determined policy makers and health care providers should be cautious in recommending the use of WRSM.
Introduction
It is widely known that physical activity is beneficial for health. Higher levels of physical activity, particularly moderate-to-vigorous physical activity (MVPA), is associated with reduced risk of cardiovascular disease, stroke, certain forms of cancer, and all-cause and cause-specific mortality.1 -5 Other types of physical activity can also be beneficial for various aspects of health; for example, yoga is associated with enhanced flexibility, positive mental health outcomes, and higher body satisfaction.5 -9 Despite the comprehensive health-promoting effects of physical activity, young people in the US tend to progressively decrease their physical activity from adolescence to emerging adulthood, and many emerging adults do not meet physical activity recommendations. 10 Research suggests the timing of the decrease in physical activity is particularly problematic because emerging adulthood is a critical period for establishing healthful lifestyle behaviors, such as regular participation in physical activity and screen time habits.11 -14 Given the reduction in physical activity and elevated screen time during emerging adulthood and potential long-term health implications, identifying methods to increase physical activity and decrease screen time among this age demographic is of great public health importance.
One technique that is increasingly being used to promote physical activity among emerging adults is the use of weight-related self-monitoring (WRSM) smartphone applications and related technologies (herein referred to as apps) that track one’s physical activity and/or dietary intake (eg, Fitbit, MyFitnessPal, etc.). Social cognitive theory suggests that WRSM leads to behavior change by bringing attention to one’s behaviors, allowing individuals to set goals and monitor their progress toward their goals, thereby building self-efficacy and self-regulation skills. 15 Recent reviews and meta-analyses suggest that the use of physical activity-focused WRSM apps in clinical interventions may indeed improve physical activity levels, particularly in young people.16,17 However, the success of WRSM apps in improving physical activity may be due to intervention-specific components or populations, such as low baseline physical activity, prescribed app-use dosage, intensity, or access to additional education and support. Therefore, it is conceivable that WRSM apps may not alter health behaviors in non-clinical populations or in naturalistic settings that do not provide the accompanying intervention supports. Given that millions of emerging adults are using WRSM apps outside of the intervention context, 18 research is needed to examine associations between use of WRSM apps and physical activity in the general population of emerging adults.
Additionally, associations between WRSM apps and physical activity may differ depending on the content and focus of the WRSM app. Many apps are physical activity-focused (eg, Fitbit, pedometers), but there are also many that are dietary-focused and may or may not include physical activity components (eg, MyFitnessPal, MyPlate). Dietary-focused WRSM apps have primarily been used clinically to intervene upon young people’s healthful eating habits rather than physical activity.19,20 However, it is possible that the increased awareness brought on by the use of dietary-focused apps may also increase users’ awareness of correlated health behaviors, such as physical activity. Dietary intake and physical activity behaviors are highly correlated, and as individuals change their dietary intake via self-monitoring, they may also subsequently change their physical activity.21,22 To our knowledge, no previous studies have examined potential associations between the use of dietary-focused WRSM apps and amount of physical activity among emerging adults. Further, there is limited information on the relationship between physical activity- and dietary-focused WRSM app-use and specific types of physical activity behaviors, both positive (e.g., MVPA and yoga) and negative (e.g., compulsive exercise), during the critical developmental phase of emerging adulthood.
Because different forms of physical activity have distinct impacts on health, it is important to examine the associations between WRSM app use and various forms of physical activity. While total physical activity and MVPA are important for cardiovascular disease risk, other forms of physical activity that promote mental health may be equally important. For example, yoga focuses on the mind-body connection, is strongly associated with positive mental health outcomes, as well as physical health outcomes such as flexibility.5 -8 However, to our knowledge, there has been no research to examine whether WRSM app users may be more likely to engage in yoga. Additionally, although physical activity is associated with positive health outcomes, it is important to note that exercise can be harmful for physical and mental health if it is compulsive.23,24 Compulsive exercise is a maladaptive pattern of exercise or relationship with exercise that is associated with social and physical distress, irrespective of the amount or type of exercise. 24 It is possible that the goal-oriented nature of WRSM apps increases the likelihood of compulsive exercise or alternatively, that people who compulsively exercise are drawn to WRSM apps.25,26 In either case, understanding if there is a relationship between WRSM and compulsive exercise has important health implications. Due to the differing health consequences linked to various forms of physical activity, it is important to examine the associations between WRSM app usage and various forms of physical activity (total physical activity, MVPA, yoga, compulsive exercise) to gain a nuanced understanding of the relationships between WRSM and physical activity and thus, the potential public health implications and utility of WRSM in improving physical activity.
In addition to physical activity, it is possible that WRSM apps may also be associated with users’ screen time behaviors. It is possible that WRSM may be associated with lower levels of screen time, as WRSM apps often indirectly encourage users to reduce screen time as a health-promoting strategy. However, many manual app components (e.g., physical activity or dietary intake input logs, online exercise videos) inherently require one to participate in screen time activities and screen-based behaviors. 27 It is also possible that WRSM app users are more likely to participate in potentially risky screen time activities, such as use of social media platforms or viewing web-based dieting or weight loss materials. Although social media use may increase feelings of peer support when trying to make behavior changes, 28 regular engagement with social media sites may negatively impact users’ body image or self-esteem and ultimately decrease self-efficacy for healthful behavior change.29 -31 Further, it is possible that components of WRSM apps, such as advertisements, may increase users’ interactions with dieting/weight loss materials which would likely also negatively impact users’ body image. 32 Those who are drawn to WRSM app use may also be more likely to be trying to lose weight and therefore more likely to consume such materials and/or dieting and weight loss materials. Given the potential health implications of screen time behaviors, it is important to examine the relationships between WRSM app use and emerging adult recreational screen time, including social media use, and whether users are viewing dieting/weight loss materials.
The objectives of this study were therefore to examine the cross-sectional associations of WRSM app use with physical activity and screen time behaviors, in a population-based sample of emerging adults. We hypothesized that WRSM app use would be associated with increased measures of physical activity, including compulsive exercise. We further hypothesized that WRSM app use would not be associated with total recreational screen time, but that WRSM app use would be associated with higher social media time and higher likelihood of examining dieting/weight loss material.
Methods
Study Design and Sample
Data were collected from emerging adults (N = 1568) as part of the EAT 2010-2018 (Eating and Activity over Time) study. EAT 2010 to 2018 is a longitudinal, population-based study of eating and weight-related health among socioeconomically and ethnically/racially diverse young people. Participants were enrolled in the EAT 2010 study when they were students (mean age = 14.4 ± 2.0 years) at public middle and high schools in Minneapolis/St. Paul, Minnesota. Participants completed surveys and anthropometric measurements at EAT 2010 and completed follow-up surveys 8 years later as emerging adults (mean age = 22.0 ± 2.0 years). The University of Minnesota Human Subjects Committee reviewed and gave ethics approval for all study protocols (Approval: FWA00000312). Passive parental permission and assent was obtained from participants in 2010 and digital consent was obtained in 2018.
Because attrition from the original sample did not occur at random, all analyses were weighted using inverse probability weighting (IPW). IPW is the recommended method to account for missing data in longitudinal studies and minimizes potential response bias to allow for extrapolation of results back to the original, EAT 2010 school-based sample.33,34 Weights for IPW were determined as the inverse of the estimated probability that an individual responded at both time points based on information provided at EAT 2010, including sociodemographic information, weight status, and frequency of dieting in the past year. In the weighted analytic sample, 53.1% identified as female, 46.3% identified as male, and 0.6% identified as another gender; 29.1% were Black/African American, 19.9% were Asian American, 18.8% were White, 17.0% were Hispanic/Latin*, and 15.2% were another ethnicity/race or mixed race/ethnicity; 39.9% had low household socioeconomic status (SES) at EAT 2010, 22.2% were low-middle SES, 17.9% middle SES, 13.1% high-middle SES, and 7.5% high SES (Table 1).
Sociodemographic Characteristics of Sample Statistics n = 1,568. a

Note. BMI = body mass index; SD = standard deviation.
All statistics but n, which represents observed count, are weighted to account for attrition over time and allow for extrapolation to the original population-based sample. Percentages may not add to 100 due to rounding.
Measures
The EAT 2018 survey was comprised of items from the EAT 2010 survey, as well as additional items to assess newly identified areas of interest and was pre-tested by 3 focus groups.35 -39 The test-retest reliability of the EAT 2018 measures was assessed in a subgroup of 112 emerging adult survey respondents within 3 weeks of completing the survey and test-retest statistics are reported below.
WRSM app use
To assess WRSM app use, an open-ended question was used: “Thinking about the mobile apps, tracker devices, and web-based programs you’ve used in the past year to help you manage your eating, activity or weight, please list up to 3 and tell us how often you currently use them.” Participants were able to list up to 3 apps and rated how often they used the app, “never,” “rarely,” “sometimes,” or “often.” Each reported app was dichotomized for any use in the past year. Listed apps were reviewed by a research staff member and coded based on the purpose of the app and tracking focus; a second member of the research team then reviewed the codes to ensure accuracy.40,41 Apps that automatically tracked physical activity (e.g., wearable devices) or were specific for physical activity/fitness were classified as physical activity-focused apps (e.g., Fitbit). Apps that tracked only diet or diet and physical activity, but with a primary focus on tracking diet (e.g., MyFitnessPal) were considered dietary-focused apps. Specific apps could only receive one code, but because participants could report more than one app, use of physical activity-focused and dietary-focused apps were not mutually exclusive. For example, MyFitnessPal would only be considered a dietary-focused app, but a participant could report use of both MyFitnessPal and Fitbit, and would therefore be considered both a physical activity- and dietary-focused app user.
Physical activity
Four types of physical activity were assessed: total physical activity, MVPA, practicing yoga, and compulsive exercise. Total amount of physical activity and MVPA were assessed using items taken from the Godin-Shephard Leisure-Time Exercise Questionnaire and modified to ask about strenuous, moderate, and light physical activity in a usual week. 42 Questions gave examples of types of exercise for each level of physical activity (e.g., jogging for strenuous, walking quickly for moderate, and walking slowly for light). Response options for each question ranged from “none” to “6+ hours a week.” Mid-points of each of the 6 response options were used to calculate the number of hours per week spent in each exercise intensity as has been done prior.39,43,44 Total hours of physical activity was the sum of all 3 intensities of physical activity (Test-retest r = .66) and MVPA included strenuous and moderate activity only (Test-retest r = .72).
Past year yoga engagement was assessed using 2 questions: (1) the yes/no question, “Did you do yoga over the past year?” (test-retest agreement = 89%) and (2) for those who responded “yes,” a follow-up question, “On average, how frequently did you do yoga over the past year?” Response options ranged from “less than ½ hours/week” to “10+ hours/week.” As has been done prior, we considered those who engaged in yoga at least 30 min/week on average over the last year to be regular yoga practicers.45,46 Yoga was assessed separately because of the evidence indicating that yoga may be more beneficial than other forms of exercise for things like mental health, balance, flexibility, and pain. 47
Compulsive exercise was measured using 3 items from the Obligatory Exercise Questionnaire, a validated and widely used measure of compulsive exercise 48 -51: (1) “When I miss a scheduled exercise session, I may feel tense, irritable, or depressed” (2) “If I feel I have overeaten I will try to make up for it by increasing the amount I exercise,” and (3) “When I don’t exercise, I feel guilty.” Response options included “1 = never,” “2 = sometimes,” “3 = usually,” and “4 = always.” A continuous measure was created with a scale 3 to 12, with higher numbers indicating higher levels of compulsive exercise (test-retest r = .81).
Screen time
Recreational screen time was assessed using the question, “How many hours of recreational screen time (eg, television, computer, social media, video games, smartphone or tablet) do you have a day? Do not include activities you do for work or school.”52 -55 Response options ranged from “0 hours a day” to “5+ hours a day.” The question was asked twice, once for the average weekday and once for the average weekend day. Mid-points of each of the 6 response options were used to calculate the number of hours per day of recreational screen time; the average weekday screen time was multiplied by 5 and summed with the average weekend day multiplied by 2 to calculate the average number of hours of recreational screen time per week (Test-retest r = .76). For example, if someone had a average of 3 hours of weekday screen time and 6 hours of weekend day screen time their average number of hours of recreational screen time would be (3 hours × 5 days) + (6 hours × 2 days), or 27 hours.
Social media was assessed using a measure adapted from prior research, “In the past week, on average, approximately how many total minutes per day have you spent using social media (e.g., Facebook, Twitter, Instagram, Reddit, Pinterest, or Snapchat)?” Seven response options ranged from, “I do not use social media” to “3+ hours per day.”56,57 Mid-points of each of the 7 response options were used to calculate the average amount of time on social media per week (Test-retest r = .69).
Viewing dieting/weight loss materials was assessed using a question modified from previous EAT studies, 58 “In the past month, how often did you spend time reading articles, websites, posts, or blogs in which dieting or weight loss are discussed? Please think about both online and print sources.” Response options included: “Never,” “A few times in the past month,” “Every week,” “A few times per week,” “Every day,” and “More than once a day.” Use was dichotomized to every week or more versus a few times in the past month to signify regular use (test-retest agreement = 71%).
Sociodemographic characteristics and other potential confounders
All sociodemographic covariates were assessed using self-reported measures. Structurally racialized categories, which are labeled ethnicity/race (test-retest agreement: 98%-100%), and SES (test-retest correlation, r = .90) were reported at EAT 2010. At EAT 2018, age was calculated by subtracting participant birthdate from date of survey completion (test-retest r = .99). Educational attainment (test-retest correlation, r = .91) and student status (test-retest agreement = 92%) were combined into a single variable representing educational/student status. Body mass index (BMI) was calculated using self-reported height and weight (test-retest r = .98). Neighborhood safety was included as a covariate because neighborhood safety is associated with physical activity levels in our sample. 44 Neighborhood safety was assessed using the following items from the Neighborhood Environment Walkability Scale,59,60 “The crime rate in my neighborhood makes it unsafe to go on walks during the day” and “The crime rate in my neighborhood makes it unsafe to go on walks at night.” A 4-point Likert response scale ranging from “strongly disagree” to “strongly agree” was used and responses were reverse coded (eg, “strongly agree” was coded as a 1) and summed (test-retest correlation, r = .82) to form a neighborhood safety score ranging from 2 to 8, which was treated as a continuous variable with higher scores indicating higher perceived neighborhood safety.
Statistical Analysis
Descriptive statistics were used to determine frequency and means for WRSM app use, physical activity, and screen time. To assess associations between WRSM app use and physical activity and screen time behaviors, we used linear regression models to calculate adjusted estimated means of total physical activity, MVPA, compulsive exercise, recreational screen time, and time spent using social media among users and non-users of physical activity-focused and dietary-focused WRSM apps. Logistic regressions were used to calculate adjusted prevalence of practicing yoga and viewing dieting/weight loss materials by WRSM app use. Adjusted means and prevalences are reported rather than effect estimates (odds ratios or betas) to increase interpretability of results and to facilitate comparing physical activity and screen time results to public health and clinical recommendations. All analyses are adjusted for gender, ethnicity/race, SES, age, and BMI, with additional adjustment for neighborhood safety in models with physical activity outcomes; adjusted means and prevalences were computed using marginal standardization. 61 Results were considered significant if P < .05. SAS 9.4 and STATA 16 were used to complete the statistical analyses.
Results
Descriptions of WRSM App Use, Physical Activity, and Screen Time
Among this population of emerging adults, 19.2% reported using a physical activity-focused WRSM app, and 8.8% reported using a dietary-focused WRSM app (Table 2). On average, participants reported 7.3 (standard deviation [SD] = 6.1) hours of total physical activity per week, including 4.4 hours (SD = 4.1) of MVPA. Approximately one-eighth of participants reported a regular yoga practice in the past year (12.7%). The average score for compulsive exercise was 5.6 (SD = 2.2; possible range: 3-12). Participants reported an average of 25.1 hours of recreational screen time per week (SD = 12.2) and reported spending 12.3 hours engaging with social media (SD = 9.1) in the past week. Approximately one-third (30.2%) reported viewing dieting/weight loss materials at least a few times per week in the past month.
Unadjusted Prevalence of WRSM App Use and Mean Levels of Physical Activity and Screen Time in Emerging Adulthood. a
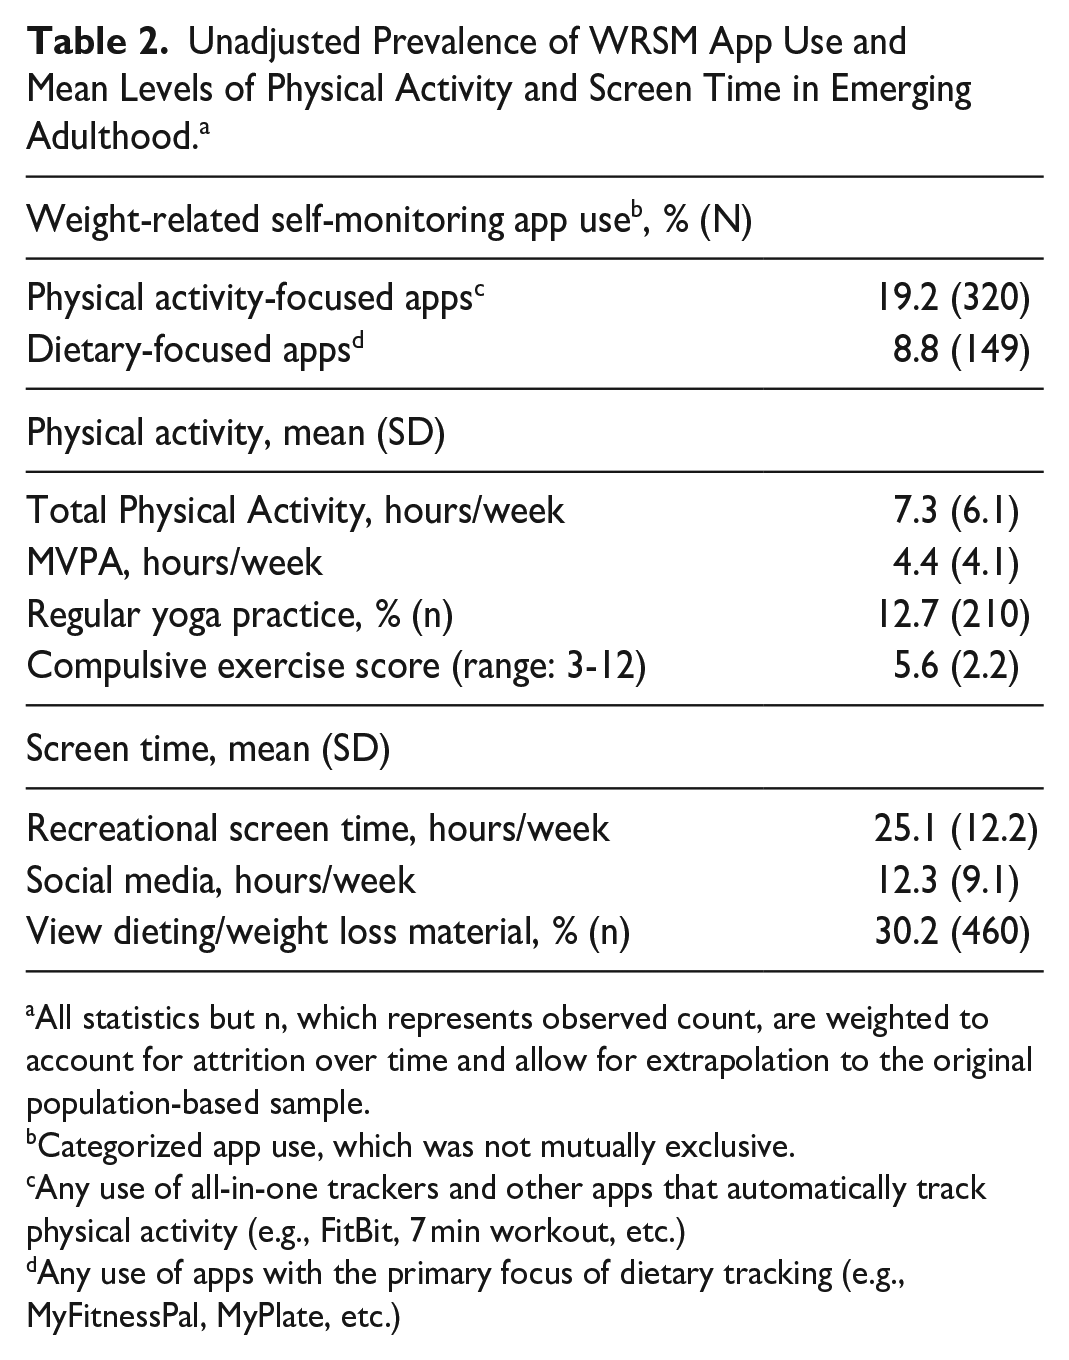
All statistics but n, which represents observed count, are weighted to account for attrition over time and allow for extrapolation to the original population-based sample.
Categorized app use, which was not mutually exclusive.
Any use of all-in-one trackers and other apps that automatically track physical activity (e.g., FitBit, 7 min workout, etc.)
Any use of apps with the primary focus of dietary tracking (e.g., MyFitnessPal, MyPlate, etc.)
Associations Between WRSM App Use and Physical Activity
Physical activity- and dietary-focused WRSM both exhibited strong associations with higher levels of all measured physical activity behaviors, including compulsive exercise (Table 3). In regression analyses adjusting for covariates, users of dietary-focused apps engaged in 1.5 more hours of total physical activity (P = .007), including 1.0 more hour of MVPA (P = .006) compared to non-users using adjusted means. Physical activity-focused app users also engaged in 1.5 more hours of total physical activity (P < .001), including 0.8 additional hours of MVPA (P = .002) compared to non-users using adjusted means. The adjusted prevalence of practicing yoga in the past year was approximately 15% for dietary-focused app users (16.0%) and physical activity-focused app users (15.4%), which was higher than the adjusted prevalence among non-users (11.7% and 12.1%, respectively), though these results were not statistically significant. The adjusted mean compulsive exercise score was also higher among both dietary- and physical-activity focused app users (P < .001) compared to non-users.
Adjusted Estimates of Physical Activity and Screen Time by Weight-Related Self-Monitoring App Use in Emerging Adulthood. a

All statistics are weighted to account for attrition over time and allow for extrapolation to the original population-based sample. All models adjust for gender, age, BMI, race/ethnicity, educational/student status, and SES; adjusted means and prevalences were computed using marginal standardization. Bold text indicates statistical significance of p≤.05, italicized text indicates p ≤.10.
Additionally adjusted for neighborhood safety.
Associations Between WRSM App Use and Screen Time
Physical activity- (P = .001) and dietary-focused app use (P < .001) both exhibited strong associations with viewing dieting/weight loss material, with WRSM app users more likely to view dieting/weight loss materials compared to non-users (Table 3). In regression analyses adjusting for covariates, physical activity-focused app use was marginally associated with more time spent on social media (adjusted mean of 13.3 hours for users, 12.1 hours for non-users, P = .052). There was no association between dietary-focused WRSM and social media time, nor was there an association between either form of WRSM apps and total recreational screen time.
Discussion
The present study aimed to examine the cross-sectional associations between WRSM app use and various forms of physical activity and screen time behaviors among a socioeconomically and ethnically/racially diverse population-based sample of emerging adults. We were also able to examine multiple forms of WRSM app use (i.e., physical activity- and dietary-focused WRSM), as well as an array of physical activity (i.e., MVPA, yoga, compulsive exercise) and screen time (i.e., social media, dieting/weight loss materials) behaviors among the high-risk group of emerging adults. Results indicate that both physical activity- and dietary-focused app use were associated with higher levels of total physical activity and MVPA. However, WRSM app use was also associated with higher levels of compulsive exercise and likelihood of regularly viewing dieting/weight loss media. There were no observed associations between either form of WRSM app use and yoga practice, or overall amount of recreational screen time. Existing interventions using WRSM apps to improve physical activity could utilize study findings to better tailor interventions to minimize related harms of compulsive exercise and viewing dieting or weight loss material, which we found to be prevalent among WRSM app users.
Previous research examining the relationship between WRSM app use and physical activity among non-clinical samples has primarily explored college students’ use of physical activity-focused WRSM apps. The present study expands upon this work by showing that in a population-based sample of emerging adults, both physical activity- and dietary-focused WRSM apps are positively associated with numerous forms of physical activity, including total physical activity and MVPA. It is possible that tracking other health behaviors, such as dietary intake, increases motivation for improving not only the behaviors being tracked, but also other related health behaviors, such as physical activity. However, it is also possible that emerging adults who choose to use WRSM apps have higher levels of physical activity prior to using WRSM apps because they are more health or appearance conscious and are motivated to use WRSM apps to sustain their already elevated levels of physical activity, rather than WRSM apps increasing physical activity levels. There also may be a more nuanced and bidirectional nature to the relationship, in that individuals who are more active to begin with are more likely to use the apps, but that the apps then further increase levels of physical activity. Further research is needed to parse out the likely nuanced temporality of the observed associations. In particular, using an ecological momentary assessment design may help parse out the directionality of association between WRSM and physical activity, as well as examine the role in which baseline interest or amount of physical activity moderates the associations.
To our knowledge, this is the first study to explore the relationships between WRSM app use and yoga practice, which could have significant public health implications. 62 We found that while WRSM app users had higher adjusted prevalences of yoga practice, these results were not statistically significant. Therefore, it may be that WRSM app users do not have broadly higher levels of physical activity, but instead the difference in reported physical activity levels are primarily driven by the types of physical activity monitored on WRSM apps, such as MVPA. Alternatively, if individuals are using WRSM apps to change their body shape/composition, they may be less likely to engage in types of physical activity that are more focused on mind-body connection, such as yoga, rather than weight/shape focused forms of exercise. Future work should examine whether promoting yoga to WRSM users may be beneficial, as prior work has shown that WRSM is associated with elevated eating disorder risk and that yoga may reduce eating disorder pathology.26,41,63,64 Therefore, future research would benefit from examining the motivations emerging adults have for using WRSM apps, and whether practicing yoga, with its focus on paying attention to internal signals, may be a viable intervention to decrease eating disorder risk among WRSM app users.
This study is also the first to our knowledge to examine associations between WRSM app use and various types of screen time behaviors, filling a critical gap in the literature. Although total recreational screen time did not differ among WRSM app users versus non-users, it is notable that both physical activity- and dietary-focused WRSM app users were more likely to view dieting/weight loss media and physical activity-focused WRSM users had marginally higher levels of time spent using social media. Meaning that although WRSM app users are not spending more overall time on screens in general, the material that they are viewing is likely more often social media and/or related to dieting/weight loss. Being exposed to more social media and/or dieting/weight loss material may underpin or reinforce harmful thought processes and behaviors. Notably, dieting/weight loss websites tend to promote the thin ideal, which can lead to increased body dissatisfaction, negative mood, and eating disorder symptomology. 65 Further, social media has been shown to be associated with increased risk of disordered eating. 66 Therefore, the increased likelihood of viewing dieting/weight loss may partially explain why WRSM app users have increased risk of disordered eating. It might be beneficial for health professionals working with individuals using WRSM apps to provide counseling on social media literacy and screen/monitor for disordered eating. 67
Also of concern, our findings suggest that both physical activity- and dietary-focused WRSM app use were associated with higher levels of compulsive exercise. It may be that individuals who are weight and shape concerned, and therefore more likely to engage in compulsive exercise, are more likely to use WRSM apps. However, similar to dieting/weight loss materials, it also may be that there are certain components of WRSM apps that increase likelihood of compulsive exercise. Specifically, users of dietary-focused WRSM apps have reported using physical activity to compensate for not meeting the dietary goals set by the app, which may lead to compulsive exercise through rumination.25,68,69 Future longitudinal work is needed to understand the temporality of the associations between WRSM app use and compulsive exercise, and if there are ways to reduce compulsive exercise in WRSM users. Therefore, among populations who use WRSM apps, it could be helpful for future interventions to screen for compulsive exercise and inform users of the potential harms of viewing dieting/weight loss-oriented materials, as both are common among WRSM app users.
Limitations
While we were able to examine a broad range of physical activity and screen time behaviors, including the use of items from validated measures to assess compulsive exercise, we were unable to examine other forms of physical activity that may be of interest (e.g., weightlifting or resistance training), which warrants future research. We also did not conduct an a priori power analysis specifically for the research question at hand, as it is a secondary data analysis of the larger EAT 2010-2018 study. Additionally, due to the cross-sectional design of our study, the temporality and causality of the relationship cannot be assessed. Future longitudinal and experimental studies should explore the likely complex temporal relationships between physical activity- and dietary-focused apps and changes in physical activity, including compulsive exercise, or the type of media viewed.
Conclusions
The study findings indicate that both physical activity- and dietary-focused WRSM apps are associated with greater amounts of physical activity in emerging adults, but also higher levels of compulsive exercise. WRSM app users also do not engage in more screen time, but the content of what they view may be more weight loss/dieting oriented. Future research is needed to understand the directionality of the relationships between WRSM and physical activity, including compulsive exercise, and explore motivations for WRSM app use. Until causality can be determined, clinicians should carefully weigh all potential implications, both positive and negative, when recommending WRSM app use.
Footnotes
Acknowledgements
There are no additional acknowledgments.
Declaration of Conflicting Interests
The author(s) declared no potential conflicts of interest with respect to the research, authorship, and/or publication of this article.
Funding
The author(s) disclosed receipt of the following financial support for the research, authorship, and/or publication of this article: This study was supported by the National Heart, Lung, and Blood Institute (Grant Numbers: R35HL139853 and R01HL127077, PI: D. Neumark-Sztainer). SLH and VMH’s time was partially funded by the National Institute of Mental Health (Grant Number: T32MH082761, PI: S. Crow & C. Peterson). ENK’s time was funded by the National Heart, Lung, and Blood Institute (Grant number: T32HL150452, PI: D. Neumark-Sztainer). The content is solely the responsibility of the authors and does not necessarily represent the official views of the National Heart, Lung, and Blood Institute, the National Institute of Mental Health, or the National Institutes of Health.
Ethics and Informed Consent Statement
The University of Minnesota Institutional Review Board Human Subjects Committee approved all study protocols (Approval: FWA00000312) on January 25, 2011. Participants completed written consent to participate in EAT 2018 and passive parental permission and assent was obtained in 2010.