
Abstract
Optimal quality of care remains an integral formal service along the continuum of care pathway. Patient satisfaction is an important health system responsiveness goal which has been shown to influence quality of care except in the indigenous settings. This study identified the determinants of patient satisfaction in the context of indigenous palliative care in Kenya. A descriptive cross-sectional study was conducted among cancer patients exiting indigenous care outlets located in 12 towns across Kenya using a structured modular questionnaire. Exit interviews were undertaken with 433 respondents leaving 193 mapped indigenous outlets. Overall services satisfaction was assessed as the dependent variable using a computed single-item satisfaction mean score. The data was analyzed using IBM Statistical Package for Social Sciences version 22. 0. Bivariate and multivariate analyses were conducted to identify the potential determinants. Against the 433 study respondents, 248 (57.3%) expressed overall satisfaction with indigenous palliative care services: Satisfaction was positively associated with waiting time (AOR = 2.663, 95% CI = 1.235-5.743), provider attention (AOR = 3.698, 95% CI = 1.657-8.254), provider politeness (AOR = 6.774, 95% CI = 3.697-12.413) and provider social communication skills (AOR = 6.520, 95% CI = 3.642-11.673). Good patient-provider interaction, provider social skills and service waiting time influence patient satisfaction with indigenous palliative care. The finding contributes to the understanding of indigenous palliative cancer care and provides scientific evidence for providers and policy makers to redesign and improve their service and outlet setting to provide patient centered holistic palliative care.
Patient satisfaction is an important health system responsiveness goal which has been shown to influence quality of care
The study identifies underexplored determinants of patient satisfaction in indigenous cancer palliative care services
The paper contributes to the orientation of indigenous cancer palliative care in Kenya and provides scientific evidence for providers and policy makers to improve service and outlet setting
Background
Patient satisfaction, defined as “a measure of how content a patient is with the health service they received from their health care provider,”1,2 is an important measure of healthcare quality.1,3,4 Patient satisfaction can therefore be used to detect challenges and identify client characteristics that appear to influence quality of service 5 as well as for successful management and improvement of service. 6 As a key consideration in government policy 2 patient satisfaction has been extensively studied worldwide with reportedly high scores in developed countries but low satisfaction indices in developing nations. 4 This is a key determinant of improving service value, delivery of patient-centered care and enhancing standards of healthcare in Africa.4,7 However, the underlying factors that precisely inform satisfaction among patients in local context, are mostly unidentified.8,9
In Kenya for instance, studies on satisfaction with indigenous palliative care services are limited yet over 70% of Kenyans rely on these services as their primary source of health care.8-10 The World Health Organization (WHO) defines palliative care as an approach that improves the quality of life of patients and their caregivers who are facing problems associated with life-threatening illness, preventing and alleviating physical, psychosocial or spiritual suffering.11,12 In Kenya, about 800 000 individuals are in need of palliative care every year resulting mostly from cancer, cerebrovascular diseases, dementia and respiratory diseases yet only 1.8% access these services. Access to acceptable and appropriate palliative care services remains a key priority.8,13,14 Whereas conventional palliative care is limited, indigenous point of care otherwise known as traditional medicine provides a hub for multifaceted palliative care in Kenya. An indigenous outlet is a service point that offers any service, or product, aiming to maintain, promote, prevent, and/or improve physical, psychological and mental wellbeing.
Kenya, like other countries in Sub-Saharan Africa is faced with an enormous burden of cancer. The number of patients with life threatening conditions who visit indigenous outlets for palliative care services has increased tremendously 10 in the wake of COVID-19 pandemic and the upsurge of non-communicable conditions. 15 Individuals affected by conditions such as cancer require patient centered care 16 adapted to cultural needs 8 and offered by multiple providers. To gain insight on how patients with life-threatening illnesses in need of palliative care experience indigenous palliative care quality, it is important to ask the individuals in question. 17 The high proportion of patients visiting indigenous outlets suggests that patients receive care based on certain qualities. Whether the services meet the patient’s satisfaction score and conform to the WHO definition of palliative care12,17,18 is yet to be ascertained. Additionally, results of these visits and the determinants of patient satisfaction are unreported (8). 4 The WHO provides a holistic definition of health to be “a state of complete physical, mental, and social well-being and not merely the absence of disease or infirmity.” 4 A framework based on this holistic definition,5,17 advances that patient satisfaction can be examined through broader perspectives of population, individual, structure, process and outcome of care. 5 The holistic approach not only assesses satisfaction with service delivered, but also provides reflection on structure and function of the health system, to include provider attributes of emotion and intellect, social skills, and general views of health, leading to discovery of unmet client needs. 7 The present study contextualized these issues to Kenya’s indigenous care systems to identify the determinants of patient satisfaction.
Materials and Methods
Design and Study Setting
A descriptive cross-sectional study was undertaken among patients exiting indigenous outlets using pretested, semi-structured questionnaires. Indigenous health practitioner outlets included homesteads and stand-alone clinics located in 12 major towns: Mombasa, Nairobi, Kisumu, Nakuru, Kericho, Nyeri, Thika, Machakos, Kakamega, Kisii, Eldoret, and Meru. The selected outlets were visited, consented and client exit interviews undertaken during the survey period of October to December 2019.
Sample Size
The sample size was calculated using the Krejcie and Morgan Minimum stratified sample sizes for all samples Formula, 1970. 19 A 50% (proportion of interest) was applied as most conservative sample size estimate with 5% to account for non-response, since the proportion of population that had the specific characteristic of interest was unavailable. This provided a sample size of 433.
Sampling
Indigenous palliative cancer care service providers were mapped and screened across urban and select rural areas of Kenya. Only clients whose providers had consented and allowed their clients to participate in the study were invited to participate. For practitioners with satellite clinics in other towns, exit interviews were scheduled in accordance the practitioner’s availability. This scenario informed the proportionate distribution of the sample size and skewed dates to particular outlets. To mitigate and broaden the base of the data, the sample was distributed per ecological region and client load proportionately. Exit interviews were conducted with cancer patients leaving the indigenous outlets and/or adult caregivers on behalf of the patient.
Sampling Procedure
On fieldwork days client exit interviews were undertaken using consecutive sampling. All patients exiting indigenous outlet service areas were invited to participate in the study. A screener helped to filter respondents with bias to cancer patients/caregivers above the age of 18, ambulatory, and consenting to participate in the research. Non cancer, unwilling, unstable and referred cases were excluded. These exclusion criteria were designed to simplify data collection, analysis and interpretation, and to respect the rights of patients who needed urgent referral.
Data Collection Tool
Data collection tool was a pretested, structured modular questionnaire prepared in English and translated into Kiswahili, and administered by trained research assistants. Modules included screening and consent, client demographics, satisfaction with provider attributes and service domains. Satisfaction is measured in different ways since it is grounded in diverse behavioral theories. Often, it is measured as an overall evaluation score and at times for specific aspects of care. In this study, satisfaction focused on 2 domains; provider attributes and service point domain. This model was adopted and modified from a study focusing on organizational factors and personal characteristics that affect job satisfaction among health care providers in sub-Saharan Africa. 20 The satisfaction scores were then aligned to the structure (outlet factors), process (patient- provide interaction), as per Donabedian’s conceptualization of patient satisfaction and patient characteristics to render a more holistic conception of patient satisfaction. 21 The parameters in the provider attributes were provider attention, politeness (empathy), friendliness (trustworthy), communication, responsiveness, social skills and revisit likelihood (dependability). For service point domain, parameters included outlet cleanliness, waiting time, cost of services, privacy, perceived benefits and outlet ambiance. Majority of the items were assessed using a 5- or 3-point Likert scale, with a few binary questions. All the parameters were transformed into 2-point Likert scale of 1- dissatisfied and 2- satisfied. Overall service satisfaction was assessed as the dependent variable using a computed single-item satisfaction mean as the cut off. Scores above the mean represented satisfaction and dissatisfaction for those below the mean as applied in a study in Nigeria. 20
Validity and Reliability
Content and concurrent validity were undertaken using Delphi and Cronbach’s alpha technique. Delphi entailed structured interaction among a group of experts on the subject to elicit and refine judgments to build consensus that study instruments would give reliable results. 9 The experts were from the fields of ethnobotany, health systems management, indigenous knowledge, culture, ethnography, pharmacy and nursing. The process included numerical iterations, consensus, confirmed dissensus, and stability of results. To achieve reliability, Cronbach’s alpha was calculated and Cronbach’s average alpha reliability coefficient for the instrument was .710.
Ethical Approval
The study was approved by the Kenyatta National Hospital- University of Nairobi University Ethics and Research committee (KNH-UoN ERC) reference KNH-ERC/A/319. Study protocol permit was issued by National Commission for Science, Technology and Innovation (NACOSTI), under permit -NACOSTI/P/18/41197/24208. Authorization to access clients exiting facilities was sought from THPs in charge of the facility. Clients or their caregivers were invited to participate and those who voluntarily provided informed consent by signing the consent form were interviewed. Research assistants who administered the questionnaire were trained on human research ethics and interviewing skills prior to commencement of the study.
Data Analysis
Before analysis, the data was validated for completeness and accuracy. And the data was then de-identified prior to data entry, analysis and reporting. The data was analyzed using IBM Statistical Package for Social Sciences (SPSS, Inc., Apache Software Foundation, Chicago, IL, USA) version 22. 0. The results are presented in frequency tables, pie charts and bar graphs. An initial bivariate analysis (chi-square) involving the single–item overall service satisfaction of respondents and each variable was carried out. Respondent characteristics, provider attributes and service point attributes that were significantly associated with the overall service satisfaction of respondents were selected and subjected to a binary logistic regression analysis. A 2-tailed P < .05 was considered statistically significant.
Results
Demographic Characteristics
Four hundred eighty-two clients exiting the indigenous outlets were screened but 441 (91.5%) were interviewed. The rest had either been referred, were too ill or declined to consent. Against the 441 returns, 8 questionnaires were incomplete and therefore excluded from analysis. Two fifty-eight (59.6%) of participants were female and 175 (40.4%) males. Their ages ranged from 18 to 93 years, with a mean age of 48.25 ± 15.58 years and median age of 50.5 years. Majority of respondents were Christians 421 (97.2%), married 389 (89.8%), and educated 371 (85.7%). The main source of income was farming 309 (71.4%) whilst 21.9% and 6.7% relied on business and employment respectively. The dominant tribes were Kalenjin 188 (43.4%), Luhya 91 (21.0%), Kikuyu 65 (15.0%), Kamba 30 (6.9%) and Gusii 18 (4.2%). One hundred eighty-two respondents (42.0%) had traveled for more than 3 hours to reach the outlet. The major means of transport was vehicle 252 (58.2%), followed by foot 107 (24.7%). Duration of illness ranged from less than 1 year to more than 7 years (Table 1).
Socio-Demographic Characteristics and Medical History of Respondents.

From the bivariate analysis of socio-demographic characteristics and overall services satisfaction of the respondents, more than half of respondents 248 (57.3%) expressed overall satisfaction with services (Table 2). However, age, gender, marital status, main source of income, religion, time taken to reach the outlet, disease diagnosis and type of cancer were not significantly associated with client satisfaction (>0.05). Whereas the approach of disease diagnosis was not significant, 66.1% of those diagnosed by indigenous practitioners were satisfied compared to 56.1% of those diagnosed by medical practitioners. Satisfaction score was also high among respondents suffering from colon/stomach (100%), cervical/ovarian (70.8%), blood/bone/brain (66.7%), liver/lung/kidney (64.3%) and uterine cancer (64.3%). Respondents suffering from prostate and throat/mouth recorded low results of 48.2% and 47.8% respectively.
Association Between Personal Characteristics and Overall Service Satisfaction of Respondents.

Only education level (P = .001), ethnicity (P = .033), means of transport (P = .011) and period of illness (P = .003) were significantly associated with overall services satisfaction. Forty-seven (75.8%) of the respondents who had not attended any school and 26 (70.3%) who had tertiary level of education were satisfied with the provided services. There was no difference among respondents with primary and secondary levels of education. Likewise, respondents speaking Bantu (Kamba, Kikuyu, Luhya, Kisii, Mijikenda and Aembu/Meru) were more likely to have overall services satisfaction (62.3%) compared to those of Nilotic (Teso, Kalenjin, Masaai and Luo) origin at 51.1%. When cascaded into tribes; Luhya led in satisfaction at 79.1%, followed by Maasai (75.0%), then Aembu/Meru 70%, Luo 69.2%, Kisii (66.7%) and Kamba 60.0%. The satisfaction score was indifferent among the Mijikenda (50%) and Kalenjin (49.5%). However, the least satisfaction score was recorded among the Kikuyu at 38.5%. Respondents who had been ill for greater than 7 years tended to be more satisfied 54 (77.1%) than those who were sick for lesser years. Twenty-four (72.7%) of the respondents who traveled to the outlet by bicycle were satisfied. This is higher than 50.5% who had traveled by vehicle. Those who traveled by motorbike and foot recorded similar results of 63.4% and 65.4% respectively.
Association Between Satisfaction With Provider Domain Attributes and Overall Services Satisfaction of Respondents
Understanding customer expectations informs the quality of services. The study findings suggest that received services met expectations for 272 (62.8%) respondents. Eighty (18.5%) said it exceeded expectation and 45 (10.4%) reported that it met expectation partially. However, a few were in the extremes. Twenty (4.6%) said the services did not meet their expectations while 16 others (3.7%) felt the received services exceeded expectations. Majority of the respondents 419 (96.8%) felt the provider gave them a good opportunity to clarify issues and 423 (97.7%) felt the provider addressed their concerns during the visit satisfactorily as described in Figure 1. The average waiting time for consultation was 30 min and a majority 316 (73%) found this waiting to be acceptable. While 75 (17.3%) said it was quicker than expected. Nevertheless 36 (8.3%) said it was long while 6 (1.4%) reported as much too long. Time spent with the physician is a stronger predictor of patient satisfaction than is the time spent in the waiting room. Table 3 illustrates the association between satisfaction with provider domain attributes and overall services satisfaction of respondents. Satisfaction with provider attention (P < .001), satisfaction with provider politeness (P < .001), satisfaction with provided information on condition by provider (P < .001), respondents likelihood to re-visit outlet for medication (P = .001) and patient willingness to recommend the services to a friend (P = .012), were significantly associated with overall service satisfaction. Conversely, satisfaction with practitioners’ response to raised concerns (P = .273) was not significantly associated with overall service satisfaction of respondents. In other words, discontented respondents scored 30% on overall satisfaction compared to 57.9% for the contented cohort.

Respondent perception on received services.
Association Between Satisfaction With Provider Domain Attributes and Overall Services Satisfaction of Respondents.

Association Between Satisfaction With Services Domains and Overall Service Satisfaction of Respondents
The total length of time spent with the provider was deemed acceptable by 314 (72.5%) whereas 81 (18.7%) considered it be quicker than expected and less than 10% felt it was too long. Cost of services was reported as very cheap by 313 (72.3%) while 50 respondents (11.5%) described it as cheap. The rest 16.2% were of a different opinion or expensive. The service area was reported as clean by 300 (69.3%) respondents while 123 (28.4%) documented it as very clean. However, 3 (0.7%) and 7 (1.6%) reported as dirty and very dirty respectively. Three hundred sixty-seven (84.8%) respondents reported that privacy was adequately provided throughout the consultation period. Fifty-six respondents (12.9%) reported some privacy and 10 (2.3%) documented no privacy at all. Two hundred eighty (64.7%) found the provider to be very polite and 91 (21%) polite. However, 7 (1.6%) found the provider to be impolite and 2 (0.5%) very impolite. A significant 53 (12.2%) were indifferent.
In general, 139 (32.1%) and 166 (38.3%) were very satisfied and satisfied with the received services respectively. Eighty-eight (20.3%) were indifferent, while 27 (6.2%) and 13 (3.0%) were dissatisfied and very dissatisfied correspondingly. Satisfaction indicated good experience since 258 (59.6%) and 134 (30.9%) reported that they are very likely and likely to come back for the services. Whereas 22 (5.1%) were indifferent 15 (3.5%) and 4 (0.9%) said they are unlikely and very unlikely to revisit separately. The confidence in the services was inferred as high since 413 (95.4%) agreed that they would recommend the services to another person with a similar condition. Table 4. Illustrates the association between satisfaction with services domains and overall service satisfaction of respondents. Satisfaction with provider attention (P < .001), clients who felt that services service meet expectation (P < .048), satisfaction with waiting time (P < .001), satisfaction with cost of services (P = .006), satisfaction with outlet cleanliness (P = .006), satisfaction with received privacy(P = .001) satisfaction with provided information on condition (P < .001) and respondent who belief that herbal is the only suffice to cure (P < .001) were significantly associated with overall service satisfaction. Conversely, satisfaction with opportunity to clarify issues (P = .106) was not significantly associated with overall service satisfaction of respondents. Only 42% of the respondents who were satisfied with the opportunity to clarify issues were not associated with overall satisfaction compared to 64.3% who were not pleased.
Association Between Satisfaction With Services Domains and Overall Service Satisfaction of Respondents.

Binary Logistic Regression Model of Overall Service Satisfaction of Respondents
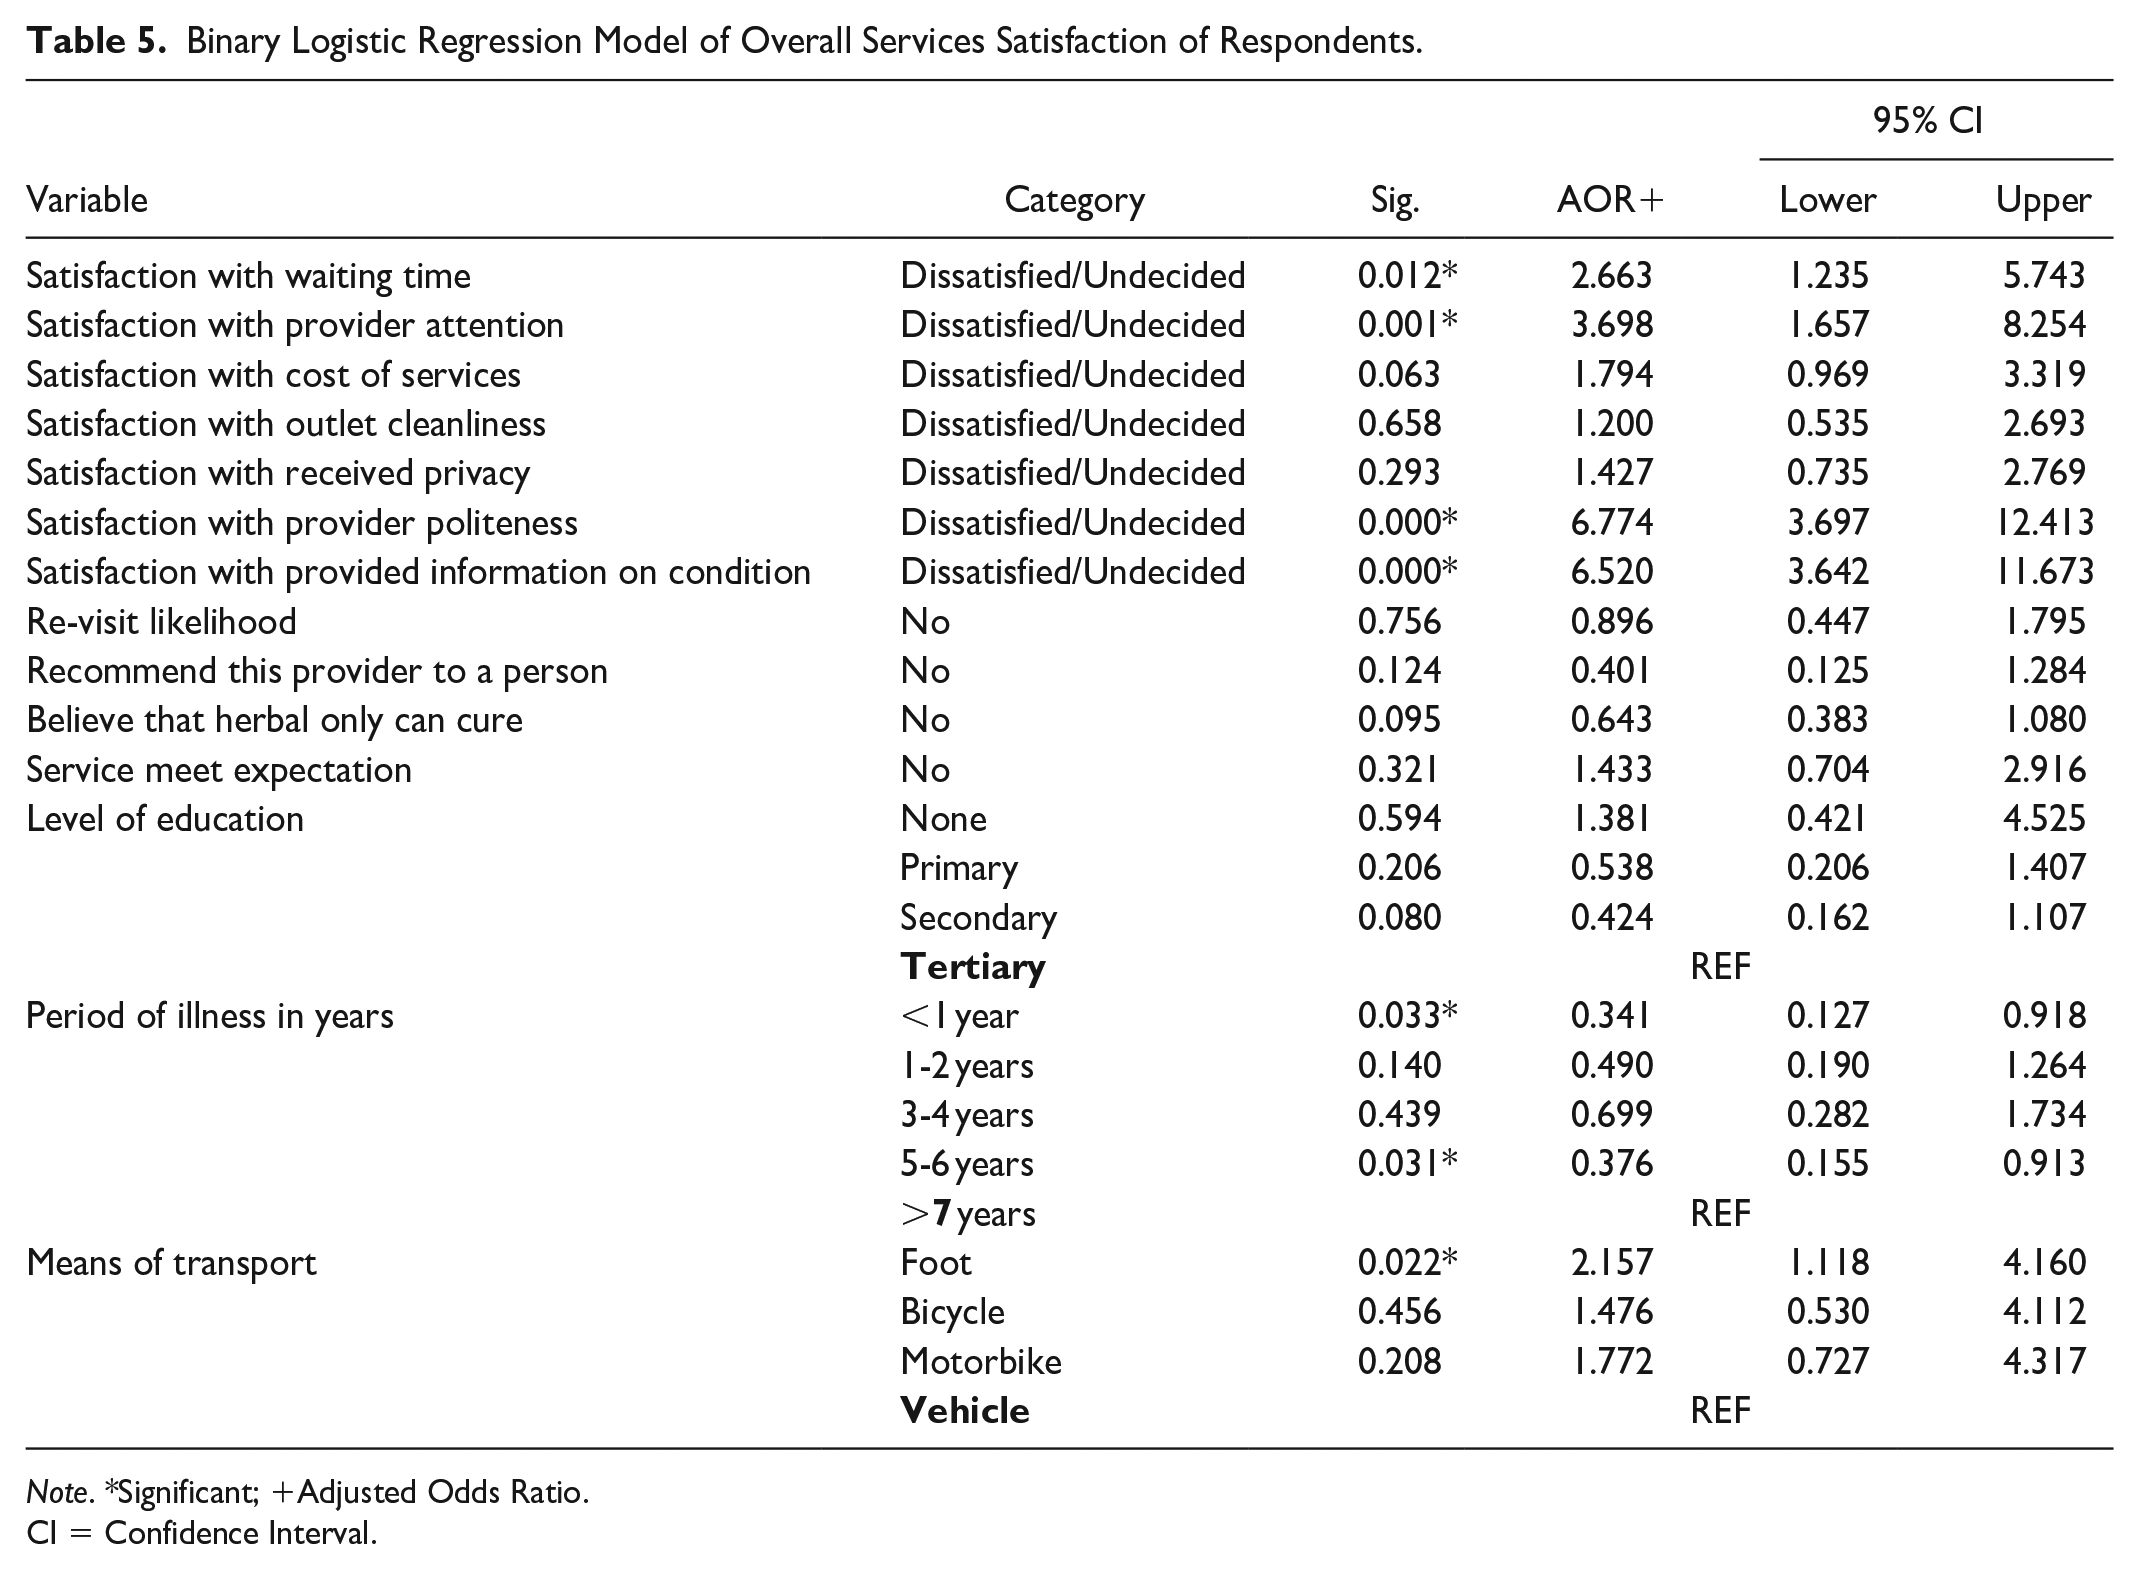
The binary logistic regression model was significantly reliable (Omnibus test χ2 = 179.790 (11), P < .001) and could correctly predict 77.8% of clients who were satisfied with services received (Table 5). Waiting time (AOR = 2.663, 95% CI = 1.235-5.743), provider attention (AOR = 3.698, 95% CI = 1.657-8.254), provider politeness (AOR = 6.774, 95% CI = 3.697-12.413) and information (AOR = 6.520, 95% CI = 3.642-11.673) were independently associated with overall services satisfaction of respondents. For categorical variables, respondents who walked to the outlet were twice (AOR = 2.157, 95% CI = 1.118-4.160), as likely to have overall service satisfaction unlike respondents who had traveled by vehicle. Furthermore, respondents who had been unwell for less than 1 year and more than 5 years were about 34% and 37%, respectively, as likely to have overall services satisfaction as a respondent who had been unwell for more than 7 years.
Binary Logistic Regression Model of Overall Services Satisfaction of Respondents.
Note. *Significant; +Adjusted Odds Ratio.
CI = Confidence Interval.
Discussion
Many studies of this nature involve small numbers of participants however the sample size and response rate for our survey was high hence giving a face validity to the finding that contributes to patients’ perspectives to existing data on satisfaction and adds a unique dimension from indigenous cancer care in Kenya. We found that people with all types of cancers exceedingly patronize indigenous palliative cancer care outlets. The findings fit well with other publications, which have found that a good proportion of people with cancer are likely to be taking traditional medicines.22,23 We also found that a substantial number of respondents were generally quite satisfied with received indigenous palliative services but the pedigree varied with type of cancer.
The result supports a previous study which characterized perceived satisfaction score with person-related conditions. 17 Whereas all the other cancer cases reported high scores, patients suffering from throat, mouth and prostate reported low scores. Research to explain further the complexity behind this finding is warranted, however it is our hypothesis that patients with prostate and throat cancer have lost their self-functional physiology of swallowing and urinating. This may be due to fibrosis and enlargement of the prostate gland hence their care needs are urgent and satisfactory only when the biological function of swallowing and urinating are restored. In common with other studies11,22,23 our finding indicates that indigenous healing has a significant role to play in contemporary society.
The study revealed that demographic variables such as patient’s education level, ethnicity, means of transport and period of illness have major impact on patient’s satisfaction scores and by extension perceived quality of care. The results are consistent with Carlin et al who reported that highly educated patients are less satisfied. 24 It is sufficient to report that the previous study was hospital-based suggesting that the influence of personal attributes in human health and wellness seeking behavior is similar across formal and in formal health care settings. This result alludes that those providers seeking to improve their patient satisfaction scores could do so by considering patient characteristics when readjusting health systems pillars. These results further suggest that choice of transport is key to satisfaction. Respondents who walked, cycled or rode a bike to the outlet had higher satisfaction scores than people who drove. Means of transport and period of illness independently predicted overall services satisfaction. Those who walked to indigenous outlets were 2 times as likely to have overall service satisfaction than those who used a vehicle. Traveling without straining may play a stabilizing role on patient rating of satisfaction. One year and 5 years of being unwell had a 34% and 37% chance of being satisfied than those who had been sick for over 7 years. One possible explanation for this result is that the available transport modes vary in Kenya. Nevertheless, it is well documented that the choice of transport mode is affected by the money availability, means, health and weather. 25 It is also possible that respondents who drove were of high economic social status consequently had alternative high expectations. Bantus had higher overall satisfaction scores than Nilotes. Luhya, and Maasai had the highest satisfaction while the Kikuyus had the lowest. The impact of exposure against cultural endowment may explain this finding. Maasai is one of the very few tribes in Kenya, who have retained most of their traditions, lifestyle and lore while the Kikuyu have made significant strides in civilization consistent with their degree of exposure, growth and development. The Luhya’s on the other hand, are renowned for a rich culture of herbalism. 26
The present study also found that satisfaction scores increased with the period of illness. It is well documented that cancer patients experience considerable psychological distress and physical pain associated with the disease and its treatment.28,29 This may be attributed to illness burden and it is then plausible that after a very long period of pain, stress and mental torture, the emotional support received from indigenous palliative care provider improves their self-esteem, reduce feelings of uncertainty, and, contributes to improved quality of life resulting in satisfaction. The finding is consistent with previous research which stated that patients with a long history of chronic illnesses report higher overall satisfaction. 24 Nevertheless, not all demographic variables were associated with high satisfaction scores. The variables included age, gender, marital status, main source of income, religion, time to reach the outlet, diagnosis approach and type of cancer. The demographics result is mixed and reflects a harmony with the available literature.27-29 Ayranci et al found age and marital status to affect patient satisfaction but not gender, and education level. 28 For Farrokhi et al., age, marital status and residential area were the most important demographic determinants of patient satisfaction. 29 While Adhikari et al associated age, gender and ethnicity with general satisfaction of the patients but not education, occupation, and religion. 27 The non-homogeneity of these results suggest that social determinants of health vary in sub groups and settings. Our study reveals that period of illness and ethnicity are key primary influencers to patient satisfaction.
The study findings suggest that indigenous providers were polite and friendly. Providers empathized, communicated well and provided ample opportunity and time to relate and answer questions. These provider attributes contribute the evidence that open attitude, empathy, communication and unconditional care skills are key dimensions of physician competence for satisfactions and patient centered services. This finding is comparable with findings of King and Hoppe that supports the importance of openness in communication as ways of unearthing and meeting informational and emotional needs of patients. 30 These attributes are critical in-patient motivation and recovery and the finding present opportunities for in-cooperating these good attributes into provider training. Our findings also present opportunities for reflection on conscious use of good communication strategies as a management tool in the outlets. A position well explained by predella who writes that clinician’s ability to explain, listen and empathize can have a profound effect on biological and functional health outcomes as well as patient satisfaction and experience of care. 31 Waiting time was also friendly. This finding agrees with available literature that sociable waiting time plays an important role in the process of quality assurance and loyalty in services.32,33
Satisfaction with provider attention, politeness and communication, respondent’s likelihood to re-visit and willingness to recommend the services to a friend were significantly associated with overall service. The result of this study is harmonious with Ayranci and Atalay who writes that courteousness and caring, informing, meaningful communication, and professional recommendations are important provider domains to patient satisfaction. 28 Hence, integrating these attributes in health education and cultural competence training is paramount. The study finding enriches the encyclopedia of publications that champion the proposition that friendly socioemotional exchanges between provider and clients such as addressing the patient’s main concerns contribute to improved health outcomes. 30 In the model of overall service satisfaction attention, politeness and communication were independently associated with overall service satisfaction. Respondents satisfied with provider attention were 3 times as likely to have overall service satisfaction. Equally, respondents who were satisfied with provider politeness and communication respectively were about 7 times as likely to have overall service satisfaction. The benefits of higher patient satisfaction, adequate provider attention and interaction through gestures, body language, facial expressions, eye contact, dressing, tone of voice, and other cues to convey a message are well documented. 31 Predila reported that good patient-provider interaction and satisfaction will improve diagnostic accuracy, reduce risk of human errors and increase the chances of patients having a positive experience. We add that it also affects the condition of prognosis and plays a significant role in social marketing, an area important in uptake and utilization of service and product respectively. The finding therefore, offers timely scientific evidence to define what should be taught for effective palliative care and interpersonal communication strategies.
Service expectations of the respondents were reportedly met. This may be due to the fact that Indigenous providers were reported to be friendly and interacted freely with patients therefore synchronized well. High expectation results have been reported.28,32 In addition, the outlets were clean and privacy was adequately provided. This may have imbibed self-belief, self-assurance and confidence in the respondents, a hypothesis validated by the respondent’s desire to revisit as well as recommend the services to friends with similar conditions. Satisfaction with waiting time, cost of services, outlet cleanliness, accorded privacy and respondent belief that herbal only regimen is sufficient to manage cancer were significantly associated with overall service satisfaction. However, in the binary logistic regression models of overall services satisfaction, only satisfaction with waiting time was independently associated with overall services satisfaction of respondents. Respondents satisfied with waiting time were twice as likely to have overall service satisfaction unlike unsatisfied. Our finding agrees with the statement that facility context, such as proper layout, guidance, proper timing, parking, and hygiene are important factors in patient satisfaction to services 28 Previous studies conducted to assess patient satisfaction levels but in conventional facilities showed similar results of satisfaction with the level of patient privacy and waiting time but the result of satisfaction with cost of services was converse.2,34,35 It is important to point out that most indigenous services were pro bono or paid in kind, which may explain the satisfaction with cost of service in this study.
Study Limitation
This study provides the context of satisfaction score with respect to provider and service domain in palliative care. A limitation of this study might be that outlet staff were aware of the interviewer’s presences. The well-documented Hawthorne effect may positively bias providers’ actions but the large sample size minimized this bias. Furthermore, some of the patients and/or caregivers were in a palliative phase and could be anxious to return home, such respondents were excluded. It is important to report that indigenous outlets are unique and mostly a one man’s show with one compartment compared to complexity of departments or multiplicity of roles of health workers in hospitals. Interpretation of these results and generalization must be done therefore with caution.
Conclusion
The study’s findings highlight the influence of personal attributes in patient’s satisfaction scores. Provider social skills, responsiveness, courteousness and empathy, politeness, communication and connectedness are important characteristics to patient satisfaction score. Therefore, integrating these attributes into training and health education programs for providers who care for patients with life-threatening illness is paramount. Layout, cleanliness, and availed privacy were important outlet-related factors for patient satisfaction and were significantly associated with overall service satisfaction. Policy makers and providers may use the evidence to redesign and improve their service to include integration of indigenous palliative services with other disciplines of care, in alignment with standard medical practice.
Footnotes
Acknowledgements
The authors are grateful to the respondents for participating in the study. Sincere gratitude goes to the executive (traditional health practitioners) of the outlets for permitting interviews and the Ministry of culture Kenya for linking the study team with the organizations and their members. We also appreciate NACOSTI Kenya for permitting the study and National Museums of Kenya (NMK) management for their infrastructural support.
Authors’ Contribution
Solomon Kemoi Cheboi (SKC) conceptualized the idea, processed the write up, collected the data, and analyzed the data while Daisy N. Nyawira (DNN), Peter M. Ngolo (PMN) and Wanjiru S. Ng’ang’a (WSN) contributed equally in the project design, data and provided technical and critical revision and review of the reports.
Data Availability
The data that support the findings of this study are available from the corresponding author.
Declaration of Conflicting Interests
The author(s) declared no potential conflicts of interest with respect to the research, authorship, and/or publication of this article.
Funding
The author(s) disclosed receipt of the following financial support for the research, authorship, and/or publication of this article: We are grateful to National Research Fund (NRF), Kenya for funding the research.
Disclaimer
The views and opinions expressed in this article are those of the respondents and authors and do not reflect the official policy or position of any affiliated agency of the authors.
Consent for Publication
N/A
Ethics Approval and Consent to Participate
All willing indigenous care providers participating in the study were informed of the study protocol and approved their clients to be interviewed. An ethical approval was obtained from Kenyatta National hospital-University of Nairobi University-Ethics and Research Committee KNH-ERC/A/319 and permit from National Commission for Science, Technology and Innovation, Kenya-NACOSTI/P/18/41197/24208. Prior informed consent form was administered to each respondent. Research assistants were trained on principles of research involving human subjects, purpose of the study and research ethics. Confidentiality was maintained throughout the study. Non-eligible clients were disengaged and informed of the reasons. Pilot was undertaken in Nairobi, to determine the feasibility of the methods and tools. Quality control was undertaken throughout the study period. In principle, all study participants observed general ethical principles of respect for persons, beneficence and justice.