
Abstract
In China, most ambulatory care is provided by public hospitals. However, many public hospitals’ outpatient services fall short of meeting patients’ demands. This study aimed to assess the quality gap of outpatient service in public hospitals by using an indicator system developed based on the SERVQUAL model. This cross-sectional study was conducted from June to July 2019 at 13 public hospitals in Shenzhen. In total, 1876 outpatients were included in the study, and participants were asked to fill out the modified SERVQUAL questionnaire. The scale consists of 23 items scattered in 6 dimensions, including Safety, Reliability, Responsiveness, Tangibles, Assurance, and Empathy. Descriptive analysis, t-test or F-test, and optimal scale analysis were performed. The patients’ expectation of outpatient services exceeded the hospitals’ services they perceived and resulted in negative gaps between the mean expectation and perception scores for each indicator. The gaps were as follows: Reliability = Empathy > Responsiveness > Safety > Assurance > Tangibles. Quality gaps differed significantly between age, education, and hospital type. The overall impression mean scores are 7.45 ± 1.18 (out of 9 points) and 7.27 ± 1.23 for general and specialized hospitals. And the willingness to recommend the hospital to others mean scores are 4.06 ± 0.62 (out of 5 points) and 3.92 ± 0.65 for general and specialized hospitals. Patients’ impression of the hospital and willingness to recommend the hospital were significantly correlated with age, citizenship, health insurance, referral type, frequency of visits, Safety, Tangibles, Reliability, and Assurance. The outpatient service provided by Shenzhen’s public hospitals did not meet patients’ needs. Hospital administrators should evaluate the quality gap of outpatient services to identify the flaws within the delivery of ambulatory care and make improvements according to the findings to drive patient-centered care.
Ambulatory care in China has service challenges in the outpatient departments of large hospitals. Quality measurement from patients’ perspective is important for the improvement of healthcare. SERVQUAL model has been widely used in the healthcare settings of developing countries and fits for adaptation into China and evaluation of the quality gap of health services.
Our research assessed the quality gap of outpatient services through patient expectation and perception and figured out the differences between patient groups and the correlation to patient loyalty in public hospitals in Shenzhen, China.
This study finds that the expectation of outpatients exceeded the hospitals’ services they perceived, and resulted in negative gaps between the expected mean score and the perceived mean score for all indicators, implying that the public hospitals’ outpatient service in Shenzhen did not meet patients’ needs. The findings are also useful for the evaluation of outpatient services of specific departments or diseases or other hospitals.
Introduction
Ambulatory care is critical in China’s healthcare system and public hospitals are the primary destination domestic outpatients seeking healthcare. In 2021, 3.88 billion outpatient visits happened in Chinese hospitals, and public hospitals handled 84.22% of all these visits (3.27 billion). 1 Overcrowding in public hospitals, especially in large tertiary hospitals, has raised issues such as heavy workload for care providers and long waiting time for outpatients, and has harmed the doctor-patient relationship and decreased the experiences of both sides, which affects far too many Chinese citizens and is a big source of concern.2-5
Patient satisfaction measurement has been commonly performed around the world to know outpatients’ views on service quality and then referred to improve ambulatory care (America: Consumer Assessment of Healthcare Providers and Systems, 1995; Australia: Patient Experiences Survey, 2010; Britain: Public Satisfaction with National Health Service, 2011).6-8 Comparatively, China’s move is a little late but put lots of effort into it. From 2015 to 2020, China implemented the National Healthcare Improvement Initiative (NHII) to facilitate a quality patient experience in healthcare. The NHII used the Chinese Patient Experience Questionnaire (CPEQ) as the survey instrument, and when it ended in 2020, the survey found that outpatient satisfaction has increased, and the unsatisfaction is mainly related to functional quality, which refers to how patients get the care. 9 In 2019, China began performance appraisal for tertiary public hospitals and included outpatient satisfaction in the indicator system. 10 The Outpatient Satisfaction Questionnaire (OPSQ) was developed to generate patient-reported satisfaction. The two reforms allow regulatory bodies to know the comparative performance of hospitals across the country and give external impetus to hospitals to promote service. However, 136 tertiary hospitals in 31 provinces participated in the NHII survey, and totally 2706 tertiary public hospitals were appraised in 2021. For individual hospital managers, apart from a general patient satisfaction score and rankings among hundreds of hospital with highly heterogeneous healthcare, to obtain enough details on where and why patients report low satisfaction with their outpatient service and to take effective and efficient improvement measures, they must conduct additional research using questionnaire customized for their social-economic background, hospital type and health services. 11
The SERVQUAL model was established by Zeithaml, Parasuraman, and Berry in 1988 as a method to measure the gap between what customers expect of service quality and what an organization actually offers.12,13 The model, which was first designed for business, has now been adopted for use in healthcare settings and has emerged as the most commonly used instrument in developing countries to assess patient-perceived service quality.14-16 In comparison to the existing self-established questionnaires now in use in China, this scale has a number of advantages. First, the SERVQUAL model’s first-level components encompass the elements of outpatient experience that are most often studied.15,17,18 For example, the layout of service functions, environment maintenance, process management, quality of care, humane care and the patient-doctor relationship are the main determinants of outpatient satisfaction in China and are included in the CPEQ primary index. 19 And pre-diagnosis, treatment, auxiliary examination, drug withdrawal, environment, and logistics service are the primary indicators of OPSQ and follow the workflow of ambulatory care. 11 The SERQVUAL scale, comparatively, comprises 22 items under 5 first-level dimensions, including tangibles, reliability, responsiveness, assurance, and empathy, and it covers all critical aspects of patient satisfaction. Second, this instrument assesses patient expectation, an essential predictor of patient satisfaction that can be compared to patient perception to help hospital managers identify their strengths and areas for improvements. 20 Third, its three decade of use in the healthcare industries show strong reliability and validity, as well as a variety of findings for comparison and discussion, such as the inconsistent findings of rankings of the mean scores of expectation, perception, and service quality gap.21-28 Finally, it’s advised to be customized it for use in specific contexts, 13 thus additional questions pertaining to the patient experience can be added to make it more adaptable. For example, functional services such as protection against violent conflicts and careful personal information checks are necessary in case of a stressful doctor-patient relationship and the COVID-19 pandemic.
Shenzhen is the epicenter of the Guangdong-Hong Kong-Macao Greater Bay Area. However, in comparison to other first-tier Chinese cities, Shenzhen was late in developing healthcare, and the number and service of healthcare facilities of Shenzhen are not leading. There lacks long-established medical universities and hospitals, locally trained doctors, and an excellent clinical research environment. However, the Shenzhen government has continued to invest in healthcare in recent years, which, in addition to requiring rapid growth in the quantity of outputs such as healthcare workforce, poses challenges to continuous improvement of the quality of service provided by this city’s healthcare institutions. 29 Shenzhen may grab the opportunities to improve healthcare, using sophisticated technology and competitive environment in the medical market to greatly increase hospital service and better fulfill residents’ needs. Therefore, this study aimed to identify quality gap of outpatient services at Shenzhen public hospitals by asking patients to report how they expected and perceived ambulatory care using a modified SERVQUAL model. Then the advantages and weaknesses of the outpatient services were presented to hospital managers to help them improve healthcare and patient experience.
Methods
Study Design and Setting
A cross-sectional study with a self-established questionnaire was conducted at 13 public hospitals in Shenzhen, China, from June to July 2019, including 5 general hospitals and 8 specialized hospitals, which were under supervision of the Hospital Administration of Shenzhen Municipality, an institute to regulate and enhance the quality of healthcare of public hospitals on behalf of the Shenzhen municipal government during this study period. All of these hospitals were tertiary hospitals and sampled to ensure that they were representative of the population. 30
Study Population
The number of beds of each hospital and published tables for convenience sampling were used to determine how many outpatients should be enrolled in each hospital.31-33 In May 2019, the average daily outpatient visits to these hospitals ranged between 171 and 11 425, and based on published tables, the sample sizes for ±7% and ±10% precision levels with a 95% confidence level and P = 0.05 would be 64/99, and 94/200, respectively.34,35 Consequently, outpatients were sampled from each hospital in a 10% ratio of the number of beds, which range from 80 to 250 patients among the 13 hospitals and totaled 2120.
The inclusion criteria were as follows: seeking ambulatory care from the sampled hospital, completing payment or drug withdrawal, acting consciously and autonomously, and being able to speak or write clearly. Patients with communicable diseases, or in unstable health conditions, and from inpatient, emergency department, and special need department settings were excluded. Pediatric patients were responded to on their behalf by their parents.
Questionnaire Development
The SERVQUAL model was used to construct the questionnaire for outpatient settings in Shenzhen public hospitals. The literature review and focused group interview generated 29 indicators, and 23 indicators were screened out after 2-round Delphi consultations with 13 interdisciplinary experts. Then 250 outpatients were recruited for a pilot test in Shenzhen and the results show that the instrument has good reliability and validity. 36 The final 2-level indicator system consists of 23 items scattered in 6 dimensions: Safety (safe environment and system of work), Tangibles (physical facilities and equipment of the hospital and appearance of staff), Reliability ( to perform the promised service dependably and accurately), Responsiveness ( to help patients and provide prompt service), Assurance (knowledge and courtesy, and trust as well as confidence), and Empathy (to carepatients and provide individualized attention) (Supplemental Appendix 1).
The questionnaire was divided into 3 parts. The first section captures the characteristics of socio-demographics of participants (gender, age, education, citizenship, monthly income) and their outpatient department visits (types of health insurance, types of referral, frequency of visits to the hospital in the past 12 months, types of hospital). The second section asks patients to score their expectation and perception of each indicator for the hospital they are visiting. The last part inquires patients how the hospital impresses on them (overall impression), and whether they would recommend the hospital to others when they undergo the same health situation (willingness to recommend). We used a Likert 9-point scale (“extremely low/agree,” “low/agree,” “neither low/disagree nor agree/high,” “agree/high,” “extremely high/agree” with 1, 3, 5, 7, 9 and 2, 4,6, 8 as intermediate values) to record responses. Each second-level item score adds up to the total score of the dimension, and the dimension score adds up to the score of a certain hospital. The quality gap is calculated by subtracting the perception score from the expectation score. The greater the perception-minus-expectation score, the greater is the perceived service quality.
Data Collection and Processing
Data were collected by 21 well-trained collectors, who all participated a training to learn how to recruit patients, introduce themselves, and explain the survey to patients. From June 1st to July 31st, collectors distributed paper questionnaires in hospital dispensing areas. The form was filled out by the patients, and if they had any question, they could ask the investigator at any moment. The surveys were anonymous and voluntary, and informed consent was obtained from all study participants. The medical administration departments, nursing departments, and quality control departments of the hospitals were on hand to help. At the end of each day, the collected data were checked for completeness, accuracy, and consistency. All answers were double-checked and manually converted into Statistical Package for Social Sciences (IBM, SPSS Statistics for windows, version 23).
Data Analysis
The data was analyzed using SPSS version 23. Descriptive statistics were used to present sample characteristics and patients experience. Mean and standard deviation were computed for all continuous variables, and frequencies and percentages were computed for all categorical variables. t-test or F-test was conducted to examine differences in patients service quality gap between patient group. This step was conducted per indicator. Optimal scale analysis was implemented to assess the relationship between patients’ overall impression as well as willingness to recommend, and their characteristics and the service quality gap.37,38 All statistical tests were 2-sided, and a P value less than .05 was considered as statistically significant.
Results
Characteristics of Socio-Demographics and Outpatient Visits of the Study Participants
A total of 1876 outpatients were investigated, with a response rate of 88.49%. Of all 1876 participants, 35.07% were male, and 64.93% were female. Most of them were aged between 18 and 40 years (81.29%), received high school and higher level of education (91.74%), resided in Shenzhen over 6 months (82.36%), paid by out-of-pocket money or Shenzhen medical insurance (67.86%), went directly to the selected hospitals without referral (94.19%), and had visited the same hospitals 1 to 3 times in the past 12 months (66.04%, Table 1).
Characteristics of the Study Subjects and Comparison of Mean Service Quality Scores (N = 1876).

Note. Service quality gap is defined as perception score minus expectation score.
M = mean; SD = standard deviation.
Student t test. All other tests are F test.
Expectation and Perception
The obtained scoring on all indicators is shown in Table 2.
Expectation and Perception of Outpatient Service (N = 1876).

Note. M = mean; SD = standard deviation; E = expectation score; P = perception score; G = service quality gap.
For patient expectation, the top one dimension is Assurance, and at the bottom is Safety (Figure 1). The top 3 indicators are A17: “The staff have a high level of medical expertise and skills,” A18: “Patients consider the medical staff to be honest and trustworthy,” and A19: “The staff respect the rights of patients” (Figure 1). The bottom 3 indicators are A9: “Posters, brochures, service guides, and other material related to medical services are easy to get,” A2: “The physical environment is safe (such as appropriate brightness of light, measures to prevent falls),” and A1: “Patients could feel relieved and safe in the process of receiving medical services” (P < .001).

Graphical representation of the expectation and perception scores of 2-level indicators and the service quality gap. E = expectation score; P = perception score; G = service quality gap.
For patient perception, the top one dimension is Assurance, and at the bottom is Safety (Figure 1). The top 3 indicators are A8: “The staff is professionally dressed and well-groomed,” A19, and A12: “The charged price is transparent, and the closing account is accurate” (Figure 1). The last 3 are A2, A1, and A6: “Comfortable and convenient environment (such as clean toilets.)” (P < .001).
Service Quality Gap
The gaps were as follows: Reliability = Empathy > Responsiveness > Safety > Assurance > Tangibles. The smallest 3 gap between expectation and perception exist in A8(gap = −0.08), A9(gap = −0.27) and A5: “The staff carefully checks the personal information” (gap = −0.28). The widest 3 gap exist in A10: “Staffs inquire about the illness and history in detail, explain the illness, diagnosis and treatment methods and matters needing attention, and make correct records” (gap = −0.68), A6: “Comfortable and convenient environment” (gap = −0.61), and A1(gap = −0.58) (P < .001). The rankings of expectation, perception, and quality gaps scores are diverse (Figure 2).

Rankings of expectation, perception, and quality gaps of outpatient service of Shenzhen and comparison with other countries.
The mean quality gap for each dimension differed significantly between age, education, and hospital type (Table 1, P < .05). Participants aged between 31 and 40 years old reported the widest gaps. Patients with higher level of education obtained larger gaps. Patients to general hospitals had smaller gaps than those to specialized hospitals.
Overall Impression and Willingness to Recommend
The overall impression mean scores are 7.45 ± 1.18 (out of 9 points) and 7.27 ± 1.23 for general and specialized hospitals, respectively. And the willingness to recommend mean scores are 4.06 ± 0.62 (out of 5 points) and 3.92 ± 0.65 for general and specialized hospitals, respectively.
The analysis results of regression with optimal scale are presented in Table 3. Age, citizenship, types of health insurance, types of referral, frequency of visits to the hospital in the past 12 months, Safety, Tangibles, Reliability, Assurance are significantly associated with patients’ overall impression and willingness to recommend(P < .05). The overall regression was statistically significant (overall impression: R 2 = 0.2, F = 27.01, P = .000; willingness to recommend: R 2 = 0.12, F = 13.09, P = .000).
Results of Regression with Optimal Scale.
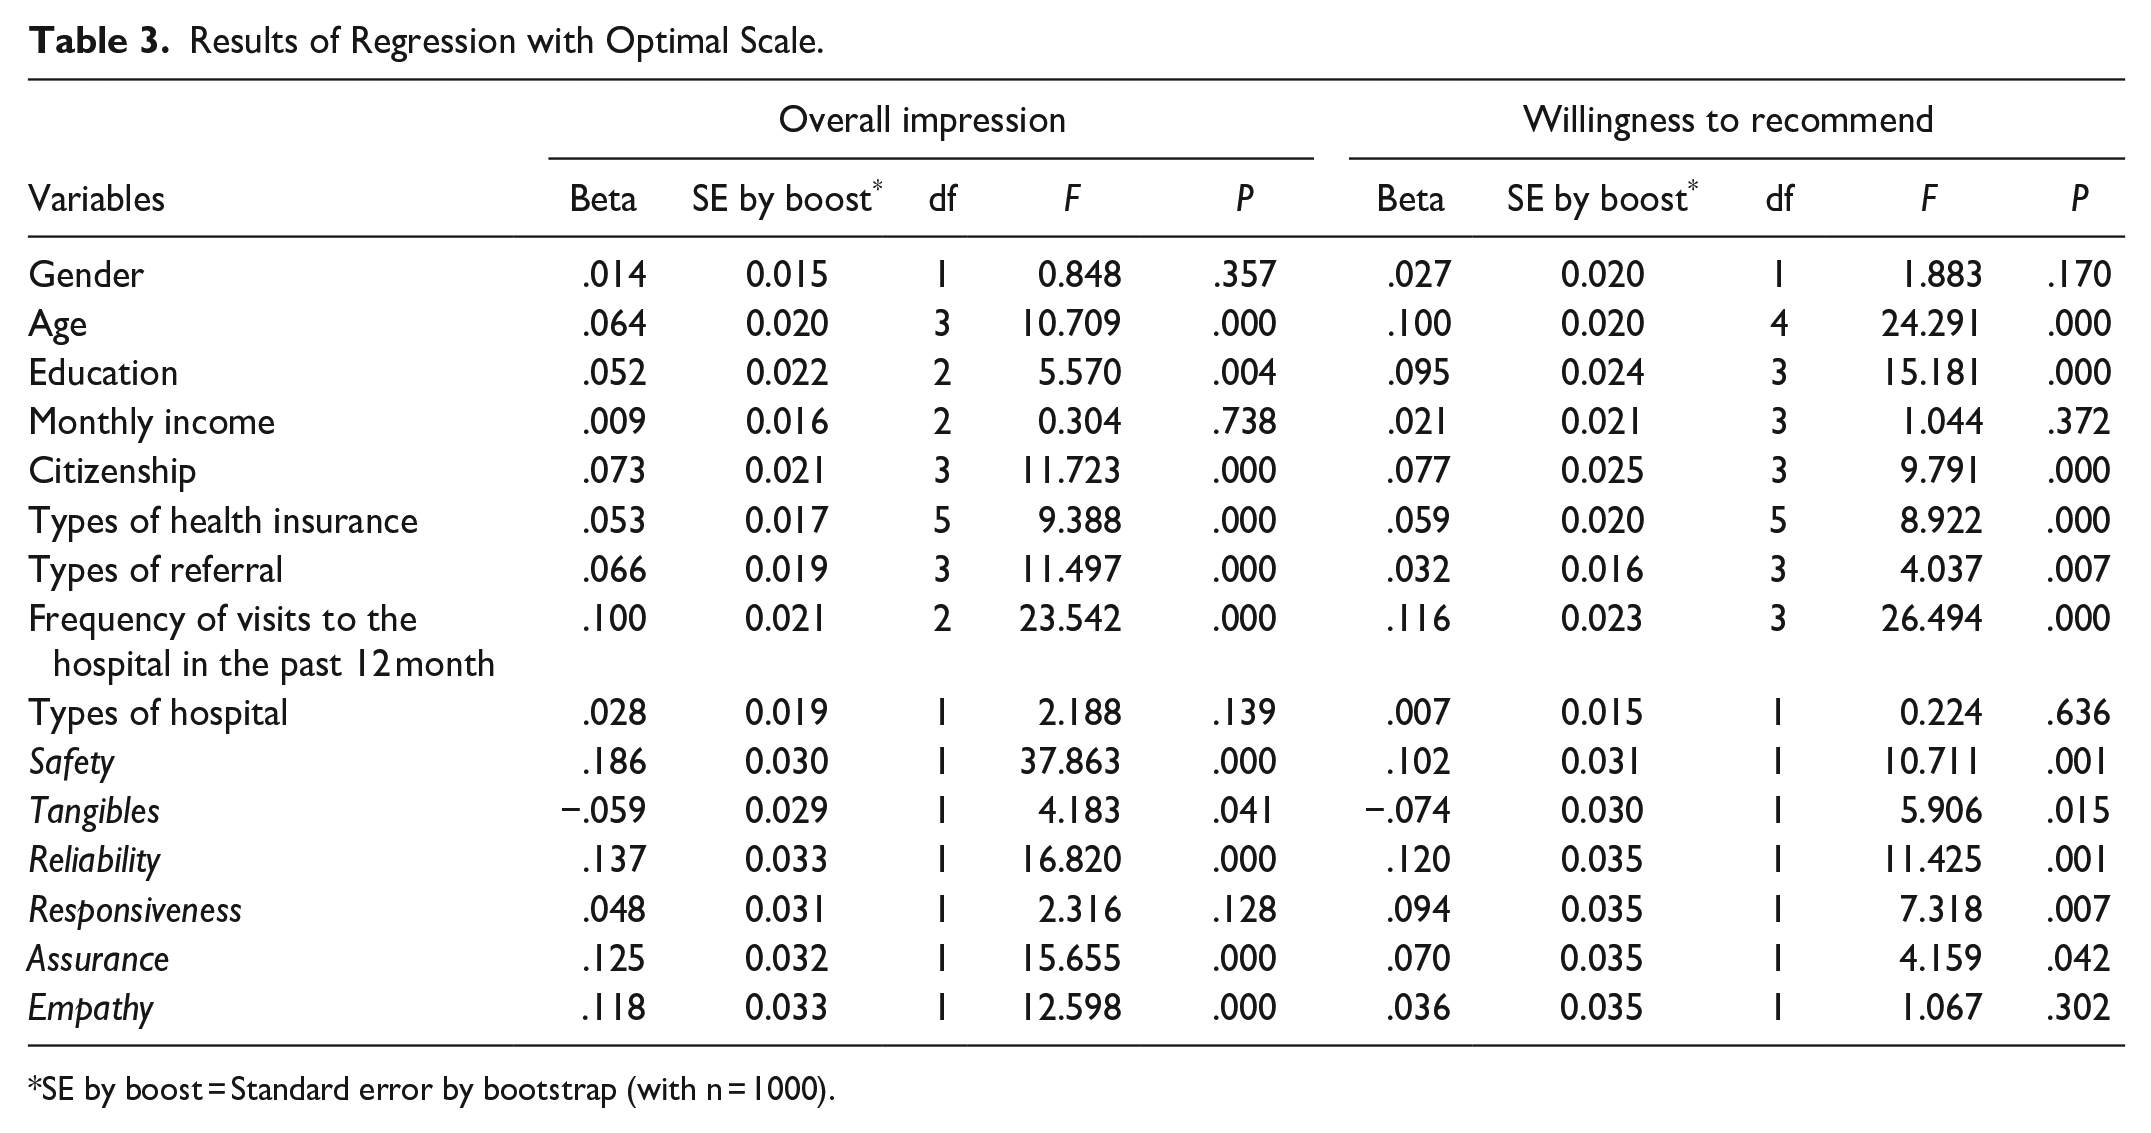
SE by boost = Standard error by bootstrap (with n = 1000).
Discussion
This study assessed the outpatient service quality gap in public hospitals in Shenzhen, China. Furthermore, it investigated the relationship between the gaps and patients’ overall impression on a hospital, as well as their willingness to recommend the hospital to others with the same health situations, indicating that improving safety, reliability, and assurance of outpatient service is important for retaining and attracting outpatients.
This study found that patients’ expectations for outpatient services was very high in all dimensions, exceeding the services they perceived from hospitals. Therefore, negative gaps were caused between the mean expectation and perception scores for each indicator (see Table 2). The results are consistent with studies based on the SERVQUAL instrument and conducted in outpatient departments or clinics of public or major hospitals in Jordan, Turkey, Croatia, Pakistan, Tehran, Eastern Saudi Arabia, Ghana, India, and China.21-28,39 However, participants in this study scored 7.45 ± 1.18 (out of 9 points) and 7.27 ± 1.23 for general and specialized hospitals on the overall impression, which is high and close to Hu et al 40 (4.38 out of 5), a survey that also included tertiary hospitals in Shenzhen their subjects. This implies that although patients had a good overall impression of the hospital, outpatient services in public hospitals in Shenzhen did not fully meet patients expectations. For the consistent gaps, there are 3 possible explanations. First, as Picker Institute pointed out, the same group population would give more positive satisfaction scores and negative experience scores. 41 Second, patients’ expectations can be raised by patients’ awareness of their rights and increased convenience in all aspects of life. For example, Bakar et al 23 analyzed the expectation and perception of service of 550 patients from the Baskent University Hospitals Network in Turkey, and found that patient expectations were higher than perception for a high-quality hospital and lower than perceived for an ordinary hospital. The hospitals sampled in this study were all high quality public tertiary hospitals, so it’s possible that the patients’ expectation increased. The third explanation is that the original SERVQUAL model has been questioned for a long time for overestimating patient expectations. 12 The issues identified by the service quality gap should be considered to further remove the flaws in the overall service delivery process from ambulatory care.
Though negative service quality gap is consistently found in existing studies, patients hold different attitudes of expectation and perception to the quality indicators. Our findings show that in Shenzhen, Assurance was most expected and perceived, Safety was worst expected and perceived, and the widest 2 gaps exist in Reliability and Empathy. The results are controversial to many studies, as shown in Figure 2. The differences are widely existing in the rankings of expectation score, perception score, and their gap.21,25-28 The reality of highly heterogeneous healthcare systems around the world and ability to provide service of medical institutions within China may partly explain the differences. For instance, Chinese outpatients are not strict about the appointment and rarely visit the doctor at scheduled time. 42 So it’s hard to compare ambulatory care using service quality gaps, but this model could identify the problems that exist in the outpatient service in each medical institution. 43 Therefore, service quality gap should be evaluated by individual medical institutions to know their specific advantages and disadvantages.
Besides, patients’ demographic information is associated with their quality gap. In our study, the participants aged between 31 and 40 years old and had a master’s degree or above reported the widest service quality gap (Table 1). The same results were found by Bakar et al 23 and Xie et al. 44 This study also found patients’ demographic information (age and citizenship) and outpatient visit characteristics (types of health insurance, frequency of visits to the hospital in the past 12 months, types of referral), and the safety, reliability and assurance gaps were positively associated with their overall impression and willingness to recommend, while tangibles gap were negatively associated with patients’ overall impression and willingness to recommend. One possible explanation may be that there are many newly-built hospitals in Shenzhen, and their environment and facilities are more advanced. 45 For public hospitals in Shenzhen, more efforts are needed in: (1) continuously enhance the assurance of ambulatory care; (2) mitigate the flaws in the reliability and empty of outpatient services; (3) pay more attention to outpatients who are young (aged 31-40) and highly educated, especially that Shenzhen is China’s youngest city, with the average age of its permanent population 32.5 years old. 46
This study has several limitations. First, the data were collected before the COVID-19 pandemic, making the indicator system for post-pandemic era not be tested. Secondly, the sample size is relatively small in case of large daily volume of outpatient encounters in China’s tertiary public hospitals. Thirdly, the whole research was conducted in Shenzhen, thus the tool needs modification in further surveys in other cities. It’s worth noting that we do not present and discuss the service quality ratings and rankings of each hospital due to data concerns. This is one of the survey tool’s strengths. A 9-point scale was developed in this study and it’s applicable for AHP analysis enables the comparison of service quality among hospitals, departments, and healthcare teams by adding importance of each indicator before the expectation and perception. The survey may then be well adapted to the current needs of hospital refined management.
Conclusions
Patient’s expected scores of ambulatory care were higher than perceived scores for all service quality indicators in public hospitals in Shenzhen, China. The negative service quality gap indicates unideal outpatient services. Service quality scores can be improved according to the relative importance of each indicator, patient expectation and perception, and the associated factors.
Supplemental Material
sj-pdf-1-inq-10.1177_00469580231162527 – Supplemental material for Assessing Quality Gap of Outpatient Service in Public Hospitals: A Cross-Sectional Study in China
Supplemental material, sj-pdf-1-inq-10.1177_00469580231162527 for Assessing Quality Gap of Outpatient Service in Public Hospitals: A Cross-Sectional Study in China by Qian Lin, Horng-Shuh Hao and Dan Zhang in INQUIRY: The Journal of Health Care Organization, Provision, and Financing
Footnotes
Acknowledgements
We would love to thank all the experts of the Delphi panel for their participation and expertise.
Author Contributors
HHS, ZD, and LQ conceptualized the study; HHS and ZD collected the data; LQ conducted the data analyses; LQ and ZD wrote the first draft; ZD, LQ and HHS critically revised the article. All authors critically reviewed this article and approved the final version.
Data Sharing
The data that support the findings of this study are available from [the participating patients] but restrictions apply to the availability of these data, which were used under license for the current study, and so are not publicly available. Data are however available from the authors upon reasonable request and with permission of [the participating patients].
Declaration of Conflicting Interests
The author(s) declared no potential conflicts of interest with respect to the research, authorship, and/or publication of this article.
Funding
The author(s) disclosed receipt of the following financial support for the research, authorship, and/or publication of this article: This work was supported by [the Humanities and Social Sciences Foundation of China Ministry of Education] grant number [19YJCZH239]; and [Youth fund of the National Natural Science Foundation of China] grant number of [72004112]. This work was also a project of Shenzhen Key Research Base of Humanities and Social Sciences (Social governance and Innovation Research Center of Tsinghua Shenzhen International Graduate School).
Ethical Approval
The Ethics Committee of Tsinghua Shenzhen International Graduate School were contacted. This study obtained no identifiable private information from the participating patient and the data were only for the current study. Therefore the study was exempt from approval procedures. We have obtained written informed consent from all study participants before the survey. The study had no privacy or ethical implications.All of the procedures were performed in accordance with the Declaration of Helsinki and relevant policies in China.
Supplemental Material
Supplemental material for this article is available online.
References
Supplementary Material
Please find the following supplemental material available below.
For Open Access articles published under a Creative Commons License, all supplemental material carries the same license as the article it is associated with.
For non-Open Access articles published, all supplemental material carries a non-exclusive license, and permission requests for re-use of supplemental material or any part of supplemental material shall be sent directly to the copyright owner as specified in the copyright notice associated with the article.