
Abstract
Healthcare associated infections (HAIs) are a concern to patients, hospital administrators and policymakers. For over than a decade, efforts have been made to hold hospitals accountable for the costs of HAIs. This study uses contingency theory as a framework to examine the association between HAIs and hospital financial performance. We use publicly available data on 2059 hospitals in 2014 to 2016 that include HAIs, staffing financial performance, and hospital and hospital market characteristics. The key independent variables are available infection rates and nurse staffing. The dependent variables are indicators of financial performance: operating margin, total margin, and days cash on hand. We find nearly identical negative direct associations between infections and operating margins and total margins (−0.07%), and positive associations between the interaction of infections and nurse staffing (0.05%). A 10% higher infection rate would be predicted to be associated with only a 0.2% lower profit margin. The associations between HAIs, nurse staffing and days cash on hand were insignificantly different from zero.
Healthcare associated infections (HAIs) are a patient safety challenge for hospitals. A number of HAIs occur every year and there are costs associated with treatment of HAIs. For more than a decade, Medicare and other payers have stopped reimbursement associated with HAIs.
Through this research, we understand the implications of HAIs on hospital financial performance. Specifically, the study sheds light on how the occurrence of HAIs and the interaction of HAIs and nurse staffing levels impact operating margin, total margin, and days cash on hand at hospitals.
The occurrence of HAIs, in this time period, has minimal impact on hospital finances when one includes the relationship between HAIs and hospital staffing. Perhaps due to the responses to changes in reimbursement policy or general attention to HAIs, the numbers and costs do not appear to be a substantial concern.
Introduction
Hospital associated infections were identified as an important patient safety challenge by the Institute of Medicine’s report “To Err is Human.” 1 The Centers for Disease Control and Prevention (CDC) has viewed HAIs as a significant threat to patient safety and works to monitor and prevent these infections. 2 In 2004, Pennsylvania, Illinois, and Florida started mandatory reporting for HAI rates for hospitals. By 2009, 14 states had instituted some type of legislation or regulation with regards to infections rates reporting. Many states now require hospitals to publicly disclose infection related outcome data. 3 About 20 states now require hospitals to report infection rates through Centers for Disease Control and Prevention’s (CDC’s) National Healthcare Safety Network (NHSN). 4
Central line associated bloodstream infections (CLABI), catheter associated urinary tract infections (CAUTI), and surgical site infections (SSI) are common types of HAIs. 1 Healthcare-associated infections objectives for Healthy People 2020 were established by the Department of Health and Human Services (DHHS) as an undertaking to eliminate HAIs. Healthy People 2020s high priority objectives include ways to address CLABSI, and methicillin-resistant Staphylococcus aureus (MRSA) infections. The DHHS has a national action plan to prevent HAIs, which includes updated indicator targets and data, new research and intervention efforts, and a review of COVID-19 pandemic on HAIs. 5
In 2009, the direct medical cost of HAIs in the United States ranged from $36 to $45 billion for inpatient hospital services (adjusted for 2007 dollars). 6 More recent studies show that CLABSIs cost $21 billion per year. 7 The cost estimated for CAUTIs is approximately $800 per admission, 8 which becomes an estimated $3740 when complicated by blood stream infections. 9 CAUTI was among the first HAI selected by Medicare for nonpayment in 2008. 9 The estimated cost range for SSIs is $10 000 to $25 000.10,11
Many public and private payers have instituted financial incentives to reducing HAIs. Pay for performance in healthcare includes payment models that either financially incentivize or dis-incentivize provider performance regarding quality of healthcare and patient outcomes. 12 Medicare determines hospital payment for performance through scores that incorporates rates of preventable conditions including HAIs. 13 Hospitals that fall in the lowest quartile can see a reduction of 1% revenue. Under the prospective Diagnosis Related Group (DRG) payment system, hospitals can classify patients with complications into higher DRGs that are reimbursed at higher rates. A Medicare policy of 2008 attempted to curb this issue by limiting hospitals’ ability to assign higher DRGs for patients with HAIs. 12
By 2016, after changes in reimbursement policies by Medicare and other payers to stop payment for “never events” including HAIs, nearly 1% of inpatient admissions in the United States still had HAI as the primary diagnosis. 14 The Department of Health and Human Services has released a roadmap to elimination of HAIs in 2009 with updates in 2018. 5 Reduction in hospital costs associated with HAIs, for which there may be no offsetting reimbursement, may be beneficial to hospital financial performance.
Prior studies have examined the relationship between hospital quality performance and financial performance. The quality indicators used in these studies to assess performance have ranged from readmission rates to mortality rates to patient satisfaction.15-17 Hospital financial performance has been measured by net patient revenues, operating margin, and total profit margin. 18 To our knowledge, no studies have examined the association between HAIs as a quality indicator and hospital financial performance. Given the attention that reduction in HAIs has received in the recent decade, it is logical that HAIs be examined in relation to financial performance.
Theoretical Perspectives and Hypothesis
This study uses tenets of contingency theory to provide theoretical insights into the relationships examined. This theory posits that organizations attempt to optimize outcomes by adapting actions that are contingent or dependent upon both the organization’s internal and external factors. 19 Our study examines the relationship between healthcare associated infections including the main effects of infection rates and the interactions between infection rates and nurse staffing, on hospital performance. Policies regarding HAIs impact the reimbursement mechanisms, and the demands of extensive HAI reporting make the hospital external environment uncertain. In addition, the shortage of staffing puts a burden on hospitals to provide high quality service delivery and maintain low infection rates. Contingency theory posits that organizations are resilient to uncertain environmental changes and capable of adapting to dynamic environmental conditions. To maintain high performance, organizations change their internal design and actions with respect to changes in the environment. 19 The most directly observable way in which hospitals can respond to patient care outcomes is to assure sufficient nurse staffing. 20
Contingency theory further contends that a lack of fit between contingency variables and hospital structure will negatively affect organizational performance. 21 Since hospitals are most successful when they adapt to their environments, it is to their advantage to tailor strategies to fit external contingencies. While hospitals may state a principal motive of improving quality performance, they may also be attentive to financial performance. Following assertions of contingency theory, the financial performance implications of a lack of fit between not preventing infections or lower quality needs to be examined. According to contingency theory, should organizational strategies be circumstantially inappropriate, the performance of the organization may suffer. 22
From the perspective of contingency theory, the optimal way to organize relies in the environment in which it operates. 19 Therefore, factors like HAI policies, reimbursement mechanisms, financial incentives, or disincentives along with their organizational and market characteristics, would form the context in which the hospital operates. Accordingly, hospital managers should aim to create a fit or an alignment among the salient elements of the hospital’s environment and their internal course of action. Based on the government policies and the financial incentives, hospitals can choose to prevent HAIs, which will optimize outcomes shown as better financial performance. To the extent that organizational strategies are not appropriate to prevent HAIs, financial performance will be affected negatively. Thus, we hypothesize that:
H1: A higher number of HAIs are related with worse hospital financial performance.
H2: The interaction between HAIs and nurse staffing is related with better hospital financial performance.
Methods
Data and Sample
Healthcare associated infections’ data was obtained from the Hospital Compare database provided by the Centers for Medicare and Medicaid Services. 23 Data regarding hospital financial performance was obtained from the Medicare cost reports. 24 Hospital characteristics, organizational factors, and the total number of outpatient visits was obtained from the American Hospital Association’s (AHA) annual survey. 25 Hospital market characteristics was obtained from the Area Health Resource File. 26 All data sets were merged using the Medicare provider number and the Federal Information Processing System (FIPS) code. The time period for the final dataset included 2014 to 2016.
Measures
Dependent variables
The dependent variables used in this study are indicators of financial performance- operating margin, total margin, and days cash on hand. These financial indicators were selected because as a measure of profitability they have been widely chosen in the healthcare management literature when examining antecedents of financial performance. 26
Operating margin is an indicator of operational efficiency that excludes influence of non-patient care income and focuses on core clinical functions. It is calculated as the difference between net patient revenues and operating expenses, divided by the net patient revenues. Total margin is the indicator of overall profitability and accounts for all revenues (patient care and non-patient care), and all expenses. It is calculated as the difference between total revenues and total expenses plus total other income divided by total revenue. Days cash on hand is the number of days a hospital can keep up with its operating expenses using the cash available for business. It is a key financial indicator for hospitals, as hospitals may have to wait longer periods of time to obtain reimbursements from Medicare, Medicaid, and insurance companies if claims include HAIs and require review. Days cash on hand is measured by total cash and cash equivalents (financial investments) divided by total expenses for the year, divided by 365 days.
Independent variables
The independent variables used in this study are healthcare associated infections: CALBSI, CAUTI, MRSA, and SSIs. The 2 available SSIs were those associated with abdominal hysterectomy and colorectal surgery. For each type of infection, the rate is calculated as a ratio of observed cases divided by the number of days or procedures. Given the numbers of cases and the potentially small impact of any one case on hospitals’ total financial performance, we used the average of infection rates as the measure of infection incidence. With the contingency-based response to infections being nurse staffing, we included the number of registered nurses per adjusted patient day in multivariable analyses, 20 and the interaction between HAIs and nurse staffing.
Control variables
The following organizational characteristics, each generally found to be associated with financial performance, 26 were used as control variables in this study. Hospital size was measured by the number of beds in a hospital and was a continuous variable. To further examine the contingent responses of hospitals, 2 interactions with hospitals beds were considered: infections and registered nurses per adjusted patient day. These interaction were designed to fully control for hospital size, recognizing that hospitals of varying sizes have differential ability to react to infection rates and adjust nurse staffing levels. Hospital ownership was measured in 3 types: investor-owned, government, and community not-for-profit. System membership was categorized as system affiliated and non-system affiliated hospitals. Teaching status was indicated if hospitals were member of the Council of Teaching Hospitals, or if they were affiliated to a medical school, or if they provided a residency program. Three measures of physician integrations are available: participation in an independent practice association, participation in an open group practice, and contracting for management services.
Available market characteristics include: rural hospital status, the local market wage index calculated by CMS, proportion of Medicaid patients, proportion of Medicare patients, and market competition measured by the Hirschman Herfindahl Index (HHI). For the HHI, we used the sum of square of market shares (inpatient days for hospital/total inpatient days for all hospitals in the market), with resulting values ranging from 0 to 1, with 0 indicating highly competitive markets and 1 indicating monopolistic markets.
Finally, 4 control variables were included that may reflect organizational characteristics and/or market characteristics: adjusted occupancy rate, CMS case mix index, heart failure score, and pneumonia score. The adjusted occupancy rate includes outpatient revenue per patient divided by inpatient revenue per patient to construct inpatient equivalents. The CMS case mix index is the average DRG weight for Medicare patients. The heart failure and pneumonia scores are the death rates of Medicare patients with those conditions. These scores may represent an uncorrelated with HAIs, yet larger picture of the overall quality of care in a hospital.
Analysis
The data were organized in a panel format at the hospital level, with a potential of approximately 6000 hospitals. Many of the potential observations included missing values, or values for one or more variables that were either implausible or not associated with viable organizations. We excluded hospitals with reported values of operating margins above 30% and below −30%, hospitals, with negative cash balances beyond 1 week, hospitals with revenues per patient day below $500, and proportions of Medicare or Medicaid patients above 100%. Further, we limited the sample to hospitals with more than 50 beds, as smaller hospitals were largely missing infection rate data, or were too small to have sufficient number of medical and surgical conditions for complete rates. Data for each type of variable were missing, presumably, at random, as there were no clearly observable patterns. There was no attempt to estimate missing values. The final sample included observations on 2059 hospitals for 1 to 3 years for a total of 4878 observations.
We conducted generalized estimating equations analysis on the pooled data. Initial analyses of operating margin rejected a random effects specification with the Breusch and Pagan Lagrangian multiplier test (Chi 2 = 810.26; P < .0000). Hospital identifier was used as the cluster and year was used as the time parameter, yielding a fixed effects model, with robust standard errors. All analyses were conducted using Stata 17-BE. 27
Results
Descriptive Statistics
The descriptive statistics of all variables used in this study is shown in Table 1. The average Operating Margin was 1.4% and the average Total Margin was 6.2%. Hospitals, on average, more than compensated for small returns on operations with investment gains and other non-operating activities. The average days cash on hand was 47 days.
Descriptive Statistics for Study Variables.
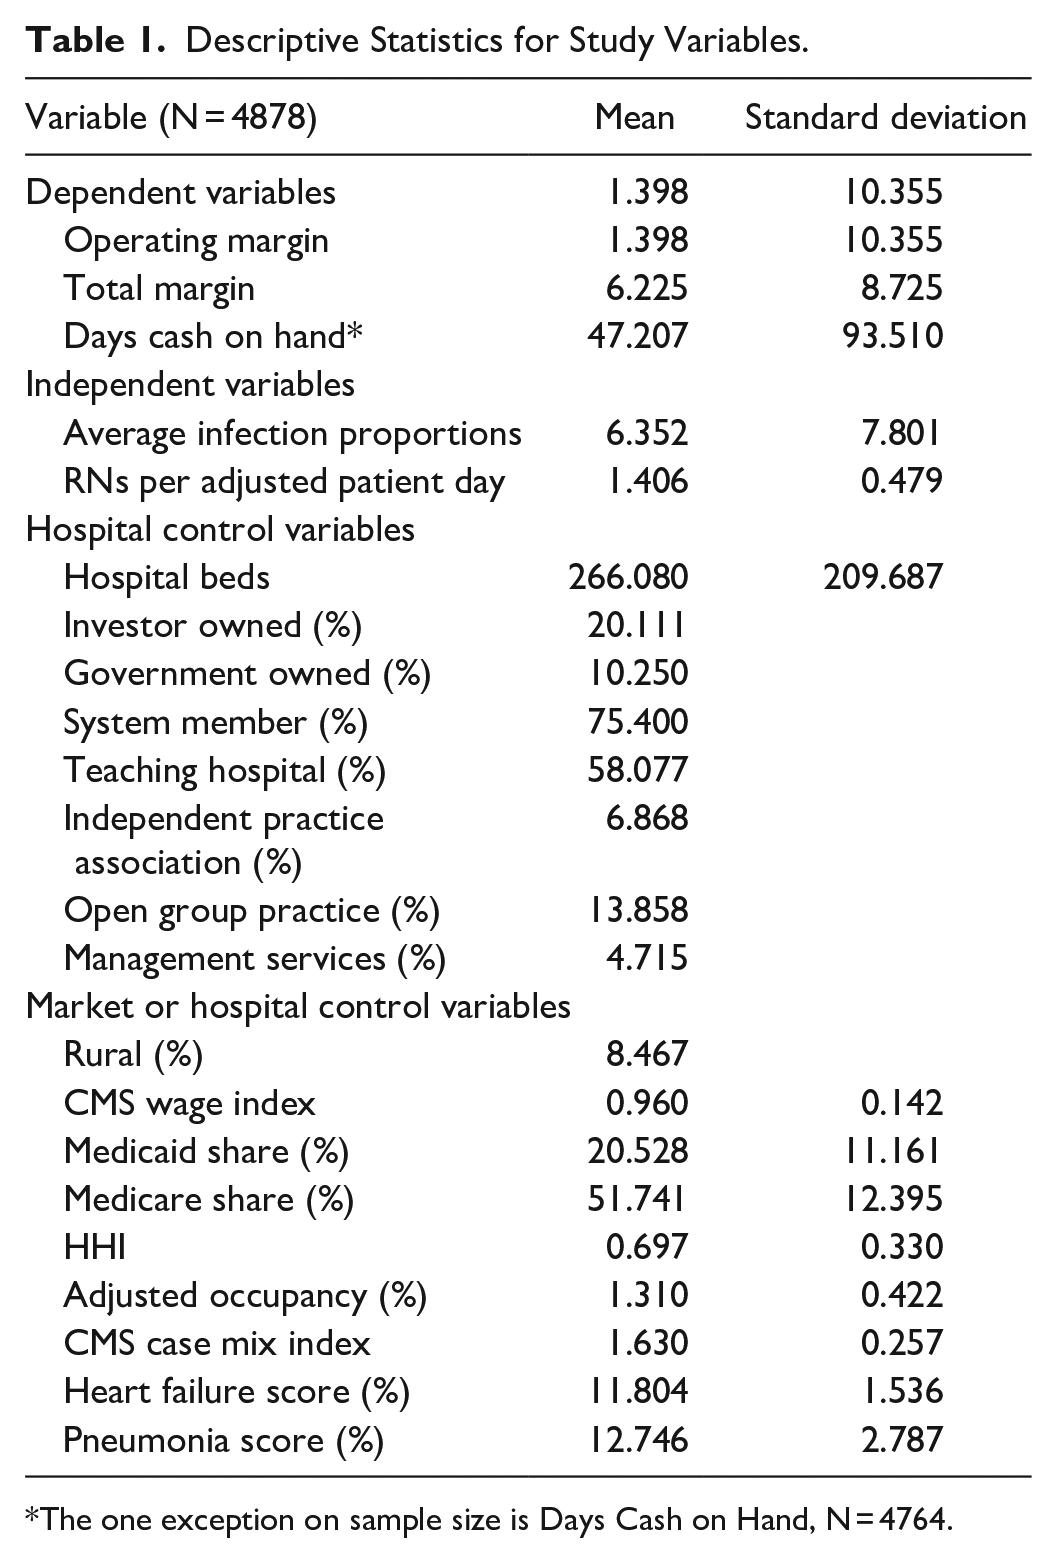
The one exception on sample size is Days Cash on Hand, N = 4764.
The average proportion of cases with HAIs, among those patients potentially with HAIs, was 6.3. There were an average of 1.4 full-time registered nurses per patient day in this sample of hospitals.
Average values of control variables are all plausible with no surprising values, recognizing that hospitals with fewer than 50 beds were excluded. The average hospital size was 267 beds. 20% of the sample hospitals were investor-owned and 10% government owned, meaning that the excluded group of community, not-for-profit hospitals accounted for 70% of the sample. Three-quarters of the hospitals were in some type of hospital system and nearly 60% had some teaching function. Specific physician integration strategies were in place for many hospitals, with 7% participation in an independent practice association, 14% participation in an open group practice and 5% contracting for management services.
Only 8% of included hospitals were rural, again, recognizing that hospitals with fewer than 50 beds were excluded. The average local market wage index was near the national average of 1.0. The proportion of Medicaid patients was 20% and the proportion of Medicare patients was 52%. The market competition HHI was 0.7, suggesting that most hospitals operate in markets that are not highly competitive. The average adjusted occupancy rate was 131%, representing an average inpatient occupancy rate of nearly 70%, and nearly an equivalent level of activity associated with outpatient services. The average CMS case mix index was 1.6. Heart failure and pneumonia score were around 12, values near the national averages.
Regression Analyses
Table 2 present the results of the examination of relationship between HAIs and financial performance as measured by the Operating Margin. The Average Infections Proportions was negatively related to Operating Margin, and RNs per Adjusted Patient Day and the interaction term of Average Infections Proportions × RNs per Adjusted Patient Day are positively related to Operating Margin, as hypothesized. While the number of Hospital Beds was not significantly associated with Operating Margin, the interaction between RNs and Beds was negative and significant.
Regression Analysis for the Relationship Between Healthcare Associated Infections and Financial Performance (Operating Margin).

Indicates P < .05.
Indicates P < .01.
The estimated coefficients suggest that Investor-Owned hospitals and System member hospitals were more profitable on operations, while Government Owned hospitals and Rural hospitals were less profitable. Higher local wage indexes, higher Medicaid and higher Medicare share were all associated with lower profitability on operations. Higher levels of Adjusted Occupancy and Case Mix were associated with higher profitability on operations. Other control variables were not statistically significant.
Table 3 present the results of the examination of relationship between HAIs and financial performance as measured by the Total Margin. An unexpected finding was the nearly identical coefficients in the Total Margin regression for the key independent variables as was observed for Operating Margin. Among the control variables, Investor and Government ownership were no longer significantly associated with profitability, though System Membership as positively related to higher overall profitability. The estimated relationships between Rural status, Wage Indexes, Medicaid and Medicare shares, Adjusted Occupancy and Case Mix were of the same sign, though of lower magnitude in the analysis of overall profitability.
Regression Analysis for the Relationship Between Healthcare Associated Infections and Financial Performance (Total Margin).
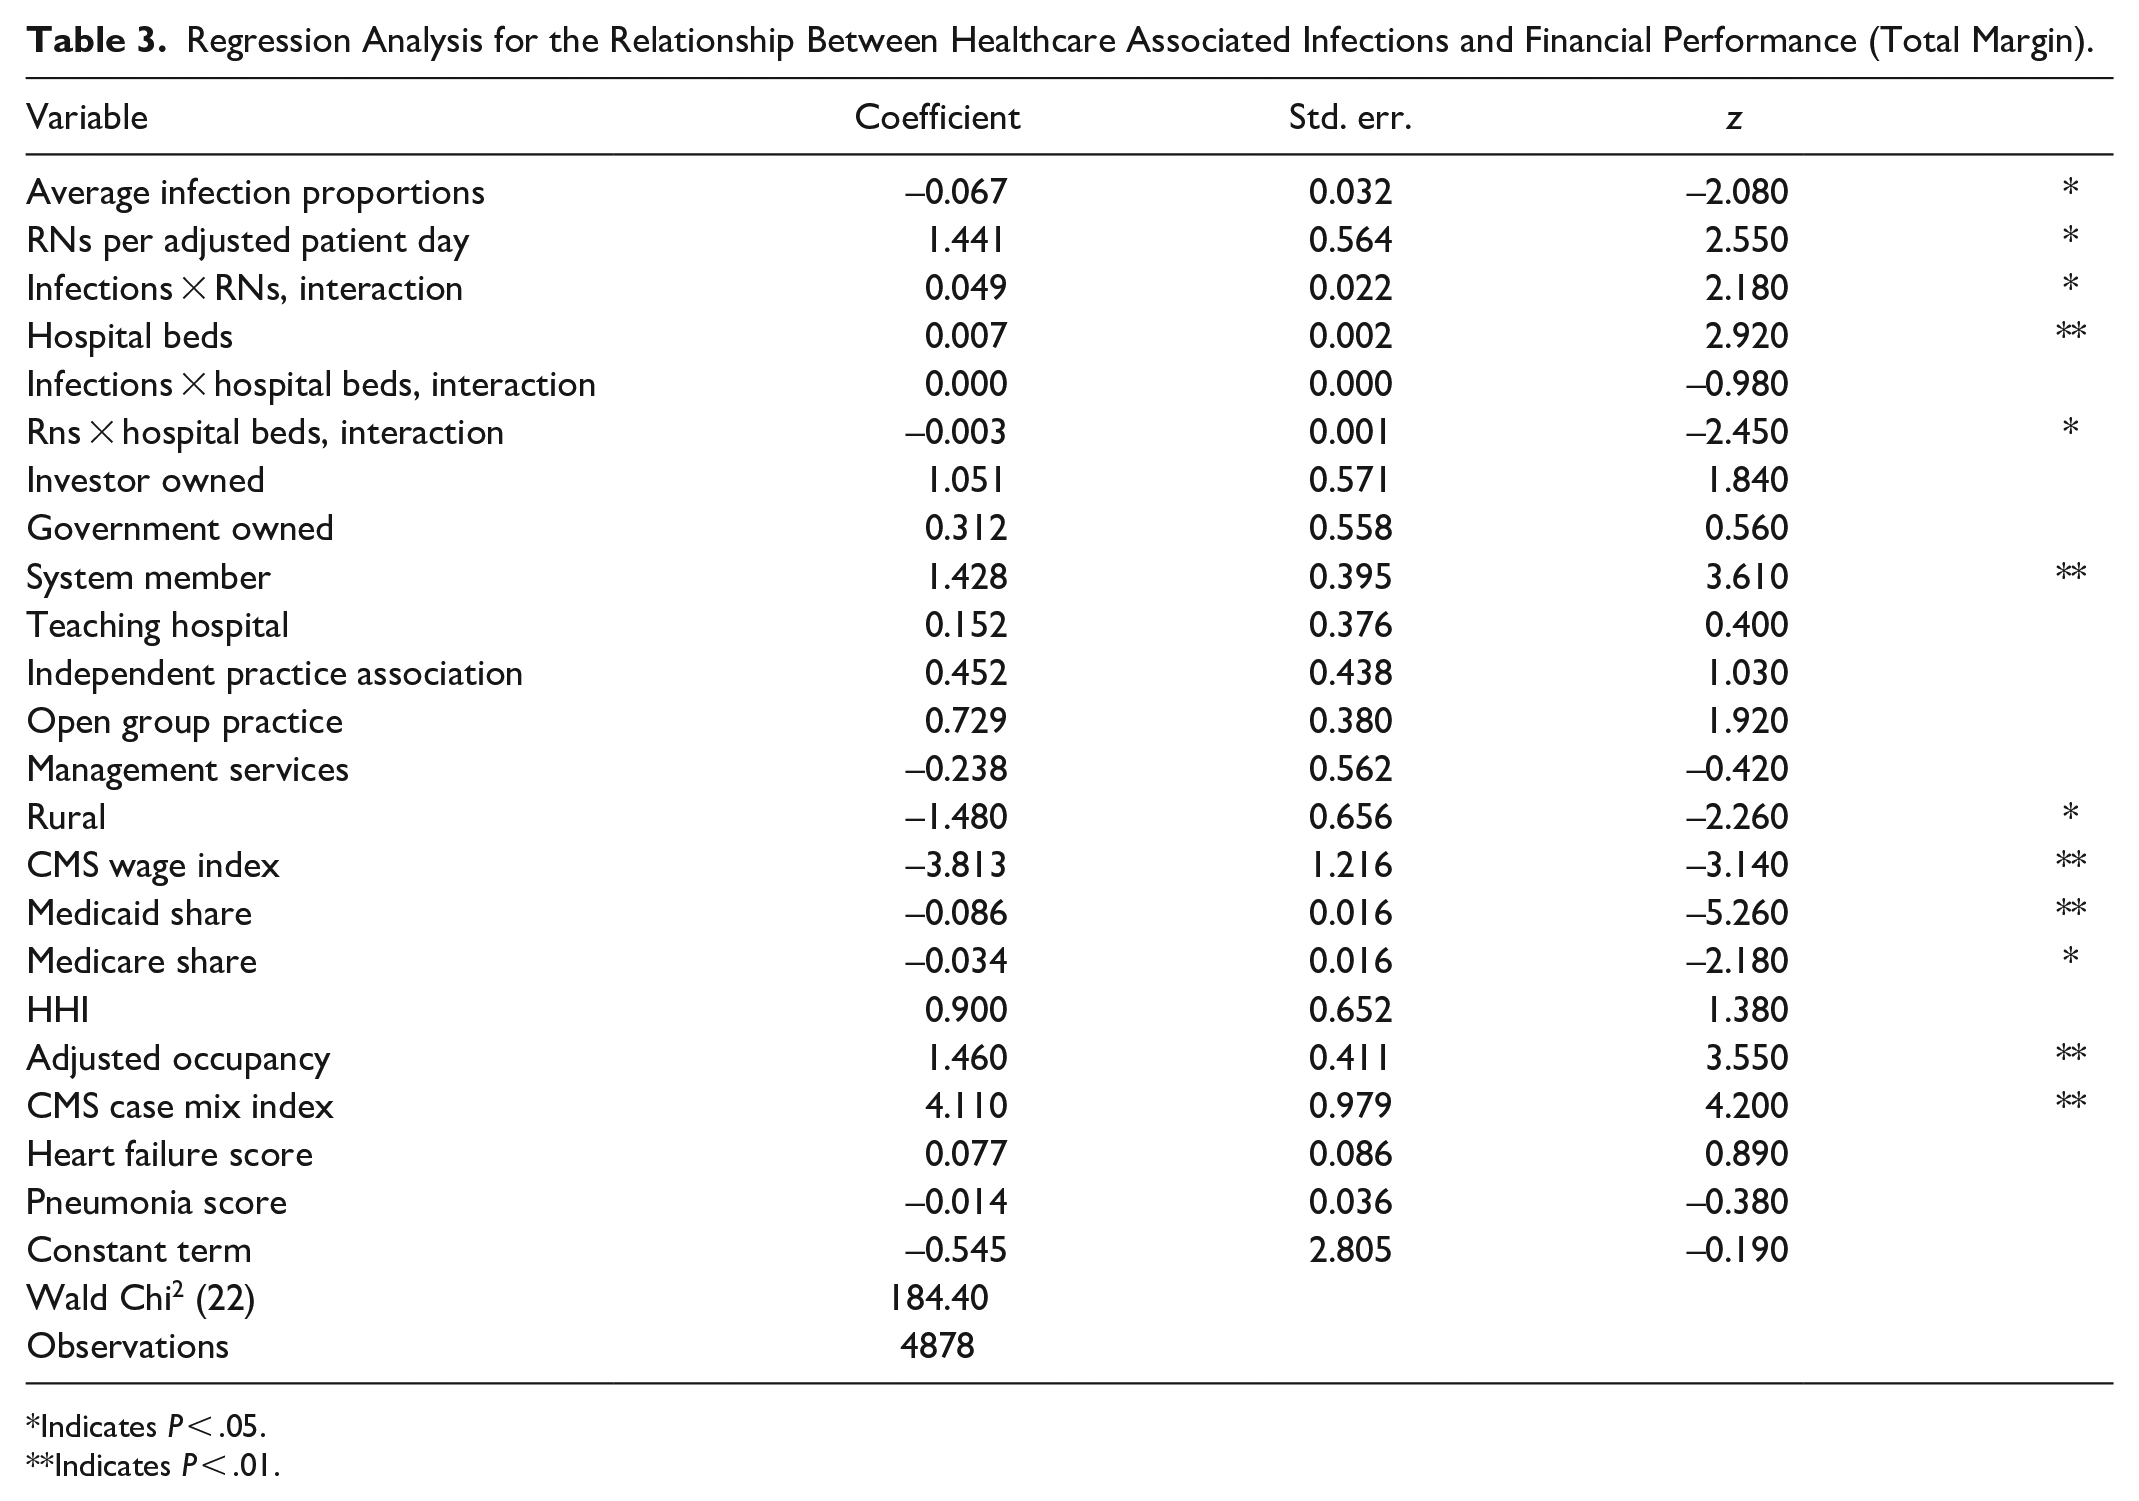
Indicates P < .05.
Indicates P < .01.
Table 4 presents the results of the examination of relationship between HAIs and financial performance as measured by Days Cash on Hand. Neither the relationship between Average Infections Proportions nor the interaction with RN staffing was statistically significant in the analysis of Days Cash. Higher levels of RN staffing, use of Management Services contracting, higher market concentration and higher wage of case mix indexes were associated with higher levels of cash holdings. Investor-Owned status and higher Adjusted Occupancy were associated with lower levels of cash holdings. The coefficients on the other control variables were not statistically significant.
Regression Analysis for the Relationship Between Healthcare Associated Infections and Financial Performance (Days Cash on Hand).

Indicates P < .05.
Indicates P < .01.
Discussion
The objective of this study was to examine if healthcare associated infection rates would be associated with hospital financial performance. Operating margin, which is the most likely of financial performance measures to be associated with an untoward operating condition of a hospital acquired infection, was negatively related to HAIs. Consistent with contingency theory, findings show, the interaction of HAIs and nurse staffing was positively related to operating results. Based on the dominant fee for service per diagnosis reimbursement methodology, hospitals might have an incentive to up code or wrongly code patients’ diagnoses. It is also possible that hospitals that have the resources to afford adequate nurse staffing use their coding staff to manipulate diagnoses for higher reimbursements.
Not hypothesized are the very similar coefficients, and therefore off-setting effects. The negative direct association between infections and both margins (−0.07%), is almost completely offset by the interaction between infections and nurse staffing (0.05%). A 10% higher infection rate would be predicted to be associated with only a 0.2% lower profit margin, that is not significantly different from zero.
The above discussion about costs and benefits and findings from this study are very relevant for hospital administrators that are making decisions regarding controlling HAIs. 28 Clearly, aiming to control HAIs through appropriate nurse staffing, investment in appropriate physical plant, information systems and training are components of effective HAI control. Each expense has the effect of lowering profitability in the short-run, and perhaps making the hospital safer and more viable in the long-run. It is interesting in the present case that while HAIs are associated with lower profitability, the complete picture shows investments in nurse staffing that offset this relationship.
It is also interesting that the relationship between HAIs and profitability was nearly identical for Operating Margin and Total Margin. The usual finding associated with profit measures is the dampened relationship observed with the control variables. Since regressions are suggested to measure the marginal relationship among variables, if there is a relationship between infections and operating profitability (−0.07%), this same relationship could carry through to total profitability (−0.07%), since there is no non-operating mechanism to interfere in this relationship. In contrast, system membership might be associated with significantly improved operating profits though lower supply costs and system-wide efficiency programs, which are muted by non-operating system membership costs.
In the model of Days Cash on Hand and HAIs, there were no significant relationships observed. The reason could well be that hospitals have target cash levels, meaning that other hospital cash uses might be deferred if there were an actual cash flow change associated with HAIs. 29 The reason could also be that costs of treating HAIs may not be avoided to truly produce “cash” savings, however treating HAIs do represent significant consumption of resources, which can be directed toward more productive areas. As a result, cost savings achieved by eliminating HAIs are useful resources that can be freed up and made available for other useful revenue generating treatments. Further, there may be more complexity to the cash conversion cycle that merits examination in this context. 29
Policies regarding HAIs are focused on transparency in reporting of infections that has certainly increased the number of reported cases. Policies have also financially dis-incentivized hospitals by reducing reimbursement. In the future, policymakers should encourage hospitals to invest in preventing HAIs by illustrating a cost versus benefit comparison. Hospitals should understand that the opportunity cost of using resources in the treatment of other health conditions may be more expensive than taking simple steps such as hand hygiene to prevent infections. Hospitals may not have the highest quality as depicted by the results in this study, so there is room for quality improvement as well as financial performance. Spending money on quality enhancing activity may have a positive return on investment. Specific activities of hospitals at the micro level have not been measured, but at the macro level, improving quality can potentially positively impact financial performance. Hospital policies and procedures regarding prevention of HAIs should be made easy and accessible for staff to follow. Policies that financially incentivize investment in prevention of healthcare associated infections would motivate hospitals and healthcare administrators to implement prevention protocols with rigor. In conclusion, HAIs are responsible for several thousands of deaths every year, and also incur huge costs to hospitals, representing a financial burden on our healthcare system. Due to their expensive nature, HAIs impact financial performance of hospitals negatively. Current policies ensure that hospitals report HAI rates, and there are federal pay for performance measures that do not allow Medicare to pay higher for those patients who had HAIs. Current policies and certain revisions in these policies are expected to assist hospitals and administrators with managing financial performance in a better way. Further and more rigorous financial evaluations of HAIs will provide deeper insights into the relationship of hospital quality and financial performance.
Limitations
Our study has numerous limitations that need to be noted. Our study was limited to 3 years of data, 2014 to 2016. As we evolve from the first days of non-payment for never events more than a decade ago, hospitals could well be continuously evolving toward a new equilibrium on the levels of HAIs and associated structures and expenses associated with infection control. The interruption or enhancement of this evolution associated with COVID-19 will likely be the subject of future examination.
Our study was based on analyses of secondary data, which can result in bias related with lack of validity. Data on infections is self-reported by hospitals and may not be completely accurate, thus affecting the generalizability of findings from this study. Future researchers should base their assessment of HAIs’ association with impact on financial performance using primary data collection. Smaller studies based on hospital’s internally reported infection rates can also be examined in relation to their financial performance to get a more specific idea of how the infection rates affect profitability indicators. Detailed studies may also shed light on whether any up-coding of patients is occurring that may mask infection rates.
Our study was based on hospital cost reports that present the total results of operations, potentially missing the nuance of detailed cash flow data. 30 Infections may be associated with 3 disruptions in cash flows. First, higher expenses associated with treatment of HAIs without corresponding revenues could be associated with lower operating margins. This is anticipated to be the dominant disruption, yielding the types of results presented here. Second, HAIs can be associated with penalties from payers that result in additional deductions from revenues or expenses that affect a line of cash flow. A payer may have the ability to reduce by some percentage all payments for hospitals that fail to meet standards. Third, HAIs may be associated with marking or bargaining disadvantages that reduce market share or payment levels in payer contracts. Every administrator’s nightmare is a sentinel event or report of unsafe conditions that disrupts operations.
Available data on control variables also limited the explanatory power of the analysis. For example, only government payer mix is readily available. This does not account for the variation in payer mix on the commercial side. The combination of various managed care contracts can influence health care use and costs and therefore profitability. 31
Methodologically, our study presents an association between HAIs and profitability with no ability to depict a causal relationship. Regressions of the profit (dependent) versus HAIs (independent) model yielded the results in Tables 2 to 4. Regressions of the HAIs (dependent) versus profit (independent) model (not presented) did not yield statistically significant results. Similarly, alternative models with lagged values of variables did not yield significant results that might offer explanations beyond the contemporaneous associations. This analysis lacks appropriate instruments that would identify the relationship beyond just an association. Future setting where HAI control programs are selectively mandated or where insurers selectively implement HAI penalties may present opportunities for identifying the relationship in a manner that permits a discussion of causation rather than association.
Footnotes
Declaration of Conflicting Interests
The author(s) declared no potential conflicts of interest with respect to the research, authorship, and/or publication of this article.
Funding
The author(s) received no financial support for the research, authorship, and/or publication of this article.
Our study did not require an ethical board approval because we used only publicly available secondary data for this study.