
Abstract
To examine macronutrient intake among under-five children, which is cost-effective, reliable, and validated by regional food choice and availability, we developed a new Semi Quantitative-Food Frequency Questionnaire (SQ-FFQ). We validated the Sleman Under Five Children SQ-FFQ (SUFS) compared to the 3-time 24-hour recalls (24HR) and conducted reliability tests between the first and second SUFS interviews. This study included 102 under-five children. All tests were conducted for the “12-35 months” and “36-59 months” groups. Compared to 24HR using Pearson’s Correlation Coefficient, Spearman’s Correlation Coefficient, Bland Altman plots, Cross Classification and Limits of Agreement (LOA), the SUFS was valid but significantly overestimated the macro-nutrient consumption. The reliability test results using the Interclass Correlation Coefficient and Cronbach’s alpha showed moderate to good reliability (ICC and α ranged from .6 to .9), and a high correlation using Spearman’s Correlation Coefficient (rho:.42-.89). The SUFS is valid compared to the 24HR and reliable for assessing macronutrient consumption for children under five.
Malnutrition is still a crucial problem, especially in low-middle-income countries. To evaluate the consumption patterns of under-five children, we need a cost-effective, reliable, and validated food consumption assessment. SQ-FFQ is appropriate for population studies; however, it needs to be adjusted and validated to reflect the study population.
SUFS can assess macronutrient intake in children aged 12 to 59 months. SUFS is valid compared to the 24HR and reliable for assessing macronutrient consumption in both age groups (12-35 months and 36-59 months) in the Sleman Regency. Nevertheless, we considered the SUFS overestimates the average value of the 3-time 24HR.
It is essential to conduct a pilot study to adjust the food and beverage list with the current eating culture before conducting a food assessment using the SQ-FFQ.
Introduction
Children’s early life is a crucial period when they experience rapid growth and development. Accordingly, the nutritional needs of under-five children depend on their developmental stage.1,2 Children ages 12 to 35 months shift from breastfeeding and complementary feeding to consuming daily family foods. 3 During this period, it is necessary to pay attention to the lack of dietary diversity, low feeding frequency, ultra-processed food consumption, and the food and beverages with high sugar content intake. In the next stage (36-59 months), they adjust their diet according to their family’s food. In this period, the primary concerns are unhealthy dietary habits, including excessive sugar, salt, fat intake, as well as ultra-processed foods. 1 It is vital to ensure that children’s daily nutritional needs are adequately met. Prior studies have reported that malnutrition in under-five children is associated with lower development of some abilities and skills, including cognitive abilities and motoric skills.4,5
Worldwide, 1 in 3 under-five children live with malnutrition, threatening their development and survival.1,6 In 2018, 13.8% of children aged 0 to 59 months in Indonesia were malnourished. 7 In 2019, among provinces in Indonesia, the prevalence of under-five protein-energy deficiency (PED) in the Special Region of Yogyakarta was at an average of around 13.0%. 7 On the regency level, the highest PED prevalence was in Kulon Progo Regency (9.89%), followed by Bantul Regency (8.62%), Yogyakarta City (8.46%), Sleman Regency (8.17%), and Gunung Kidul Regency (7.18%). 8
There are various methods of food consumption assessment, including the Food Frequency Questionnaire (FFQ), 24-Hour Recalls (24HR), Food History, Estimated Food Record, Weighed Food Record, and Duplicate Meal Method. 9 Each food consumption assessment has its pros and cons; additionally, it may be applied differently for each study according to the study design and available resources.9,10
Most ideal food assessments for children under five must be able to capture broad food diversity, suitable for food availability, and respondent comfortability is still a priority. At 12 to 59 months, children are in the stage of learning to eat at home with parents, siblings, and caregivers; moreover, some of them also experience eating in schools or with friends. This condition may increase the risk of inadequate diets, lack of dietary pattern diversity, low feeding frequency, eating processed food, and drinking sugar-sweetened beverages. 1 Nowadays, there is shifting in food consumption patterns in South-East Asia, especially in Indonesia. Some people adopt western-style and franchise fast food as a snack or recreational food in urban areas. On the other hand, rural area populations still maintain traditional food patterns. More diverse food is expected to be consumed in urban areas due to food availability and purchasing power. 11 Thus, food assessment must comply with several criteria, such as: being able to capture a range of dietary food patterns, different preparation methods, no need for multiple day recalls, low respondent burden, not relying on literacy and numeric skills, can be self-administrated, simple, inexpensive, no need for trained interviews, and appropriate for a large study. 9
A cost-effective, reliable, and validated food consumption assessment is needed to assess the consumption patterns of children under five in a population setting. The Semi-Quantitative Food Frequency Questionnaire (SQ-FFQ) is appropriate for extensive studies, despite being adapted and validated to reflect the original study population. However, SQ-FFQ includes a long list of foods and beverage types, which need to be adjusted to represent the food and beverages commonly consumed by the population assessed. 9 Several studies have used the SQ-FFQ to measure macronutrient intake among certain age groups. The SQ-FFQ has been validated in many adult populations, has shown good validity12-14 and is reliable.13,15 A few studies have also conducted SQ-FFQ in children’s populations. To estimate an intake of a wide variety of food groups, the SQ-FFQ may be a suitable method.10,16 In Indonesia, there are diverse sources of food and dishes. The food choices and availability may differ in other countries and even within Indonesia’s diverse regions.17,18 Only a few studies have validated the SQ-FFQ in Indonesia, including assessing the validity and reliability for the under-five children populations.
In Sleman Regency, Indonesia, there is a research platform that aims to monitor social, demographic, economic, and health conditions, namely Sleman Health and Demographic Surveillance Systems (Sleman HDSS), which was initiated by the Faculty of Medicine, Public Health and Nursing, Universitas Gadjah Mada in collaboration with the Sleman Regency District Health Office. Sleman HDSS has interviewed 5147 households since 2015 and updates its data annually. 19 The HDSS platform is beneficial for monitoring maternal and child health conditions in low-income countries. 20 Therefore, it is necessary to monitor and evaluate under-five nutrient intake in Sleman Regency to ensure that they receive sufficient macro-and micro-nutrients according to age.
We developed a new SQ-FFQ, Sleman Under Five Children SQ-FFQ (SUFS), which is suitable for Indonesia’s under-five children in the Sleman HDSS platform. It is necessary to test the SUFS to measure the consumption of children under-five in Sleman Regency with other more accurate methods, in this case, using 24HR. Accordingly, this study aimed to develop the new SQ-FFQ, which contains a list of foods and beverages adjusted by actual consumption. Then, we conducted the validity and reliability tests against a gold-standard method, namely 24HR in the under-five children’s populations (12-35 months and 36-59 months).
Methods
Data Collection
Stage 1
We developed a new SQ-FFQ that is concise and only includes foods and beverages typically consumed by the under-five children in the Sleman Regency. Stage one aimed to adjust the list of foods and beverage items in the SQ-FFQ from the previous research. 21 We conducted face-to-face interviews with 30 primary caregivers using an SQ-FFQ comprising 260 food and beverage items. For each item in the SQ-FFQ, respondents reported the frequency of consumption (per day, week, or month) and the portion size per meal (in grams and/or in standard household portion units, eg, cup or tablespoon). Later, we examined all lists of respondents’ frequently consumed foods to perform content validation involving 2 experts. Those 2 experts were lecturers from the Nutrition and Health Department, Universitas Gadjah Mada. They have a nutritional education background, research interest in nutritional intake, as well as more than 10 years of experience in nutrition assessment. They eliminated foods and beverages that are rarely consumed; hence, the questionnaire became more suitable for the age groups culture, food diversity, and availability.
Stage 2
This study is nested research in the Sleman Health and Demographic Surveillance System (Sleman HDSS), a longitudinal population study conducted through routine demographic and health monitoring in Sleman Regency, Special Region of Yogyakarta, Indonesia. 19 There were 1233 under-five children in the reported population in Sleman HDSS in December 2019, we used the difference between the 2 correlations formula to determine the minimum sample size, and we calculated the minimum sample size required accordingly. 22 Based on those calculations, this research needed 93 respondents, with an additional 25% of respondents to anticipate non-responsive respondents or dropouts. Respondents of the present study were the primary caregivers of under-five children from Sleman HDSS households selected using multi-stage cluster random sampling. In the first sampling step, 3 sub-districts (ie, Depok, Ngaglik, and Mlati) were randomly selected from 17 sub-districts in Sleman Regency. Then, we interviewed 115 respondents from the selected sub-districts for the first interview.
We conducted fieldwork interviews from December 2019 to January 2020. Six trained nutritionists visited each primary caregiver for a series of face-to-face interviews. In the series, the same interviewer interviewed the same respondent. During the first visit, we questioned them about the socio-demographic and food intake data using SUFS, followed by a 24-h recall. The 24HR also gathered the declared mealtime and portion size information for each food and beverage type. To help respondents recall the portion size, the interviewer used the Indonesian food and beverage portion book during the SUFS and the 24HR recall interviews. 23 Each interview session took around 30 to 60 min to complete. All data were documented on the paper version of the questionnaire, and all interviews were audio recorded. To avoid missing data in the reports, the interviewers used recorded audio to crosscheck the information during the entry data process. Next, all data were transferred to Excel documents and merged with the macronutrient information database. The SUFS questionnaire is available in the Supplemental Material (Supplemental Material 1).
We conducted the SUFS interview 2 times over 4 weeks, while the 24-h recall interview was done 3 times with 2-week intervals between interviews. These intervals aimed to capture food intake daily variation in the 24-h recall, both during weekdays and weekends. For instance, if the first visit was made between Tuesday and Saturday, we considered the data collected as the weekday intake, and the next visit would be on Sunday or Monday to capture the weekend intake. Only 102 respondents completed the SUFS interviews twice and 24HR interviews 3 times (Figure 1).

Design of the SUFS validation study.
Variables
Macronutrients
The amount of food consumed was reported in household measures and then converted into daily consumption (in grams). Energy, protein, fat, and carbohydrate intake were generated based on the Indonesian Food Ingredients Composition. 24 The first and second SUFS interviews represented daily food consumption within the last month. The 24HR was obtained from the average daily consumption between the 3 times 24HR interviews.
Subject Characteristics
Sex was dichotomized as male and female. Birth weight was divided into 2 groups, ≥2500 g and <2500 g. Mother and father’s highest education attainment were categorized as low (never schooled or until they reached junior high school), middle (senior high school), and high (college and university). The mother’s employment status was classified as employed and unemployed. We divided the number of family members into 2 groups, which were 3 to 5 family members and >5 family members.
Statistical Analysis
Because there are differences in nutritional requirements across age groups, we performed separate statistical tests for the 2 age groups: 12 to 35 months and 36 to 59 months. We conducted validity tests to determine the difference between the first SUFS interview and the average 3 days-24-h recalls. The validity tests were conducted using mean and percentage difference, Pearson’s Correlation Coefficient, Spearman’s Correlation Coefficient, Bland Altman plots, Cross Classification and Limits of Agreement (LOA). Pearson’s Correlation Coefficient and Spearman’s Correlation Coefficient tests measured the level of relationship between the 2 data. A positive significance value showed that the data were positively correlated. We also observed the validity from the r-value/correlation value with a minimum acceptable value of .3.
The cross-classification test determined the value of each nutritional intake data’s first to the third quartile based on age group. This test was used to evaluate the ability of SUFS to rank the nutrient intakes into quartiles, compared to the 3-day 24HR. Then, the data were classified into 4 categories: (i) same quartile; (ii) adjacent quartile; (iii) one quartile apart; and (iv) extreme quartile (grossly misclassified). The Bland-Altman plots method determined the agreement between 2 variables using a graph. In this analysis, we plotted the difference in nutritional intake using the first SUFS interview with an average of 24HR. The straight line in the middle shows the mean of difference. The dotted line above and below the mean difference line is called the LOA, which is defined as the mean difference ±1.96 standard deviations (SD). Thus, based on the SD, we defined the a priori acceptable limits as 90 to 100. 25
The reliability test was conducted between the first and second SUFS interviews. The reliability test aimed to cross-check the test-retest reproducibility through the mean percentage differences between the 2 data, Pearson’s/Spearman’s correlation, Inter class correlation (ICC), and Cronbach’s alpha. All statistical calculations were performed using SPSS Statistics 25.0. 26
Ethical Consideration
The Medical and Health Research Ethics Committee (MHREC) of the Faculty of Medicine, Public Health and Nursing, Universitas Gadjah Mada, approved all research procedures with the approval number: KE/FK/0526/EC/2019. Respondents received information about the research procedures and signed the informed consent form to participate in the study.
Results
Stage 1
Based on the content validation done by experts, we eliminated the foods rarely consumed by respondents. This step aimed to adjust the SUFS to suit current conditions based on age groups, culture, food diversity, and availability. The SUFS included the food and beverage items reported consumed by a minimum of 36.7% of respondents. The SUFS comprises 89 food and beverage items divided into 9 categories: sources of carbohydrates, animal protein, nuts and legumes, vegetables, fruits, cakes, fast food, dairy products, and beverages.
Stage 2
One hundred fifteen (n = 115) respondents agreed to participate. As many as 13 respondents (11%) were excluded due to loss to follow-up (4 participants) and refusal to continue participating (9 participants). Only 102 respondents completed the serial interviews (61 children aged 12-35 months and 41 children aged 36-59 months). There were no differences in subjects’ characteristics, including sex, birth weight, parents’ characteristics (age, education, and occupational status), residential areas, number of family members, nor the household wealth index between the 2 age groups (see Table 1). The mean and SD between the first SUFS interview and the 24HR mean are shown in Table 2.
Respondent Characteristics.

Note. Numbers in the table represent means ± standard deviations (SD) for continuous variable and n (%) for categorical variable.
Validity Test Results with Mean ± Standard Deviation, Mean Difference and Pearson/Spearman’s Correlation (r) Macronutrient Intake, Cross Classification, and LOA Using First Sleman Under Five Semi-Quantitative Food Frequency Questionnaire (SUFS) and 3-Day 24-Hour Recalls (n = 102).
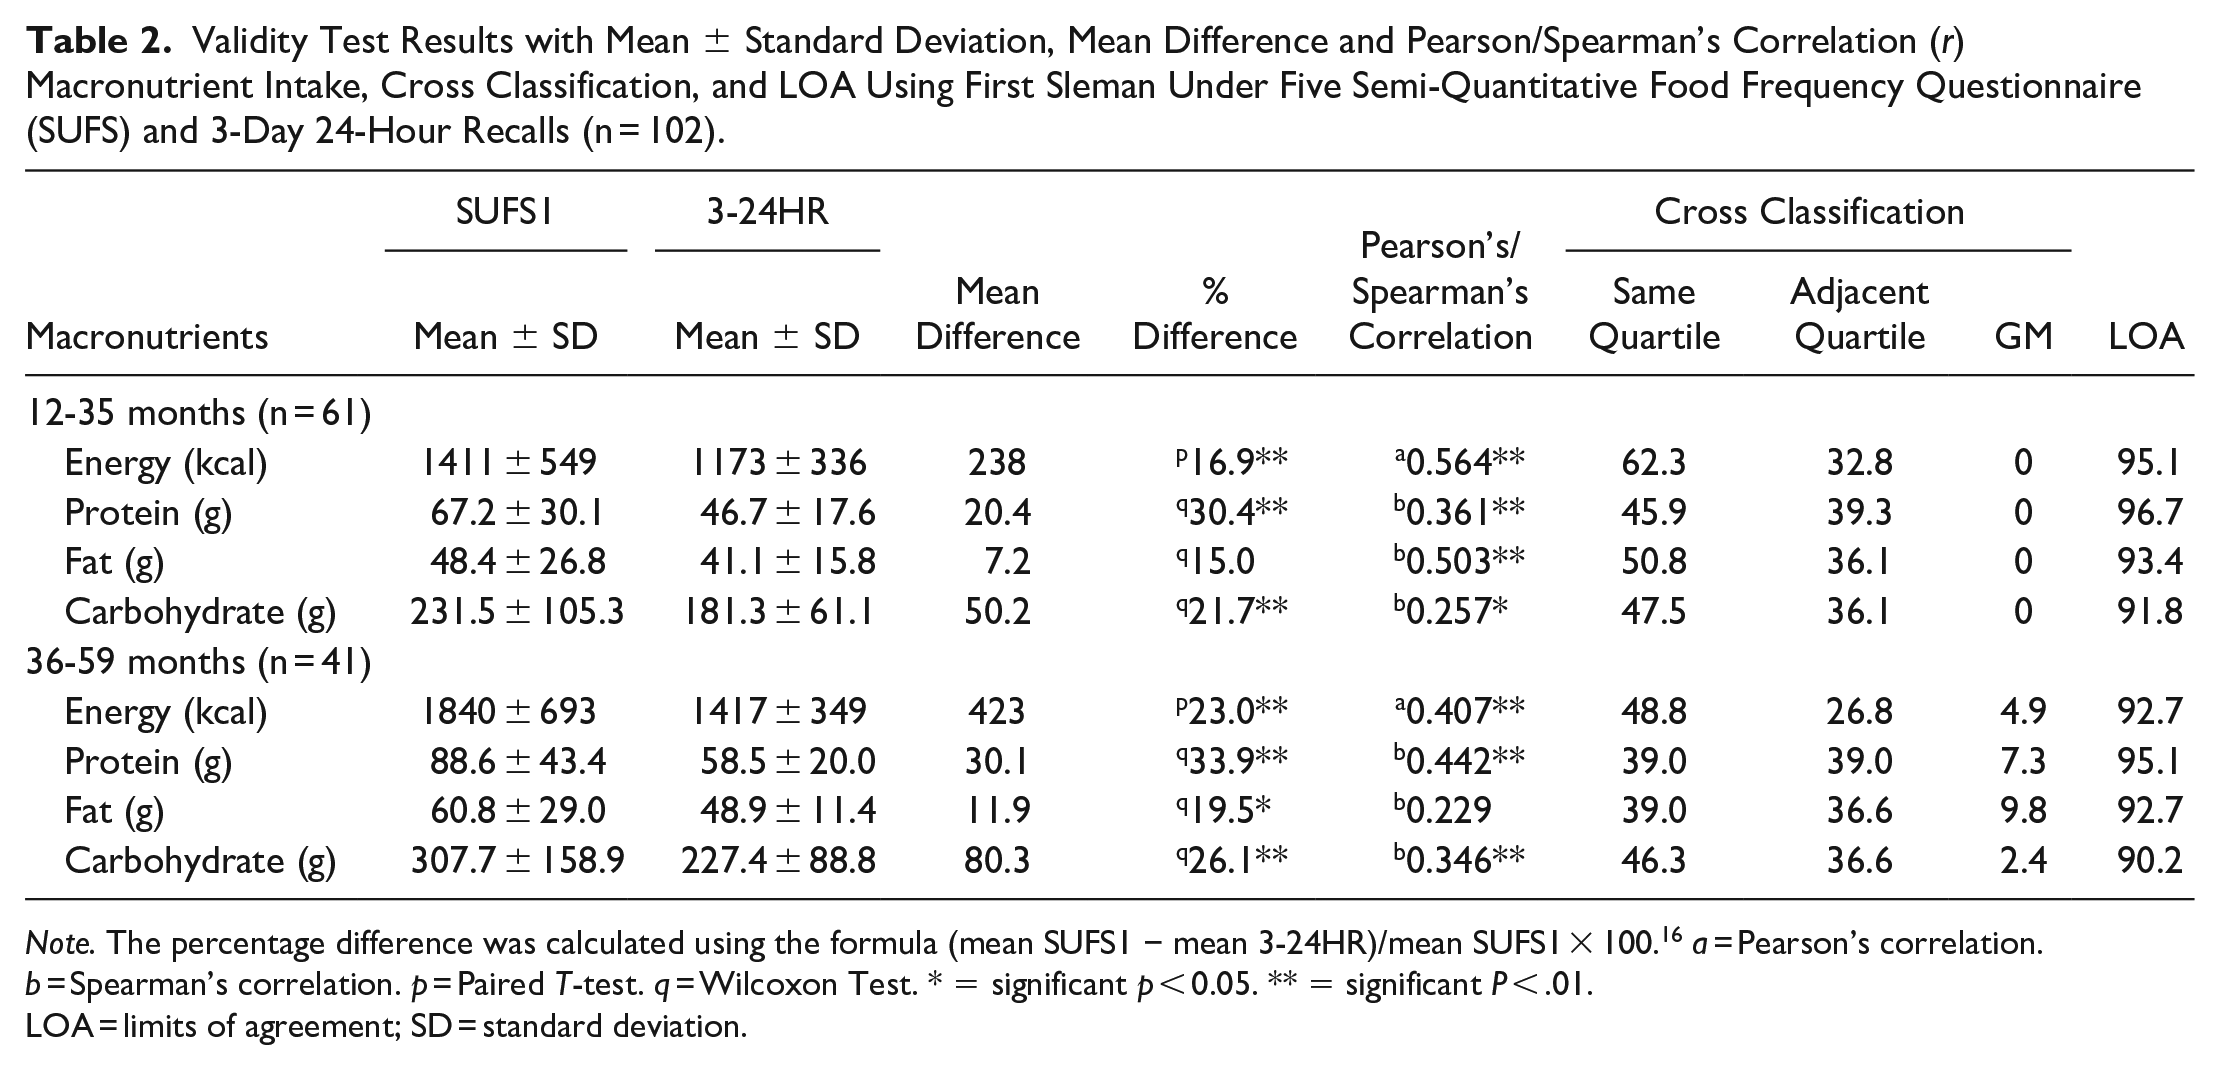
Note. The percentage difference was calculated using the formula (mean SUFS1 − mean 3-24HR)/mean SUFS1 × 100. 16 a = Pearson’s correlation. b = Spearman’s correlation. p = Paired T-test. q = Wilcoxon Test. * = significant p < 0.05. ** = significant P < .01.
LOA = limits of agreement; SD = standard deviation.
Validity test
The validity test results showed a significant difference between the nutritional intake measured using SUFS and the average 3 times 24HR, except for fat intake in the 12 to 35 months age group. The percentage difference value was above 15%; however, it was higher in the 36 to 59 months age group. The Pearson/Spearman correlations showed that the SUFS and 24HR were positively correlated with an r value over .25, except for fat intake in the 36 to 59 months age group. The coefficient correlation for fat intake was .229 and was not significantly correlated. Previous studies suggested the cut-off points of coefficient correlation ranged from (r > .3 or .4) 27 and (.4 < r < .7). 28
The cross-classification analysis is presented as the percentage agreement (same and adjacent quartile) and the percentage of grossly misclassified (GM). Over 39% of the subjects were classified in the same quartile based on the cross-classification analysis. The GM values in the 12 to 35 months group were 0 in all macronutrients. In the 36 to 59 months group, the overall GM value ranged from 2.4% (carbohydrates) to 9.8% (fat). In addition, the LOA range for the 12 to 35 months group was around 92 to 97, while for the 36 to 59 months group, it was approximately 90 to 95. Both LOA ranges for each group are within the a priori acceptable limits of 90 to 100. Figures 2 and 3 showed that the Bland-Atman procedure demonstrated a positive mean difference for energy and macronutrients, even though the SUFS overestimates compared to the 3 times 24HR.

The Bland Altman plot is for children aged 12 to 35 months old. Bland Altman plots aim to assess the dietary intake of 12 to 35 months old children using the first administration of SUFS and the mean of 3 times 24HR with each macronutrient’s intake: (a) energy intake, (b) carbohydrate intake, (c) protein intake, and (d) fat intake. The solid line represents the mean difference between the first SUFS interview and 3 times 24HR, and the dashed lines represent the limits of agreement (LOA) corresponding to ±1.96 (SD).

The Bland Altman plot is for children aged 36 to 59 months old. Bland Altman plots aim to assess the dietary intake of 36 to 59 months old children using the first administration of SUFS and the mean of 3 times 24HR with each macronutrient’s intake: (a) energy intake, (b) carbohydrate intake, (c) protein intake, and (d) fat intake. The solid line represents the mean difference between the first SUFS and 3 times 24HR, and the dashed lines represent the limits of agreement (LOA) corresponding to ±1.96 (SD).
Reliability Test Results With Mean ± Standard Deviation, Mean Difference, Interclass Correlation Coefficient (ICC), Cronbach’s Alpha, and Pearson/Spearman’s Correlation (r) Macronutrient Intake Using First and Second Sleman Under Five Semi-Quantitative Food Frequency Questionnaire (SUFS).

Note. a = Pearson’s correlation. b = Spearman’s correlation. p = Paired T-test. q = Wilcoxon Test.
= significant P < .01; SD, standard deviation.
Reliability test
The interclass correlation coefficient (ICC) between the 2 SUFS interviews was significant for both groups’ macronutrient intake, with ICC and Cronbach’s alpha ranging from .6 to .9 (see Table 3). Meanwhile, there were no significant differences in nutrient intake assessment between the first SUFS and second SUFS interviews, except for energy intake values in the 36 to 59 months age group. The percentage differences ranged from 0.8% (fat) to 6.6% (carbohydrates) in the 12 to 35 months age group and 5.0% (carbohydrate) to 8.1% (protein) in the 36 to 59 months age group. Pearson/Spearman correlation values ranged from .72 (carbohydrates) to .89 (energy) in the 12 to 35 months age group and .42 (fat) to .62 (carbohydrate) in the 36 to 59 months age group.
Discussion
Based on the various tests, the SUFS is valid compared to the average of 3 times 24HR in assessing macronutrient consumption for both age groups (12-35 months and 36-59 months) in the Sleman Regency. The SUFS was overestimating all macronutrients over the average of 3 days 24HR. Other studies also reported an overestimation in SQ-FFQ compared to 24HR.16,29,30 The probable explanation for this overestimation was that parents tend to find portion estimation difficult.30-32 In this study, we used a pre-printed portion book to help primary caregivers estimate the food the child consumes. However, the food consumed is usually a small portion, not a whole portion, as shown in the form or portion book. The SUFS has around 18% differences in protein and carbohydrate estimate intake compared to 24HR. Previous studies have also demonstrated that SQ-FFQ can catch food intake missed by the 24HR 31 and in ranking nutrients intake. 33 The reasonably extensive list of protein and carbohydrate food sources is in line with the high average consumption of protein and carbohydrate sources, showing that the SQ-FFQ can capture high consumption of those that may be missed by 24HR.
The coefficient correlation between our SQ-FFQ and 3 times-24HR is low in both age groups (.23-.56). Several studies also reported a low coefficient correlation (.25-.62).29,34 Low correlation on fat can be caused by adding oil during cooking and processed foods that cannot be adequately measured, according to Allan et al in 2021. 33 The correctly classified value showed positive results in both age groups, which were higher than in the previous studies.16,34 The grossly misclassified (GM) values have satisfactory results. Masson et al suggested that a GM value below 10% is acceptable in conducting the SQ-FFQ validity test. 35 Hence, the SQ-FFQ has good validity in assessing nutritional intake in children aged 12 to 59 months.
We conducted the reliability test between the first and the second SUFS interviews. The ICC and Cronbach’s alpha showed medium-good reliability with a higher result in the 12 to 35 months group. Only the carbohydrate intake indicated good reliability in the 36 to 39 months group, even though the SUFS has the same or relatively higher reliability than other research.29,36 There was no significant difference between nutrient intake measured using the first SUFS and the second SUFS interview, except for energy in the 36 to 59 months group. The correlation test showed a positive correlation between both SUFS interviews. The correlation coefficient value is entirely satisfactory and met the cut-off Cade and Willet determined (all above .4).27,28 Thus, the SUFS has good reliability.
The strength of this study is that we conducted the first validity and reliability SQ-FFQ tests in the Sleman Regency under-five children population. Furthermore, we performed the present study with Sleman HDSS, representing the under-five children population in residential areas (urban and rural) in Sleman Regency. All interviewers were trained nutritionists, and we conducted a routine discussion in order to synchronize our perceptions. We also developed a new SQ-FFQ (the SUFS) that contains a list of the most commonly eaten foods in the study population. The new list will minimize underestimation, can be done in limited resources research on a large sample, and be more appropriate to the culture.
Despite several strengths, this study has several limitations. First, this study does not use the weighed food record, which is the gold standard. We decided not to use weighted food records because it would be more burdensome for respondents and limited research resources.33,37 Further, the weighed food records require several special conditions to be implemented correctly to produce reliable data, such as respondents having good literacy, numeric skills, being highly motivated, having a supportive environment, and dedicated to particular times. 9 However, 24HR was widely used in previous studies to measure the validity and reliability of the SQ-FFQ. Second, we took 2 measurements during a 1-day interview. On the first and third visits, we interviewed respondents using the SUFS and 24HR. It may cause the primary care givers to feel burdened and exhausted, reducing respondents’ attention in the interview process. 33 Third, there was confusion about the children’s portion size.33,38 Fourth, there is still a possibility of consuming breast milk for over 12 months old children. This study did not collect breast milk consumption information because of the difficulties in collecting data on the amount consumed. 39 Lastly, this study utilized a specific population; consequently, the list of available foods must be adjusted if SUFS will be applied to other populations.
Conclusions
The Sleman Under Five SQ-FFQ (SUFS) comprises 89 food and beverage items. It is valid compared to the 24HR and reliable for assessing macronutrient consumption for the 12 to 35 months and 36 to 59 months groups’ populations in the Sleman Regency. In the future, SUFS needs to be validated on a larger children population (such as the Special Region of Yogyakarta) with the gold standard food intake assessment, which is a weighed food record. We believe conducting a pilot study to evaluate the food and beverage list is essential. This pilot study aimed to adjust the list with the current eating culture before conducting a food assessment.
Supplemental Material
sj-docx-1-inq-10.1177_00469580231152323 – Supplemental material for The Valid and Reliable Semi-Quantitative Food Frequency Questionnaire among the Sleman Under Five Children
Supplemental material, sj-docx-1-inq-10.1177_00469580231152323 for The Valid and Reliable Semi-Quantitative Food Frequency Questionnaire among the Sleman Under Five Children by Yayuk Hartriyanti, Nikita Dika Melindha, Ratri Kusuma Wardani, Aviria Ermamilia and Septi Kurnia Lestari in INQUIRY: The Journal of Health Care Organization, Provision, and Financing
Supplemental Material
sj-docx-2-inq-10.1177_00469580231152323 – Supplemental material for The Valid and Reliable Semi-Quantitative Food Frequency Questionnaire among the Sleman Under Five Children
Supplemental material, sj-docx-2-inq-10.1177_00469580231152323 for The Valid and Reliable Semi-Quantitative Food Frequency Questionnaire among the Sleman Under Five Children by Yayuk Hartriyanti, Nikita Dika Melindha, Ratri Kusuma Wardani, Aviria Ermamilia and Septi Kurnia Lestari in INQUIRY: The Journal of Health Care Organization, Provision, and Financing
Supplemental Material
sj-docx-3-inq-10.1177_00469580231152323 – Supplemental material for The Valid and Reliable Semi-Quantitative Food Frequency Questionnaire among the Sleman Under Five Children
Supplemental material, sj-docx-3-inq-10.1177_00469580231152323 for The Valid and Reliable Semi-Quantitative Food Frequency Questionnaire among the Sleman Under Five Children by Yayuk Hartriyanti, Nikita Dika Melindha, Ratri Kusuma Wardani, Aviria Ermamilia and Septi Kurnia Lestari in INQUIRY: The Journal of Health Care Organization, Provision, and Financing
Footnotes
Acknowledgements
This paper uses primary data collected by Sleman Health and Demographic Surveillance System (HDSS). The Faculty of Medicine, Public Health and Nursing, Universitas Gadjah Mada, Yogyakarta, Indonesia, has primarily funded the Sleman HDSS data collection.
Declaration of Conflicting Interests
The author(s) declared no potential conflicts of interest with respect to the research, authorship, and/or publication of this article.
Funding
The author(s) received no financial support for the research, authorship, and/or publication of this article.
Ethical Approval
Sleman HDSS received ethical approval from the Medical and Health Research Ethics Committee of the Faculty of Medicine, Public Health and Nursing, Universitas Gadjah Mada (KE/FK/0526/EC/2019).
Informed Consent
Written consent was obtained from Sleman HDSS’ respondents after they received an explanation regarding the objectives, design, and procedure of the study. They were also informed that their responses are confidential and that they could withdraw their participation from this study anytime.
Supplemental Material
Supplemental material for this article is available online.
References
Supplementary Material
Please find the following supplemental material available below.
For Open Access articles published under a Creative Commons License, all supplemental material carries the same license as the article it is associated with.
For non-Open Access articles published, all supplemental material carries a non-exclusive license, and permission requests for re-use of supplemental material or any part of supplemental material shall be sent directly to the copyright owner as specified in the copyright notice associated with the article.