
Abstract
This study estimates the financial burden of healthcare in Korea using the National Survey of Tax and Benefit panel data from 2009 to 2019. The sum of a household’s premium and out-of-pocket medical expenses defines the household financial burden of healthcare. We find that the household financial burden is regressive to income. We also find that the high burden household whose financial burden is over 10% of their household income accounts for about 30% of total household. This result suggests that equity in contribution to healthcare finance does not work well in Korea, which chose the universal health system that emphasizes the progressive contribution by income to medical finance.
The financial burden of healthcare accounts for a large portion of household income in the USA.
This study provides new evidence on the financial burden of healthcare in a country with compulsory health insurance.
This study finds that household financial burden is regressive to income even under the universal health insurance system. Whether in the United States or Korea, public health insurance alleviates the financial burden of healthcare for low-income families but seems to be insufficient to create an income-progressive financial burden. The regressive nature might be eased by a policy to secure sufficient financial resources to alleviate the burden of medical expenses on the low-income families.
Introduction
WHO stresses that 930 million people spend more than 10% of their household income on medical expenses, emphasizing that the introduction of universal health insurance could be the solution. 1 Korea has operated the compulsory National Health Insurance since 1977, and Koreans have hedged the financial risk of healthcare as a result to some degree. Nevertheless, medical expenses have skyrocketed, and households passed the burden on. As medical costs increased, both uncovered medical services and premiums became a greater encumbrance. In such a matter, the financial burden of healthcare is defined as the sum of medical expenses not covered by the insurance and the premium. Regardless of the effort to alleviate medical costs by introducing universal health insurance, the financial burden accounts for a large portion of household income.
Understanding the trend in the financial burden of healthcare could be significant in that it can lead to an increase in household debt and household insolvency.2,3 The high financial burden of healthcare can be a barrier to medical use and increased medical loads cause families to delay or give up on medical use. These concerns could belong to the insured if the financial burden of healthcare is high. 2
This study analyzes 3 perspectives of medical expenses in Korea. First, the trend of total household payments to finance health care from 2009 to 2019 is examined. Secondly, by estimating payments as a percentage of household income, this study debates whether universal health insurance adequately covers the household financial risk. Finally, the purpose of this study is to examine the ratio of medical expenses to household income by national health insurance subscriber type and quintile income and to determine whether households’ medical burden is regressive or progressive.
Most studies on the financial burden of healthcare in Korea have focused only on medical expenses, not on the premium burden. On the other hand, U.S. studies measure the financial burden of households for medical care by combining health insurance premiums and medical expenses. For example, Carman et al 4 estimates the total medical expenditures of US households in 2015 and the dollar value of health care received. The total cost is calculated using premiums, and out-of-pocket payments added.
One of the reasons that studies in Korea do not include the premium burden is the unavailability of the premium data. National Health Insurance Corporation does not provide specific data manifesting individual premiums. Therefore, this study will calculate the financial burden of healthcare using the National Survey of Tax and Benefit (NaSTaB) panel data from 2009 to 2019, the only data that surveys the National Health Insurance premium.
This study is organized as follows. Section 2 describes health system in Korea. Section 3 describes the data and research methods. Section 4 presents the findings. Implications and conclusions are presented in Section 5.
Understanding Health system in Korea
Korea’s National Health Insurance is adopted from the Japanese, which is rooted in Germany’s employment linked social insurance program.5,6 The employees are enrolled in National Health Insurance through their workplace, and the self-employed or those who do not have a job are enrolled compulsorily as local subscribers.
Premiums are calculated separately for employee subscribers and local subscribers. Employees and their employer each pay half of the amount calculated according to the insurance premium rate set by the National Health Insurance Corporation (NHIC) from the employee’s salary and wage income in the form of withholding tax from their salary. On the other hand, local subscribers’ premiums are calculated with their “contribution points,” which is set by NHIC. Contribution points are calculated based on personal income (interest income, dividend income, business income, earned income, pension income and other income) and property (land, buildings, houses, cars, ships, and aircraft). 7 In recent years, NHIC is trying to expand the local subscribers by applying stricter eligibility to the employee subscribers’ dependent in order to secure their financial sources.
The collected premiums from employee subscribers and local subscribers have been managed in the same premium fund pool since the National Health Insurance reform in 2000, the biggest difference from the Japanese National Health Insurance and Germany’s sickness fund that use separated fund pools with a similar principle to earmarked tax. According to Buchanan, 8 earmarking allows the public to choose a specific public service that can accurately recognize cost and profit while general-fund financing (non-earmarking) is like selling the “bundle” of public service similar to a specific tie-in sale. For this reason, the Korean National Health Insurance has a structure with a high possibility of income redistribution from the healthy to the unhealthy, from high-income to low-income, and from the employee subscribers to local subscribers. Accordingly, the issue of the fairness of insurance premium calculation is constantly being raised, and in 2013, a unified income-based insurance premium calculation policy, in which the local subscriber’s premiums are also based on their incomes, not their property, was pursued regardless of the type of subscription, but pending until now. 9
In the perspective of medical delivery, subscribers rarely have a restriction on choice of physician and hospitals. There are 3 types of settings: independent clinics with small inpatient wards, small hospitals with inpatient and outpatient departments, and larger public and private hospitals with outpatient and inpatient departments and salaried physician staff similar to in Japan. 5 There is a phenomenon unique to Korea such as the concentration of the patients in large hospitals in Seoul and reputed doctors because patients are free to choose hospitals.
In the perspective of the payment system, in 2012, the compulsory diagnosis-related group (DRG) was enforced for 7 diseases among clinics and hospitals. And in 2013, it was applied to general hospitals and tertiary hospitals while NHIC has adopted a fee for service (FFS) as the payment system since its establishment. Physicians and hospitals have incentives to provide more medical supplies that result in unnecessary medical services as these costs are fully reimbursed if they supply the medical services. 10 In addition, no follow-up monitoring is done by the NHIC for medical services not covered at all by National Health Insurance. This aggravates the incentive to provide excessive medical treatment with high priced medical equipment to generate profit or to compensate for the low profit in the covered medical services by NHIC.
As in the Figure 1 which shows the financing source of healthcare in Korea national health account, the portion of out-of-pocket in the non-covered medical services by NHIC had accounted for around 20% out of total medical spending until 2017, but it has recently reduced at around 17% of total medical spending. 11 It may be because of president Moon’s government launching the policy for resolution and elimination of non-covered medical services by NHIC in 2017. It may expand the portion of NHI spending for health care but aggravate the burden of National Health Insurance premium burdens.

The portion of Korean medical expenses by financial sources from 2009 to 2020.
In the perspective of the private financial burden for healthcare spending, the portion of private parts consisting of voluntary private health insurance spending and out-of-pocket medical expenses for both non-covered and covered medical services by NHIC has kept accounting for around 40% of total medical spending since 2009 while the composition ratio of private health insurance and out-of-pocket medical expenses has been changed. 11 Based on this fact, this study raises the question of whether the National Health Insurance allows the public to use medical care at an affordable level and how much financial burden relative to income at the household level is.
Data and Method
Data
This study investigates the household financial burden of healthcare from 2009 to 2019 using the National Survey of Tax and Benefit (NaSTaB) panel data. The NaSTaB has been collected from 5634 households and their family members living in 15 metropolitans and provinces across the country (excluding Jeju and other islands) by the Korea Institute of Public Finance since 2008. Its purpose was to identify tax burden and benefits from the government and analyze the fairness of burden, benefits, and income redistribution effect. 12
The first reason why this study uses NaSTaB is that to my best knowledge, it is the only survey data that contains information on households’ National Health Insurance premium spending and medical expenses at the same time. The NaSTaB panel data has collected information on National Health Insurance premiums for employee and local health insurance subscribers since 2009, which is rarely found in other datasets, including the National Health Insurance Corporation data. In addition, NaSTaB makes it easy to understand the size of household out-of-pocket medical expenses in non-covered and covered medical services by NHIC. This is because it includes variables related to household expenditure such as the household medical expenses in detail.
Another reason is that income data in NaSTaB is more accurate than any other national survey data such as the Korea Health Survey. NaSTaB conducts surveys every year from May to August when the filing of individual income tax returns is completed. NaSTaB has been improving the accuracy of income-related surveys by reflecting receipts of wage and salary income tax withholding from workers, reports on taxable income and tax amount from self-employed workers, and statements of income deduction and tax credit. 13
Method
This study defined households’ financial burden of healthcare, household income, and high burden households. The average value was calculated using the cross-sectional weights provided by the NaSTaB from 2009 to 2019 to maintain the representativeness of the population each year.
Household Financial Burden of Healthcare
The financial burden of healthcare for households was defined as the sum of household medical expenses and health insurance premiums. Households are used as the unit of calculation because health insurance premiums are paid in units of households, and households generally pay medical costs (out-of-pocket payment). In particular, combining the fact that the employers share half of the insurance premium for the employees with the argument that the welfare benefits generally decrease the wages, we estimated the financial burden of healthcare applying double the insurance premium with employer-sponsored insurance type.
Household Income
Household income was calculated by adding the sum of individual income for each household in the individual data of the NaSTaB with survey weight. In addition, the amount was converted into 2019 values using the Consumer Price Index.
High Burden Household
Households whose medical burden exceeds 10% of household income were defined as high-paying households. According to Banthin et al 2 high burden households are defined as ones in which out-of-pocket medical expenses exceed 10% of household income. Since individual out-of-pocket medical expenses cannot be identified from the NaSTaB data, this study investigated the number of households with more than 10% of household medical expenses.
Financial Burden by Income Quintile and by National Health Insurance Type
Using the household income calculated above, the financial burden of healthcare for each income quintile, which divides the population into 5 income groups, was estimated. Also, the financial burden of healthcare by the national health insurance type was evaluated. Types include employee subscribers, region subscribers, and mixed subscribers, paying both employee and local health insurance premiums. Since the NaSTaB is once a year survey, mixed subscribers may be in households whose one of the family members has been switched over during the period or might be in households in which household members have different insurance types.
Several caveats exist in this study. First, this study could not include premiums of private health insurance which covers medical services not covered by the National Health Insurance. The overall household burden of healthcare and the ratio of financial burden to income would increase if private health insurance premium is included in the financial burden of healthcare. The second constraint was the failure to use after-tax income from household income. If this study had been conducted using after-tax income, a further increase in the ratio of household medical expenses to income would have resulted.
Findings
Household Financial Burden of Healthcare
Overall, payments to finance healthcare increased from $2526 or 15.9% of household income in 2009 to $3556 or 13.3% of household income in 2019. Table 1 is a table that presents the household medical burden and household medical burden relative to household income by household income quintile. The left part of the table shows household medical expenses in dollars. In the first quintile of households with the lowest income level, as of 2019, $1432 was spent on household medical expenses. Households in the second income quintile paid $2050, the third income quintile $3041, the fourth income quintile $4293, and the highest income quintile households spent $7527. The overall average annual increase was 3% from 2009 to 2019. The first, second, third, fourth, and fifth quintiles showed a yearly average growth of 2.1%, 1.9%, 2.8%, 4%, and 4.7%, respectively. The higher the household income, the higher the average annual household medical burden increase rate.
Financial Burden as a Percent of Household Income (%) by Household Income Quintile.

Source. Authors’ analysis of data from the 2nd to 12th National Survey of Tax and Benefit https://www.kipf.re.kr/panel/data/AllList/paData/view.do;jsessionid=D4DF142F6A0FB2FBDDF1C150FB73347F?cntNo=31.
Note. The value for each year is an average value using the household weight of the cross-sectional data, and the value is converted into the present value in 2019 using the consumer price index. The results were then converted into dollars using the USD/KRW exchange rate for each year.
Table 1 also shows the household medical burden as a percentage of income, and the value is presented in the right part of the table. As of 2019, the ratio of household medical expenses to household income was 13.3% overall. The highest percentage of household medical expenses to household income appears in the lowest income quintile. The higher the income, the lower the ratio of household medical expenses to household income. Specifically, 35.3% of household income is used for household medical expenses in the lowest income quintile. On the contrary, only about 7.5% of household income is used for household medical expenses in the highest quintile. Looking at the timeline from 2009 to 2019, the ratio of household medical expenses to household income decreased by an average of 1.8%p per year. The average annual ratio decreased 2.8%p in the first quintile, 1.1%p in the second, and 0.5%p in the third. On the other hand, the ratio of financial burden to household income increased 0.5%p in the fourth quintile and 1.2%p in the fifth.
Table 2 is a table that presents the household medical burden and household medical burden relative to household income by type of national health insurance subscription. The 4 columns in the left part of the table show household medical expenses in dollars. Employed health insurance households spent $4173 for household medical expenses in 2019. Local subscribers spent $2507, and household with a mix of work and local subscriptions paid $2219 for household medical expenses. In absolute terms, it was found that workplace-affiliated households spend more on household medical expenses than regional-affiliated households. In terms of time trend, from 2009 to 2019, the household medical burden increased at an average annual rate of 2.2% for families with workplace insurance, 2.9% for households with regional insurance, and 3.0% for households with mixed workplace and regional insurance. The household medical burden of local household has increased faster than workplace households.
Financial Burden of Healthcare by National Health Insurance Type.

Source. Authors’ analysis of data from the 2nd to 12th National Survey of Tax and Benefit https://www.kipf.re.kr/panel/data/AllList/paData/view.do;jsessionid=D4DF142F6A0FB2FBDDF1C150FB73347F?cntNo=31
Note. The value for each year is an average value using the household weight of the cross-sectional data, and the value is converted into the present value in 2019 using the consumer price index. The results were then converted into dollars using the USD/KRW exchange rate for each year.
The 3 columns on the right of Table 2 show the percentage of household medical burden to income by national health insurance subscription type. As of 2019, workplace-joined households use 9.4% of their household income for medical expenses, and regional households use 14.4% of household income for household medical expenses. Households with a mix of workplace and local subscriptions use 19.6% of their household income for medical expenses, the highest among the subscription types. Looking at the time trend, from 2009 to 2019, the ratio of household medical expenses to household income decreased by an average of 0.1% per year for households enrolled in workplaces and by an average of 1.0% per year for households enrolled in local areas, and 3.7% per year among households with a mix of workplace and regional enrollment, showing the highest rate of decline among the subscription types. Such information is manifested in Figure 2, which integrated the medical cost burden rates by insurance type and income quintile of Tables 1 and 2.
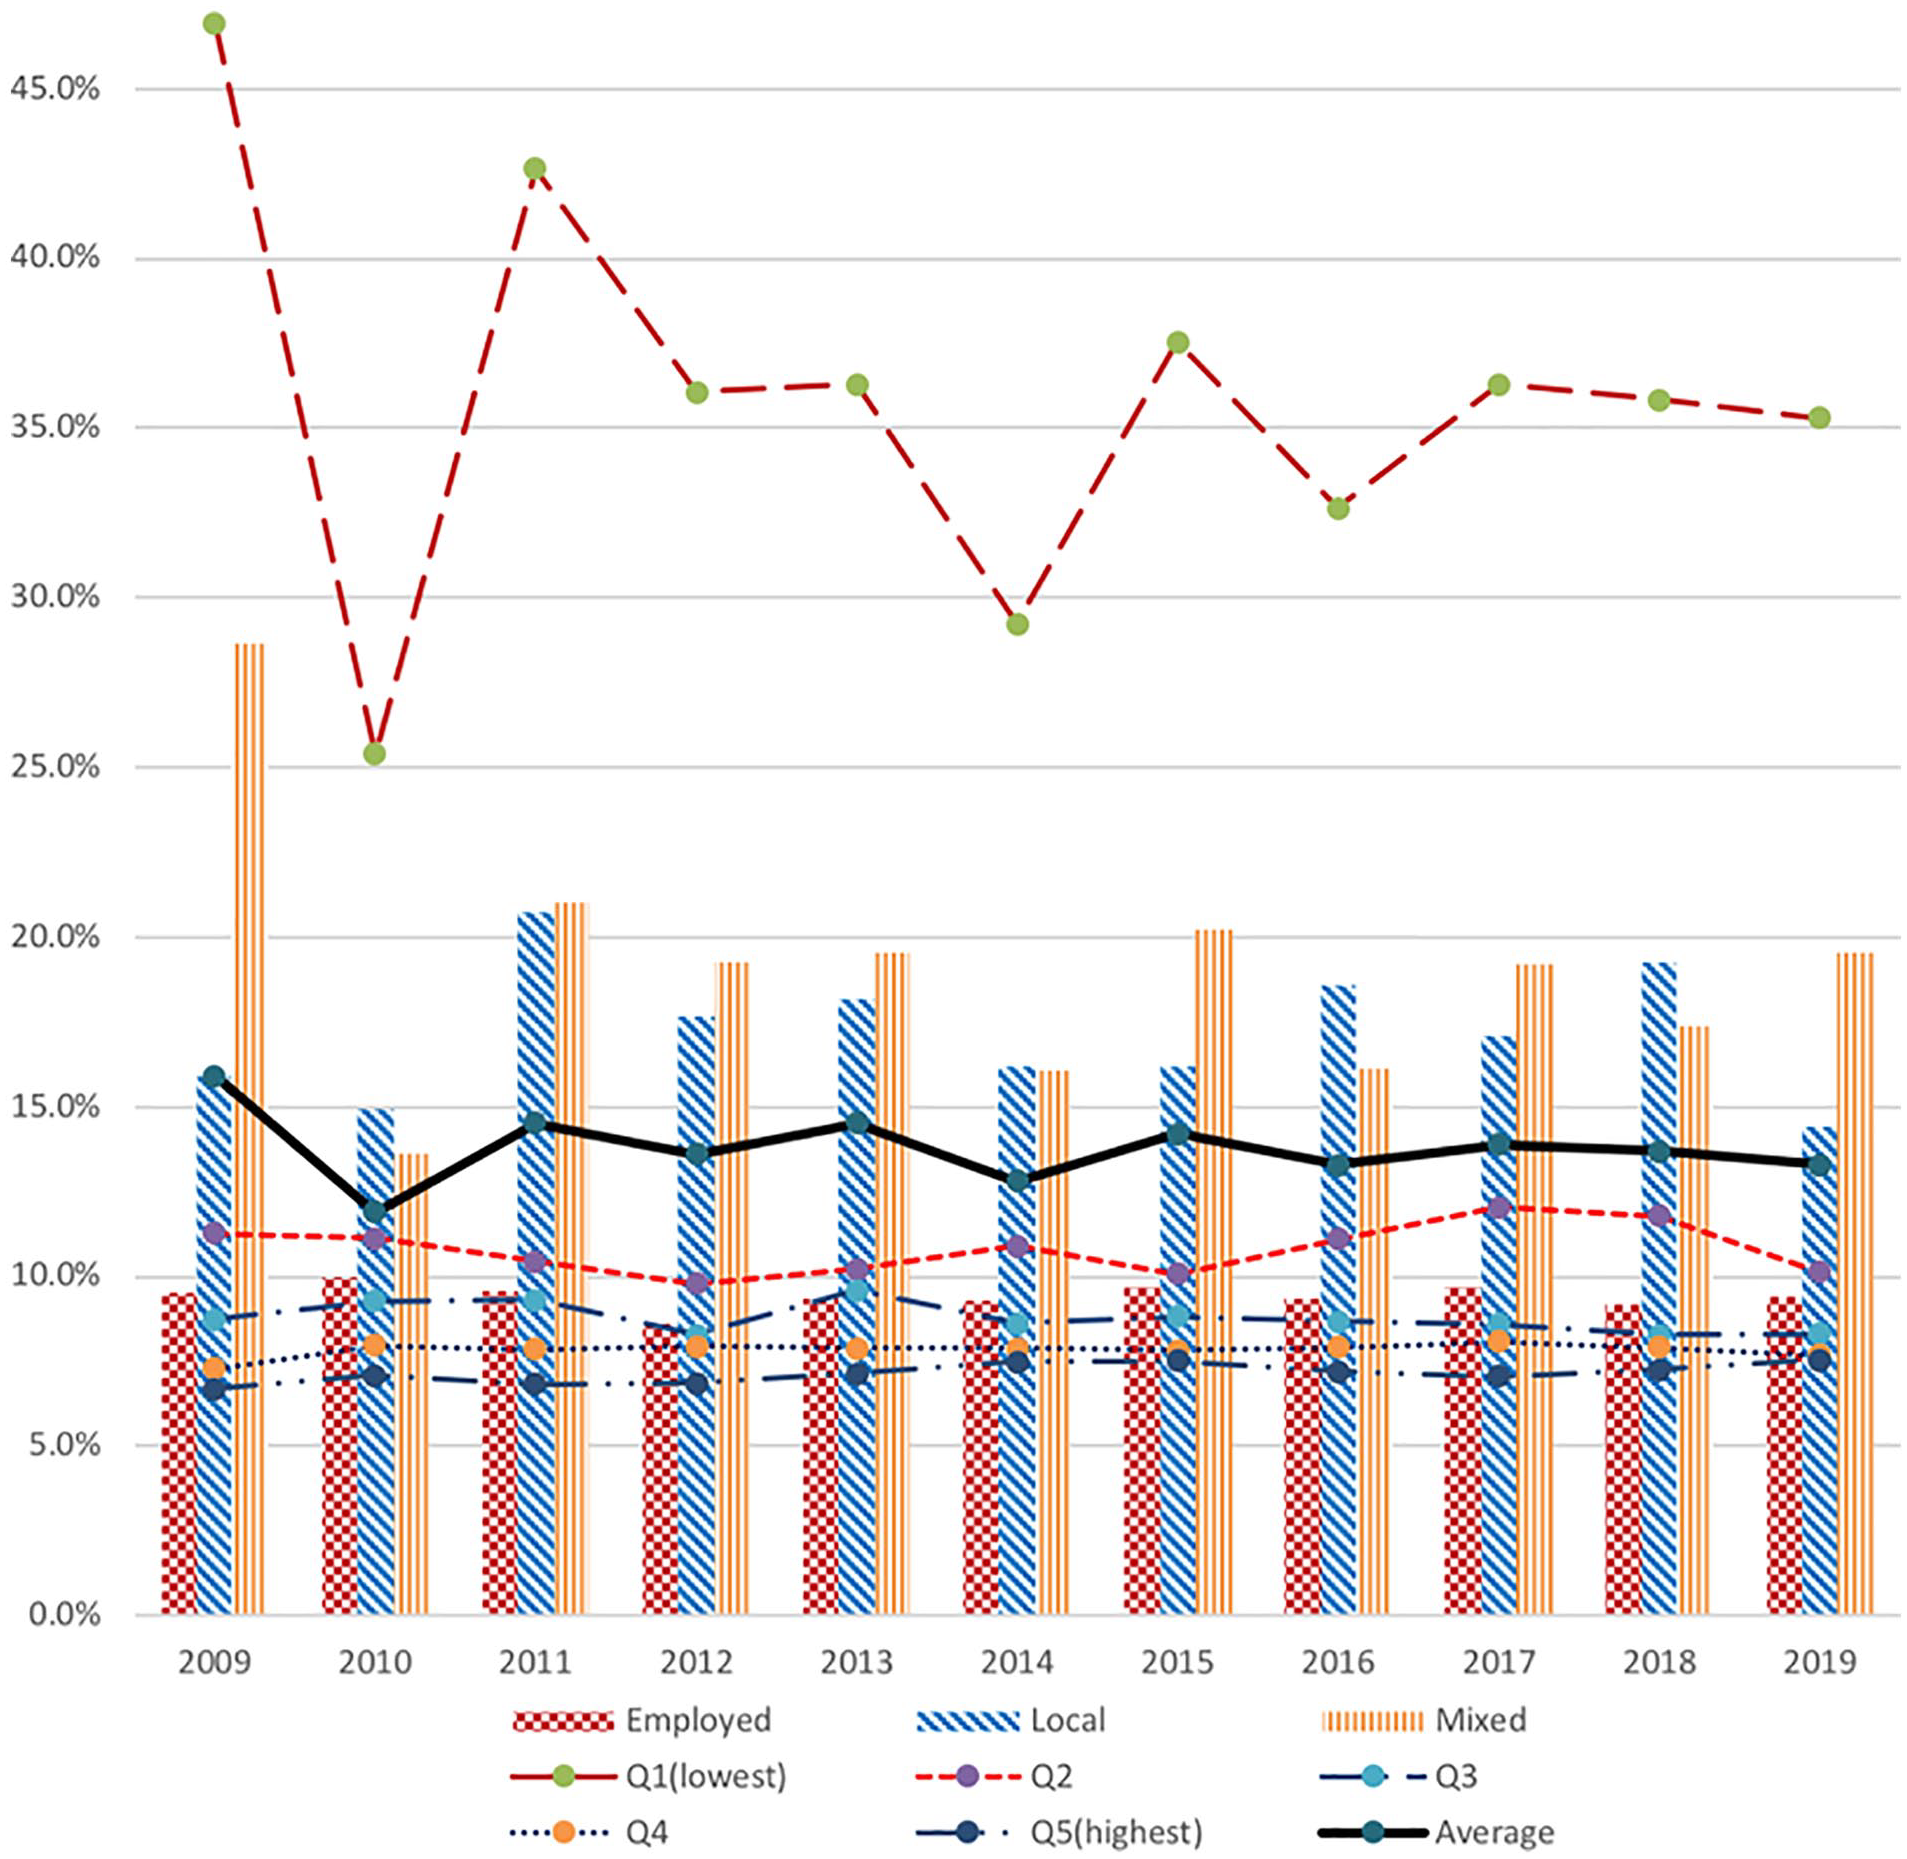
Financial burden as a percent of household income (%) by household insurance type and by household income quintile.
High Burden Household
Table 3 is a table presented by estimating the number of households whose medical burden exceeds 10% of their income. In this study, high-paying households are ones whose financial burden of health care accounts for more than 10% of household income. In the NaSTaB as of 2019, the ratio of high-burden households to the total number of households was 29.2%. About 5.3 million out of 18 million households spent more than 10% of their household income on medical expenses, and the ratio of medical expenses to their average income reached 31.6%. From 2009 to 2019, the share of high-burden households decreased 0.1% on average, and the ratio of medical expenses to the average income of high-burden households decreased by an average of 2.9%.
High Burden Household.

Source. Authors’ analysis of data from the 2nd to12th National Survey of Tax and Benefit, https://www.kipf.re.kr/panel/data/AllList/paData/view.do;jsessionid=D4DF142F6A0FB2FBDDF1C150FB73347F?cntNo=31.
Discussion
We find that Korea’s household financial healthcare burden is regressive to income. This result is similar to Carman et al 4 a study of total health expenditure in the United States. Although the degree of the regressivity of the financial burden of healthcare will vary, total payment to finance healthcare of household is rather regressive to income in both Korea, which relies on public health insurance covering about 60% of its healthcare finance, and the United States, which relies heavily on private health insurance for medical resources. In the US study using 2015 data, the ratio of medical burden to income distributes from the first income quintile to the fifth income quintile (33.9%, 23.2%, 21.1%, 19.8%,and 16.0%). As of 2015, the distribution in Korea is (37.6%, 10.1%, 8.8%, 7.8%,and 7.5%). This result suggests that equity in contribution to healthcare finance does not work well in Korea, which chose the universal health system that emphasizes the progressive contribution by income to medical finance. Whether in the United States or Korea, public health insurance alleviates the financial burden of healthcare for low-income families but seems to be insufficient to create an income-progressive financial burden. The regressive nature might be eased by a policy to secure sufficient financial resources to alleviate the burden of medical expenses on the low-income families.
We also find that high burden households are high in Korea. The proportion using more than 10% of their income for the financial burden of healthcare has been maintained at nearly 30% from 2009 to 2019. These results are high, even when compared to the United States. Banthin et al 2 study estimates that as of 2004, the proportion of high burden households in the United States was about 17.7%. Although the results of Banthin et al 2 are somewhat outdated, compared with the results of this study, it suggests that the proportion of high-paying households in Korea, 29% as of 2019, may be higher than the proportion of high-paying households in the United States.
Supplemental Material
sj-docx-1-inq-10.1177_00469580221135957 – Supplemental material for Is Universal Health Insurance Superior in Terms of Healthcare Payment?: Estimating Financial Burden of Healthcare in Korea: 2009 to 2019
Supplemental material, sj-docx-1-inq-10.1177_00469580221135957 for Is Universal Health Insurance Superior in Terms of Healthcare Payment?: Estimating Financial Burden of Healthcare in Korea: 2009 to 2019 by Changwoo Lee in INQUIRY: The Journal of Health Care Organization, Provision, and Financing
Footnotes
Declaration of Conflicting Interests
The author declared no potential conflicts of interest with respect to the research, authorship, and/or publication of this article.
Funding
The author received no financial support for the research, authorship, and/or publication of this article.
Presence of Declarations,and Ethics and Consent Statements
Our study did not require an ethical board approval because the secondary data used were deidentified.
References
Supplementary Material
Please find the following supplemental material available below.
For Open Access articles published under a Creative Commons License, all supplemental material carries the same license as the article it is associated with.
For non-Open Access articles published, all supplemental material carries a non-exclusive license, and permission requests for re-use of supplemental material or any part of supplemental material shall be sent directly to the copyright owner as specified in the copyright notice associated with the article.