
Abstract
This study aims to estimate the impact of a potential Medicaid expansion on Texas hospitals. The Affordable Care Act (ACA) Medicaid expansion increased access to health care and improved health outcomes. Still, several states, including Texas, have not adopted the expansion. This is a retrospective quasi-experimental study. We obtained inpatient data containing discharges from Texas hospitals between 2010 and 2017 from the Texas Department of State Health Services. Texas hospitals receive a significant number of patients from the adjacent states. We use a difference-in-differences methodology, where the patients from the neighboring states that expanded Medicaid in 2014 are the treatment group, and those that reside in Texas are the control group. The outcome variables are the payer mix and the cost of treatment, proxied by Diagnoses Related Group (DRG) weights assigned by the Centers for Medicare and Medicaid Services (CMS). The Medicaid expansion is associated with 4.15% lower costs of treatment among the patients from the expansion states (P < .01). Also, the uninsured rate decreased by 4.7 percentage points (from 11.3%, P < .01), while the share of Medicaid patients increased by 10.9 percentage points (from 30.7%, P < .01). There are no significant changes in the share of privately insured or Medicare patients. Texas hospitals can benefit significantly from Medicaid expansion due to reductions in average treatment costs and the share of the uninsured.
What is already known:
The ACA Medicaid expansion increased access to health care and improved health outcomes, but some states still have not adopted the expansion.
What this study adds:
This study uses data from Texas (which has not expanded Medicaid as of 2022) to estimate the impact of a potential expansion on Texas hospitals. The results suggest that Medicaid expansion is associated with a lower cost of treatment and a lower share of uninsured.
Policy implications:
Medicaid expansion in Texas is predicted to decrease hospital inpatient costs by millions of dollars every year.
Introduction
The state-level Medicaid expansions play a central role in the Affordable Care Act (ACA) and are intended to increase access to health care and improve health outcomes. The literature found that the ACA Medicaid expansion decreased uninsurance rates,1-6 increased the share of Medicaid discharges,1,3,4,6 and was associated with increased access to health care and improved health outcomes.1,2,4,7 Medicaid expansions also benefited hospitals due to reduced uncompensated care.8,9 Studies even found evidence for increased jobs and average income due to the stimulative effect of the expansion.10-12 Despite the positive evidence for the ACA Medicaid expansion, several states, including Texas, did not adopt it. This study uses data from Texas to estimate the impact of a potential Medicaid expansion on Texas hospitals.
Texas is one of the states that did not expand Medicaid as of 2022, while all its adjacent states did so. Arkansas and New Mexico adopted and implemented the expansion at the beginning of 2014, while Louisiana implemented it in July 2016. The Medicaid expansion in Oklahoma was adopted in 2020 but went into effect on July 1, 2021. Texas hospitals receive tens of thousands of patients from the neighboring states every year. The majority of those patients are admitted to hospitals in areas very close to the state border. Using the Texas Inpatient dataset that contains discharges from the Texas hospitals for the years 2010 to 2017, we examine the impact of potential Medicaid expansion on the payer mix and average cost of treatment in Texas hospitals. The findings of this study are significant as more than a third of the uninsured poor adults in states that did not expand Medicaid reside in Texas. 13
Methods
Data
We use the Public Use Data File (PUDF) obtained from the Texas Department of State Health Services for 2010-2017. 14 The PUDF contains discharge-level information for inpatient hospital stays. The data are quarterly. This study is exempt from Institutional Review Board approval because data are anonymized and publicly available.
In our analyses, we include patients from Arkansas and New Mexico, which adopted Medicaid expansion in 2014. Louisiana is a late adopter and thus has limited post-expansion observations given our sample period. Oklahoma expanded at a much later date, which is outside of our sample period. Patients from Texas make up the control group, and those from Arkansas and New Mexico are the treatment group. We only include the hospitals that receive a significant number of patients from the treatment states. More specifically, we keep hospitals where the out-of-state patients make 0.5% or more of total discharges in any quarter.
The outcomes of interest are the payer mix and the cost of treatment, which we proxy by Diagnosis Related Groups (DRG) weights. Because the Centers for Medicare and Medicaid Services (CMS) is the dominant payer for medical care in the United States, Medicare’s DRG-based reimbursement schedule is widely used for hospital costs. 15 DRG weights are resource-based relative value weights publicly available on the CMS website. Since DRG weights represent the expected payment by the CMS, they can be used to estimate inpatient costs at the hospital level.16,17 The dataset also reports total charges, but we use DRG weights because charges are not a reliable measure of payments received by hospitals. 18
Several patient characteristics including, age, sex, race, and expected payment sources are available. We classify discharges based on the expected primary source of payment into 4 insurance categories. The codes for Medicare Part A and B are included in Medicare; the code for Medicaid denotes Medicaid patients; self-pay, charity, indigent, or unknown make up the Uninsured, and private insurances are included in the Private category. Sex categories are male, female, and unidentified. Race includes American Indian, Asian, Black, White, and Other. Age has 27 categories. Although we use indicators for each age category in the regression analysis, we report age statistics using 5 broader age ranges for convenience. We also control for the median household income in the patients’ zip code of residence obtained from the American Community Survey.
Statistical Analysis
We first report the baseline differences between the treatment and control groups in the pre-expansion period (2010-2013) for the entire sample.
We analyze the impact of the Medicaid expansions using a difference-in-differences methodology. For our main analysis, we exclude patients over 65, as those are already eligible for Medicare, and the expansion is unlikely to affect them. We estimate the following empirical equation:

Several sensitivity analyses are conducted. Our data include patients younger than 18. Medicaid expansion may not have a direct impact on those, but it may have a spillover effect. Studies show a link between expanding parent Medicaid eligibility and growth in children’s health coverage. 19 Nevertheless, we perform a sensitivity analysis excluding patients <18. Also, the ACA was enacted in 2010 and had several other provisions that became effective long before 2014. Thus, we exclude 2010 to rule out those initial provisions that could confound our results. Another concern is that after Medicaid expansion, Texas hospitals may reach out to close-by healthcare facilities in the expansion states and request the transfer of patients who are relatively easy to treat and more likely to be insured. Thus, we repeat our analysis by excluding patients transferred from other health care facilities to rule out cream-skimming by Texas hospitals.
We use our full sample, including patients over 65, to find out the impact of the expansion on the share of Private and Medicare discharges. We expect Medicaid expansion does not affect the share of Medicare discharges since individuals eligible for Medicare are unaffected by the policy. This provides a falsification test for our analysis. The results also reveal if the public insurance expansion resulted in crowding-out of private insurance.
We also check if the parallel trends assumption, which is essential for the validity of a difference-in-differences analysis, is satisfied. We run the following linear regression for the years before the expansion:

The parallel trends assumption requires the outcomes variables to be similar before the policy was implemented. The interaction of the treatment and year dummies captures the difference between the treatment and control groups over the years. The parallel trends assumption is valid if
Results
More than 3 million discharge records from 108 hospitals are used, with an average of 400 000 per year. Table 1 shows the baseline differences between the treatment and control groups. The treatment group makes up 7% of the total sample. The treatment group is more likely to have Medicare or Medicaid and less likely to be privately insured or uninsured. The control group discharges are more likely to be Asian or other races. They are also more likely to be female or of unknown/unidentified sex. The treatment group has a higher share of patients in older age categories. The patients in the control group are from zip codes with higher median incomes.
Baseline Characteristics.

Baseline characteristics of the entire sample in the pre-policy period (2010-2013). Average shares of discharges in each category or means are shown for categorical and numerical variables, respectively. The treatment group is patients from Arkansas or New Mexico, which expanded Medicaid in 2014. The control group is patients from Texas. The last column reports the differences between the groups and whether those differences are statistically significant based on t-tests.
P < .01.
Table 2 shows the averages of outcome variables in the pre and post-expansion periods for the treatment and control groups, as well as the adjusted and unadjusted difference-in-differences. Average DRG weights increase from pre-expansion to post-expansion period for both the treatment and control groups. However, the increase is milder for the former. Compared to the baseline values, the average DRG is about 4.15% lower in the post-expansion period for the patients from the expansion states. The share of Medicaid discharges increases among the patients from the expansion states but decreases among the patients in the control group. On the contrary, the percentage of the uninsured decreases among the treatment group but increases slightly among the control group. Compared to the baseline averages, the uninsured rate is lower by 4.7 percentage points, while the share of Medicaid patients is higher by 10.9 percentage points.
Changes in Outcome Variables.
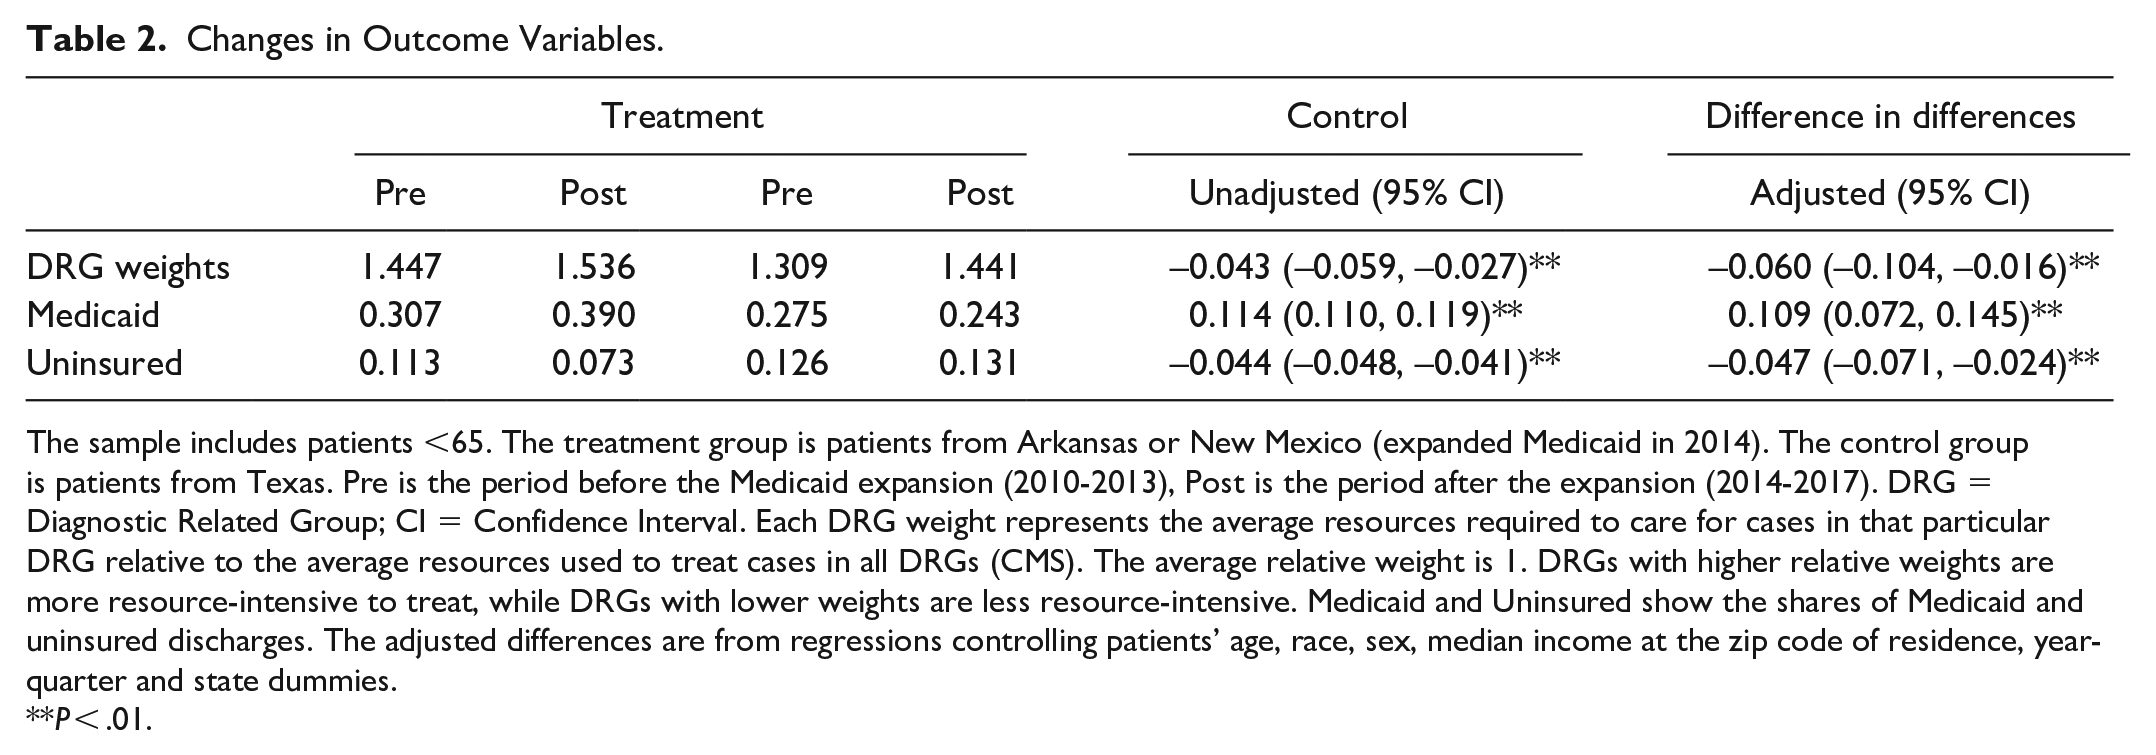
The sample includes patients <65. The treatment group is patients from Arkansas or New Mexico (expanded Medicaid in 2014). The control group is patients from Texas. Pre is the period before the Medicaid expansion (2010-2013), Post is the period after the expansion (2014-2017). DRG = Diagnostic Related Group; CI = Confidence Interval. Each DRG weight represents the average resources required to care for cases in that particular DRG relative to the average resources used to treat cases in all DRGs (CMS). The average relative weight is 1. DRGs with higher relative weights are more resource-intensive to treat, while DRGs with lower weights are less resource-intensive. Medicaid and Uninsured show the shares of Medicaid and uninsured discharges. The adjusted differences are from regressions controlling patients’ age, race, sex, median income at the zip code of residence, year-quarter and state dummies.
P < .01.
Using our full sample, we estimate the impact of the expansion on all payer types, including Medicare and Private insurance. Table 3 reveals that the share of uninsured decreases while the share of Medicaid discharges increases among the treatment group compared to the control group. However, there are no significant changes in the shares of Medicare or Privately insured following the expansion once we adjust for patient characteristics. This confirms our falsification test. As expected, the expansion does not affect Medicare discharges. And there is no evidence of a crowding-out effect.
Changes in Payer Mix.

The full sample of discharges, including patients >65, is used. Each row shows the share of discharges in the corresponding category. The treatment group is patients from Arkansas or New Mexico (expanded Medicaid in 2014). The control group is patients from Texas. Pre is the period before the Medicaid expansion (2010-2013), Post is the period after the expansion (2014-2017). CI = Confidence Interval. Adjusted differences are from regressions controlling patients’ age, race, sex, median income at the zip code of residence, and year-quarter and state dummies.
P < .01.
Figure 1 plots the estimated predictive margins of the year-treatment interactions obtained from equation (2) along with their 95% confidence interval. The visual inspection suggests clear parallel trends for panel (a) and (b) but not for the others. However, for all outcome variables, the coefficient estimates of the year-treatment interactions (not reported) are not statistically significant at a 5% significance level. This indicates that the outcome variables were not statistically different between the treatment and control groups prior to the policy.

Parallel trends.
Our results reveal 2 potential mechanisms for cost savings by Texas hospitals due to the Medicaid expansion: The average cost of inpatient treatment decreases (lower DRGs), and the uninsured rate decreases. However, if Medicaid expansion increases hospital admissions, the former cost advantages may be negated or outweighed. We check if the share of patients from the states that expanded Medicaid has increased significantly after the expansion. The results in the Appendix show that the Medicaid expansion does not change the trend of out-of-state patients treated in Texas. Also included in the Appendix are sensitivity analyses that show our findings are robust.
Discussion and Conclusion
We find that Medicaid expansion is associated with lower average DRG weights, a lower share of uninsured, and a higher share of Medicaid discharges among the patients from the expansion states treated in Texas hospitals. Our findings suggest that Texas hospitals can benefit from Medicaid expansion because of the lower average cost of treatment (lower DRGs) and reduced cost of uncompensated care (smaller share of uninsured). We did not find evidence for a systematic change in the share of out-of-state patients seeking treatment in Texas hospitals following the expansion. The results imply a 4.15% decrease in average DRG weights, which translates into $360 lower costs per patient. Therefore, Medicaid expansion in Texas is predicted to decrease hospital in-patient costs by millions of dollars every year. Besides, the American Rescue Plan Act of 2021 encourages non-expansion states to take up the expansion by providing an additional temporary fiscal incentive for states to newly implement the ACA Medicaid expansion. Texas is expected to gain net positive fiscal benefits on top of providing potential health benefits for its residents by expanding Medicaid. 21
Our findings of the payer mix are as expected and in line with the literature. Medicaid expansion is intended to provide insurance to low-income adults who fall in the coverage gap (those with incomes above their state’s eligibility for Medicaid but below poverty, the minimum income eligibility for tax credits through the ACA marketplace). The decrease in the DRG weights may indicate that expanding Medicaid eligibility and covering low-income adults can improve health outcomes. Those patients can get more timely care and thus are less likely to end up in worse conditions that are harder and costlier to treat.
Even though the results are robust, our analysis relies on an administrative dataset with some limitations. The data are quarterly, but providers have, by law, until the next quarter (following the discharge) to submit their data. Thus, each quarter may contain some discharges dated in the previous quarter. Since our pre- and post-expansion periods consist of several quarters, we believe having a quarter lag would not create a significant problem. Also, race and ethnicity information are generally not collected by hospitals and may be subjectively captured. 14 We do not use ethnicity information because it is not consistent and fluctuates significantly over time. Race data are relatively more consistent, but we still use race categories as a control variable and do not draw conclusions based on race.
Another concern is that patients from the neighboring states may be different from those from Texas seeking care in their own state. In our sample, we include hospitals that have a large share of out-of-state patients. Those hospitals are very close to the state border. The advantage of our design is that the treatment and control groups consist of patients who are from areas within close proximity. Thus, they are likely to have comparable socioeconomic characteristics. On the other hand, those out-of-state patients might have more serious conditions that warrant them seeking care elsewhere. In fact, the average DRG weights are higher for those patients both before and after the expansion. However, the differences-in-differences method does not necessitate the 2 groups to be homogenous. The differences between treatment and control groups are taken care of as long as no other factor affects the 2 groups differentially before and after the treatment. Figure 1 shows that even though the average DRG weights are different, they have similar trends in the pre-expansion period. Also, the falsification test we conducted ensures there are no factors that could result in differential trends after the expansion.
Lastly, our treatment group includes patients from Arkansas, which expanded Medicaid through the private option, and New Mexico, which adopted traditional Medicaid expansion. This may raise questions about the validity of the treatment group. But the earlier research found similar conclusions regarding the effects of the private option and traditional Medicaid expansions. 2 Also, we include state dummies in our regressions.
Footnotes
Appendix
Acknowledgements
I thank Dr. Esra E. Bayindir for valuable feedback and suggestions.
Author Note
I thank participants at the Southern Economic Association 91st Annual Conference for their comments. All remaining errors are mine.
Declaration of Conflicting Interests
The author declared no potential conflicts of interest with respect to the research, authorship, and/or publication of this article.
Funding
The author received no financial support for the research, authorship, and/or publication of this article.