
Abstract
This is a pilot study that investigated differences in effectiveness, maintenance of effectiveness, cost-efficiency, satisfaction, and usability of a lottery incentive via mobile devices to promote walking, depending on the chance of winning the lottery, the amount of the prize, and gender. Sixty-six college students (male = 26) were randomly assigned to 3 groups: 10% chance of a big prize (10% + B), 50% chance of a medium prize (50% + M), and 100% chance of a small prize (100% + S). Step counts were collected through mobile devices before and after the intervention, as well as at the 2-month follow-up. The results showed significant increases in the step counts among males after the intervention in the 10% + B and the 50% + M groups, and females in the 100% + S group. Only males in the 50% + M group exhibited maintenance in effectiveness during follow-up. With regard to cost-efficiency, the 10% + B and the 50% + M male groups, which showed significant differences in effectiveness, were compared, and no significant difference was found. With regard to intervention satisfaction, satisfaction of the 10% + B group was lower than that of the 100% + S group. There were no significant interactions or main effects regarding the usability of the intervention. The results suggest that a lottery incentive is effective only for men to promote walking when a medium size prize is given with a 50% of chance of winning the lottery.
What do we already know about this topic?
A) We have limited knowledge regarding how lottery incentives impact on walking
How does your research contribute to the field?
A) This study provides information regarding effectiveness and cost-efficiency of lottery incentives on walking
What are your research’s implications towards theory, practice, or policy?
A) This study provides information regarding effectiveness and cost-efficiency of lottery incentives on walking
Rapid advances in mobile devices and wireless technology have increased the use of mobile health (mHealth) technologies, which apply mobile technology to public health projects to promote physical health. 1 A common form of mHealth uses mobile applications to gather information, monitor behaviors, and facilitate behavioral change. 2 Over the past few years, mHealth applications for promoting physical health have rapidly increased. 3 In 2017, the rate of using health and fitness applications was 3 times that of 3 years earlier, 4 and in 2020, approximately 100,000 health and fitness applications were registered on Google Play. 5 This may be because of high accessibility, cost-efficacy, and easy dissemination. 6
Nonetheless, these applications face many challenges, as pointed out by 3 meta-analyses.7-9 The majority of mHealth applications were developed independent of evidence-based treatments, and their efficacy was rarely tested before their arrival on the online market. 10 Recently, some countries have been taking countermeasures, such as publishing guidelines and distributing assessment tools, to prevent problems arising from the use of applications lacking a theoretical basis and evidence of effectiveness.11,12
At the same time, strategies suitable for mHealth are being explored to develop applications that are based on theories of behavioral change. One such strategy is Contingency Management (CM), which offers financial incentives when a target behavior is performed, based on the theory of operant conditioning. 13 Recently, financial incentives have gained significant attention as an effective strategy in the mHealth field 6 , having high applicability and robust supporting scientific evidence.14,15 Indeed, CM has been applied to mHealth in recent studies and has been shown to be effective in promoting physical activity.16-18 However, its cost-efficiency has not been well evaluated, and it remains to be seen whether the behavioral changes justify the resources used. 19 Considering that the goal of mHealth is to provide health interventions to a wide audience at a low cost, 20 low cost-efficiency could result in a cost burden, limiting the possibility of the practical use of CM.21,22 These past findings show the need to explore CM strategies with empirical support for effectiveness and cost-efficiency.
The lottery incentive has gained attention as an effective and cost-efficient CM strategy.23-25 The lottery incentive is a strategy in which a lottery ticket is provided each time a target behavior is performed, and a prize is given when the lottery is won. The lottery incentive has been shown to be effective for behavioral change through intermittent reinforcement, applied through the unpredictable repetitions of winning and losing.26,27 The lottery incentive is considered cost-efficient and practical since it reduces the cost and effort for those who implement the program.23,28 Previous studies have revealed that face-to-face lottery incentives are effective for behavioral changes, including the promotion of physical activity 24 and weight loss. 29 Furthermore, a few studies applying a lottery incentive to mHealth have also reported that it is effective for enhancing medication adherence16,30 and health monitoring. 31
Another line of research has investigated various factors affecting the effectiveness and cost-efficiency of the lottery incentive.24,28,32 Representative factors include the chance of winning, 28 the amount of the prize, 33 and gender. 34 First, studies that fixed the amount of the prize and manipulated the chance of winning found the lottery incentive to be more effective when the chance of winning was high. For example, 1 study showed that only the lowest incentive condition (25%, as opposed to 50%, 75%, and 100%) was ineffective in improving 3 female elementary school students’ performance in solving math problems. 35 Another study reported that a 3% condition resulted in the lowest job performance of 2 teaching assistants compared to 6%, 12%, and 25% conditions. 28 However, other studies have reported that the effect of the chance of winning the lottery is minimal. One such study reported no differences in attendance rate across 3 different conditions (25%, 50%, and 75%) among patients with mental disorders. 36 Although rare, some studies have compared the effectiveness of the lottery incentive while manipulating both the amount of the prize and the chance of winning. For example, 1 study randomly assigned 209 adults to 1 of 4 groups (a group with a 25% chance of receiving $5; a group with a 25% chance of receiving $500; a group with an 18% chance of receiving $5 but also a 1% chance of receiving $50; and a control group receiving text feedback) to compare the effectiveness of the incentives in enhancing physical activity. 24 It was reported that the lottery incentive was effective only in the group with an 18% chance of receiving $5 and a 1% chance of receiving $50. This study showed that a lottery incentive with reasonable prizes at an appropriate frequency may be more effective, suggesting the importance of considering the interaction between the chance of winning and the amount of the prize when evaluating the effectiveness of a lottery incentive.
The results from these studies should be carefully interpreted, however. First, the number of studies and their research designs are limited to a single subject design with a few participants. Second, studies exploring this interaction are rare, requiring further evidence to support their findings. Third, given that none of the prior studies controlled the expected value of lottery tickets for equality among the groups, it is possible that the results were because of differences in expected value rather than the amount of the prize and the chance of winning. Fourth, cost-efficiency, which is considered 1 of the key factors when choosing a strategy for mHealth, 20 was not evaluated in these lottery incentive studies. Therefore, the effectiveness and cost-efficiency of the lottery incentive may be elucidated by controlling the expected value of the lottery and by simultaneously manipulating the chance of winning and the prize amount.
Gender differences in the effectiveness and cost-efficiency of the lottery incentive have not been directly investigated but are implicated indirectly in a few previous studies. For example, a questionnaire-based study on lotteries showed that females perceive the losses incurred from lotteries to be greater than those perceived by males. 34 Furthermore, that study, which was conducted on 840 adults, reported that females tend to negatively assess the chance of winning a lottery. Correspondingly, a computer-based experimental study that exposed 181 adults to a choice between a lottery and receiving a guaranteed prize, 32 reported that females were less likely to select the lottery option than were males. Moreover, even when the females selected the lottery option, they had a negative perception of their chance of winning. 32 This consistently negative assessment of lotteries in terms of satisfaction and usability among females suggests that gender differences should be directly investigated.
The purposes of this pilot study were as follows: (1) to investigate for differences in the effectiveness and sustained effectiveness of the lottery incentive; (2) to investigate for differences in cost-efficiency; and (3) to investigate for differences in the satisfaction and usability of the lottery incentive.
Materials and Methods
Participants
The participants in this study were recruited from 15 universities in Seoul, Republic of Korea, through online community advertisements and e-mail advertisements. All students who registered to participate in the study had to complete an online screening survey conducted by 3 experimenters. Data were collected on participants’ age, gender, plan to change smartphones during the research period, vacation or travel abroad, plans during the research period, and average number of hours of walking per day. The exclusion criteria, based on the screening survey results, were (1) planning to change their smartphone during the research period, (2) planning a 7-day or longer vacation, (3) planning to travel abroad, and (4) walking more than 2 hours per day on average and, therefore, already engaged in the recommended walking activity. 37 Of the 102 students who registered to participate in the study, 24 were excluded since they failed to meet the inclusion criteria. Of the remaining 78 potential participants, 12 were excluded because their daily average step counts during the baseline period were above 9000 steps, meaning that they were already engaging in sufficient walking activity. 40 Thus, a total of 66 participants (26 males and 40 females) comprised the final participant pool (Age M = 23.85, SD = 3.17). In this final pool, the data from 5 participants were excluded because less than 80% of their data was collected during the research period, since they were (1) setting the phone to airplane mode, (2) turning off mobile data, (3) forcing application shutdown, or (4) using the power-saving mode. The data from 61 participants (26 males and 35 females) were included in the final analyses (Age M = 23.95, SD = 3.26) (Table 1). A total of 47 students (22 males and 25 females) participated in the follow-up assessment, which was conducted 2 months after the termination of the intervention (Age M = 24.28, SD = 3.39). The data from these participants were used to analyze the maintenance of effectiveness. The flowchart is presented in Figure 1. This study was conducted as a part of a government-funded research project after receiving approval from the associated university’s Institutional Review Board (Approval No.: 7001988-201910-HR-591-09).
Demographic Information of Participants.

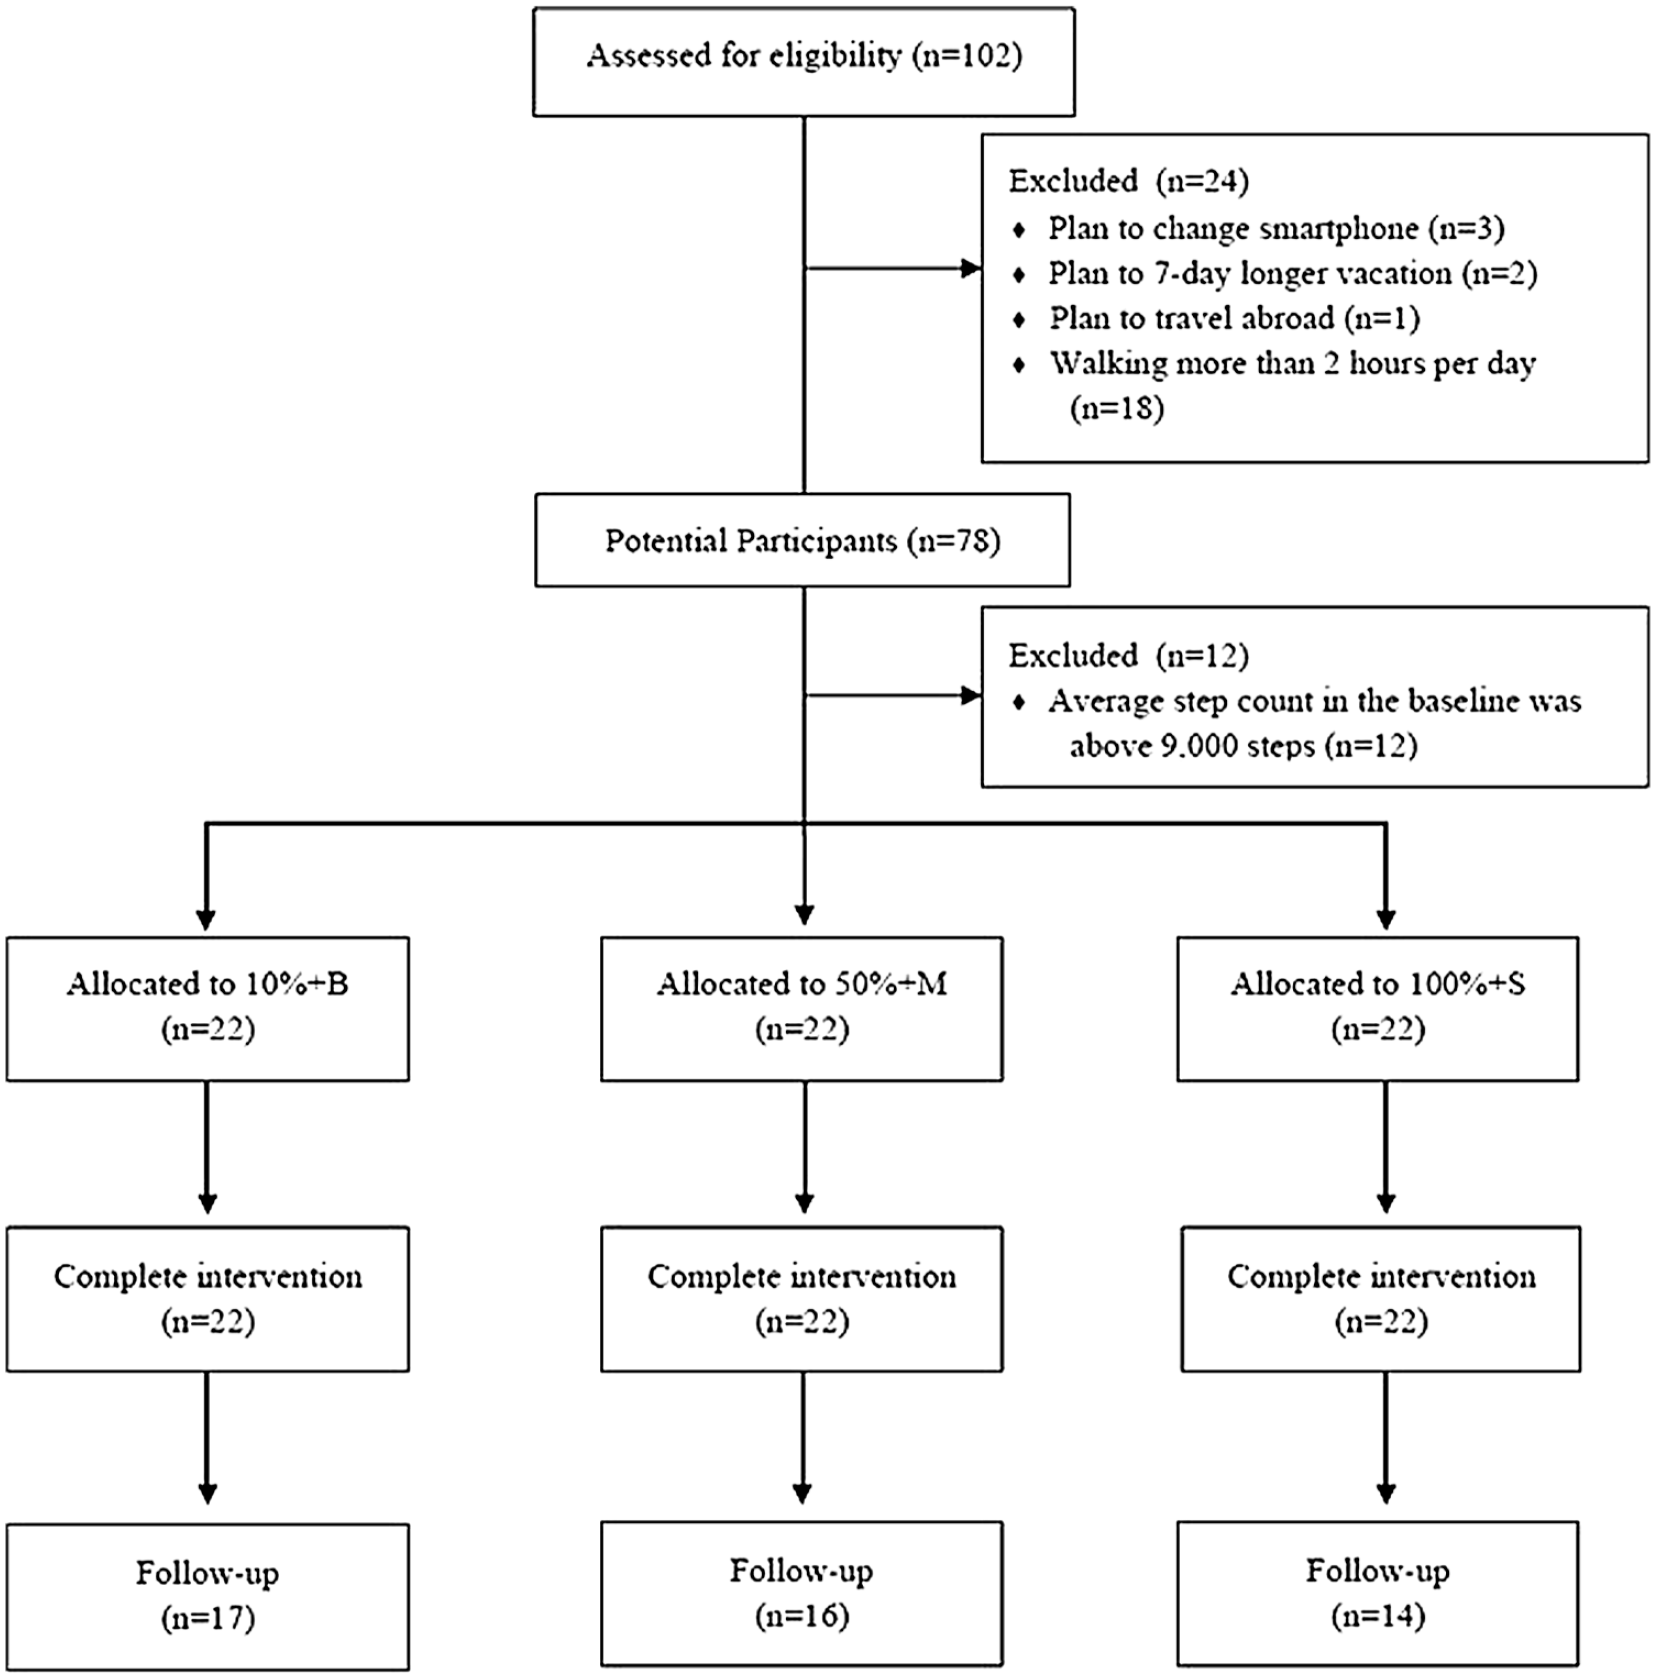
Flowchart.
Measures
Pacer Mobile Application
Pacer, 1 a mobile application with a pedometer function with established validity for measuring step counts, 38 was used to measure the research participants’ step counts. Pacer runs in the background of a smartphone’s operating system and measures the user’s step counts automatically. The participants downloaded Pacer for free from Google Play or the Apple App Store and created an account on it. For this study, the experimenters applied for a paid administrative service to extract the daily step count data of the participants to a Microsoft Excel file for data analysis.
Intervention Satisfaction and Usability Assessment Questionnaire
The satisfaction and usability of the intervention were evaluated with the revised and supplemented self-reporting Intervention Satisfaction and Usability Assessment Questionnaire. 39 The questionnaire used in this study comprised 6 items. Four items from the original questionnaire involved assessing the participants’ satisfaction and perception of the usability of the step count goal and the points provided. Two new items generated for this study measured participants’ satisfaction and perceived usability of the lottery incentive. The satisfaction items were rated on a 5-point Likert scale ranging from 1 (very dissatisfied) to 5 (very satisfied), while the usability items were rated on a 5-point Likert scale ranging from 1 (of little use) to 5 (very useful). The scores from the 3 satisfaction items and the 3 usability items were added separately to calculate the total scores for satisfaction (3–15) and usability (3–15) for the analyses.
Procedure
This study was conducted in the following order: orientation, pre-intervention assessment, baseline, intervention, post-intervention assessment, and follow-up assessment.
Orientation
A total of 78 potential participants underwent a small in-person group orientation and a pre-intervention assessment. The orientation and the pre-intervention assessment were conducted by 3 MA-level research assistants (RAs). First, an RA described the research procedure and purpose to a participant. Second, the study was explained to each participant. Specifically, participants were notified that they could earn up to 80,000 virtual points based on the step counts recorded through Pacer. A fixed maximum value of points was set to minimize the motivation for cheating and to analyze the cost-efficiency between groups. The participants were also informed that every 10 points could be converted to 1 cent after the termination of the study. However, in reality, $80 was provided to all participants who completed the post-intervention assessment. The research procedure was explained in detail through a debriefing at the post-intervention assessment.
Third, all participants were helped to download Pacer onto their smartphones. To control the effect of Pacer’s functions on the participants’ walking behavior, all alarms and feedback functions on Pacer were disabled. The participants were then asked to join the group on Pacer created by the research team to monitor participants’ step counts. Participants were also instructed to add the KakaoTalk Channel account 2 created by the research team on their personal KakaoTalk account, 3 through which the research team sent necessary messages.
Baseline
Baseline data on daily average step counts were collected for 14 days, and these data were used to check whether the participants met the inclusion criteria and to set step count goals corresponding to the participants’ pre-intervention level of step counts. To control for the possibility of changes in the step counts resulting from participation in the study, all participants were instructed to carry on with their normal routine.
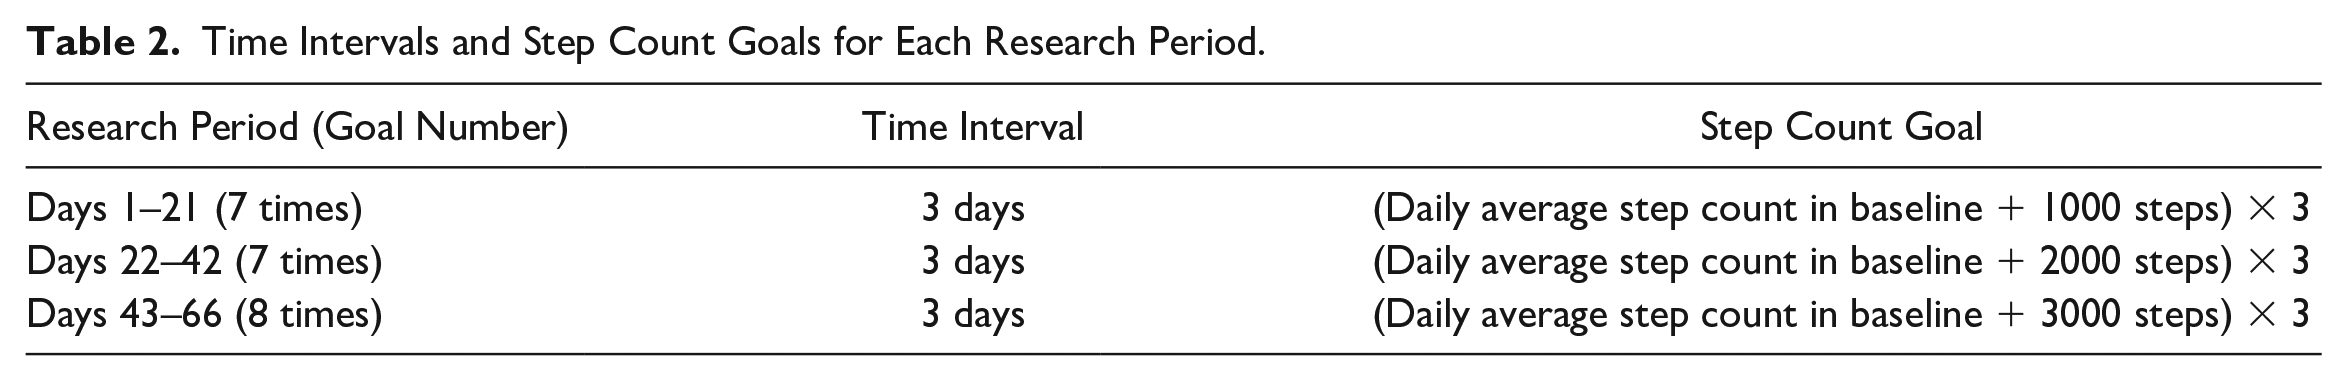
The 12 participants who walked 9000 steps or more per day during the baseline were deemed to be engaging in sufficient walking activity 40 and thus were excluded from the final participant pool. The step count goal was then established based on the daily average step count measured for each participant during the baseline period. The following considerations were taken into account when deciding on the step count goal. First, if the step count goal was too high, there would be a risk of reduced maintenance of walking activity. 41 Second, previous research recommended increasing 3000 steps from the daily step count measured during the baseline period to promote physical health.25,40 Thus, the step count goal was set at 3000 steps higher than the baseline. However, to prevent ratio strain, which could occur when a sudden increase in goal was set, 42 the intervention period (66 days in total) was divided into 3 periods (days 1–21, days 22–42, and days 43–66). In each period, the step count goal was increased gradually by 1000 steps. Furthermore, requiring the achievement of the goal every day can be an excessive burden on participants, 43 and there may be cases where achieving the goal is impossible on a certain day for unavoidable reasons, such as personal schedules. Therefore, the step count goal was established in 3-day time intervals, based on previous studies, so that the burden perceived by the participants during the intervention period could be minimized and the participants could take part in the intervention by changing their personal schedules 44 (Table 2).
Time Intervals and Step Count Goals for Each Research Period.
Lottery Incentive Intervention
The intervention continued for 66 days upon the finding that continuous effort should be made for at least 66 days for a behavioral change. 45 The participants were randomly assigned to 1 of the following 3 groups: 10% chance of a big prize (10% + B); 50% chance of a medium prize (50% + M); and 100% chance of a small prize (100% + S). No information about the group was provided to participants. The participants’ step counts were measured during the intervention period through Pacer. Whether the participants met the step count goal was automatically determined through an administrative website 4 that was custom developed using Personal Hypertext Preprocessor (PHP). The PHP website was developed by the research team for this study by outsourcing production. Information on each participant’s group assignment, target step count, and daily step counts obtained from Pacer were manually entered into the website. An automatically generated message from the website regarding each participant’s daily step count and points earned was sent to each participant at the designated time via KakaoTalk messaging. The participants were not aware of the existence of this website or of the fact that the messages were sent from it.
An escalating reinforcement schedule was used as the lottery incentive intervention because the effectiveness and cost-efficiency of such a schedule to promote physical activity have been demonstrated in previous research.39,44 The escalating reinforcement schedule only provides a reward when the goal is met within a given time interval. When the goal is met on consecutive occasions, the amount of the reward gradually increases; when the goal is not met, the amount of the reward is reset to the initial amount. 46 The proportion of the increase in the amount of the reward in this study was set to 25%, which has been previously confirmed for effectiveness and cost-efficiency. 44 Therefore, the initial number of lottery tickets given when the step count goal is met was set at 4 to allow for proportionate increases of 25%.
All participants were given lottery tickets if they met the step count goal within 3 days. When a participant met the step count goal for the first time, they were given 4 lottery tickets. For each consecutive achievement of the goal, an additional lottery ticket was provided. For example, if a participant achieved the step count goal 3 times in a row, 6 lottery tickets were provided. However, no lottery tickets were given if the participant did not reach the step count goal within 3 days even if the goals were achieved consecutively before. When they met the step count goal again, 4 lottery tickets were given again (e.g., 4 tickets, 5 tickets, 6 tickets, no tickets, 4 tickets).
The lottery tickets were provided in the form of an image message using pictures from a free website 5 at 2 P.M. the day after every 3 days (e.g., Day 4, Day 7, Day 10, Day 13, . . . , Day 67). This image message was sent through KakaoTalk Channel automatically from the PHP-based administrative website. It had information about the participants’ step count goal and whether the goal was met, the number of consecutive goal achievements, lottery tickets obtained, and points that could be won from winning the lottery (see Figure 2). If participants met the step count goal and were given the lottery tickets, image messages were also sent through KakaoTalk Channel after 5 hours at 7 P.M. (see Figure 2). The image messages contained information about whether a lottery ticket had been won, the number of points obtained for each successful lottery ticket, and the cumulative number of points to date. Whether the lottery was won, and, if it was, the number of points provided for winning were calculated automatically on the PHP-based administrative website.

Image message (A: achieving step count goal, B: not achieving step count goal, C: winning, D: losing).
Although the expected value of each lottery was 250 points for all groups, the chance of winning and the number of points provided when the lottery was won varied by group. First, in the 10% + B group, the chance of winning was 10%, and the amount of the prize was 2500 points per winning lottery ticket. In the 50% + M group, the chance of winning was 50%, and the amount of the prize was 500 points per winning lottery ticket. In the 100% + S group, the chance of winning was 100%, and the amount of the prize was 250 points per winning lottery ticket.
Post-Intervention Assessment
Within 5 days of the termination of the intervention, all participants underwent a post-intervention assessment. The post-intervention assessment was conducted by the same 3 researchers at the same location as the pre-intervention assessment and lasted for approximately 30 minutes. The participants responded to the Intervention Satisfaction and Usability Assessment Questionnaire generated on Qualtrics, 6 an online questionnaire system. After the post-intervention assessment, debrief forms were shared with the participants. Next, the participants underwent debriefing. All participants completed both pre-and post-intervention assessments and were given $80, which was the maximum possible compensation.
Follow-Up Assessment
To examine whether the effect of the intervention was maintained, a follow-up assessment was performed 2 months after the termination of the experiment. Step count data were collected post-intervention for those 2 months via Pacer for the participants who agreed to participate in the follow-up assessment.
Power Analysis
An a priori power analysis was performed (G*Power) 47 for a repeated-measure analysis of variance (ANOVA) of between-within interactions with a three-group design by setting the α error probability to .05 and 1-β error probability to .90 to identify the sample size appropriate for this research design. Effect size F was set to .25, which has been suggested as the medium value. 48 Correlation among repeated-measures was set to .3, which was the observed value in similar previous studies.39,44 Therefore, the minimum sample size was found to be 60 participants. Based on this finding and the predicted drop-out rates, data were collected from 66 participants. Of these, data from 61 participants were included in the analysis after excluding the outliers.
Data Analysis
For the statistical analyses, IBM SPSS (the Statistical Package for the Social Sciences) Windows Version 25.0 was used for the 4 steps described below.
The normality and homoscedasticity of dependent variables, including step count difference (e.g., pre-post, post–follow-up), the number of step count goals met, the increment of step counts per point, intervention satisfaction, and intervention usability, were examined. All satisfied the normality and homoscedasticity assumptions.
To examine the effectiveness of the lottery incentive across gender over time, a three-way mixed repeated-measures ANOVA (intervention group*gender*time) was performed for step counts. A two-way ANOVA was also performed for the number of step count goals met since such data were not collected from post-intervention to the follow-up. For both analyses, a Bonferroni correction was conducted when interaction was significant.
To investigate whether there were differences in the maintenance of effectiveness of the lottery incentive depending on group and gender, a three-way mixed repeated-measures ANOVA was performed for 47 participants who completed pre-intervention, post-intervention, and follow-up assessments. If there were significant interactions or main effects, a Bonferroni correction was performed. In addition, a Pearson correlation analysis was conducted between the total number of points and the step counts at the follow-up to investigate the association between the points during the intervention and the maintenance of effectiveness.
To test the cost-efficiency of the lottery incentive, an independent T-test was performed only for a group or gender in which the lottery incentive intervention was effective. The dependent variable was the increment of step counts per point, which was calculated by dividing the value obtained by subtracting the step count mean from the step counts during the intervention period by the obtained points.
Finally, to test whether there were gender and group differences in intervention satisfaction and usability, a two-way ANOVA was performed. If there were significant interactions or main effects, a Bonferroni correction was performed.
Results
Homogeneity Test of Pre-Intervention Scores
The results of a two-way ANOVA by group and gender showed no significant interaction (F(2, 55) = .16, P > .05) or main effect of group (F(2, 55) = .17, P > .05) or gender (F(1, 55) = .07, P > .05) in the daily average step counts during the baseline period. A chi-square test showed no significant differences in the gender ratios among groups (χ2(2) = .10, P > .05).
Effectiveness of the Intervention
Information about the pre-and post-intervention measurements by group and gender is presented in Table 3. The results of a three-way mixed repeated-measures ANOVA by time (pre-intervention, post-intervention), group (10% + B, 50% + M, 100% + S), and gender (male, female) showed that the three-way interaction among time, group, and gender was significant (Table 3). The results of the Bonferroni correction showed that there were significant increases in the step counts among males in the 10% + B (95% CI [697.29, 2238.88], P < .001) and 50% + M groups (95% CI [1085.87, 2539.29], P < .001), while there were no significant changes in the 100% + S group (95% CI [−112.94, 1340.48], P > .05). By contrast, there were significant increases in the step counts among females in the 100% + S group (95% CI [240.72, 1499.42], P < .01), while there were no significant changes in the 10% + B (95% CI [−1100.44, 158.26], P > .05) and 50% + M groups (95% CI [−1208.14, 106.52], P > .05).
Changes in Step Counts and Number of Goals Met after Intervention across Genders and Groups.

Note. a = 10%+B Group; b = 50%+M Group; c = 100+S Group; M = Male; F = Female; M(a) = Male in 10%+B Group; M(b) = Male in 50%+M Group; M(c) = Male in 100%+S Group; F(a) = Female in 10%+B; F(b) = Female in 50%+M Group; F(c) = Female in 100%+S.
***P < .001, **P < .01, * P < .05.
The two-way interaction of time and gender was also significant. The results of the Bonferroni correction showed that there were significant increases in the step counts among males (95% CI [869.93, 1726.36], P < .001), while there were no significant changes in the step counts among females (95% CI [−419.43, 318.21], P > .05). No other two-way interaction was significant. Although the main effects of group and gender were not significant, the main effect of time was significant. The results of the Bonferroni correction on the main effect of time showed that the post-intervention measurements of step counts were significantly higher than the pre-intervention measurements (95% CI [341.19, 906.34], P < .001) (see Figure 3).

Daily average step counts in pre-, post-intervention and follow-up by group and gender.
Furthermore, the analysis of the number of step count goals met showed that the two-way interaction for group and gender was not significant. The main effect of gender was significant, but the main effect of the group was not. The results of the Bonferroni correction on the main effect of gender showed that the number of step count goals met by males was significantly higher than that met by females, 95% CI [2.12, 7.83], P < .01 (see Table 3).
Maintenance of Effectiveness
Information about variables by group and gender of the participants in the follow-up assessment is presented in Table 4. First, a three-way mixed repeated-measures ANOVA by time (pre-intervention, post-intervention, follow-up), group (10% + B, 50% + M, 100% + S), and gender (male, female) as the dependent variables for the data of 47 students (males = 22, females = 25) who participated in the follow-up assessment (approximately 77% of the sample size at the post-intervention assessment) showed that the three-way interaction among time, group, and gender was significant (Table 4). The results of the Bonferroni correction showed that the difference in the step counts by group and time were not significant among females. By contrast, post-intervention step counts were significantly higher than pre-intervention step counts (95% CI [544.84, 2682.16], P < .01) and follow-up step counts (95% CI [575.60, 3410.61], P < .01) in the 10% + B group, while the differences between pre-intervention and follow-up step counts were not significant among males (95% CI [−1257.26, 2016.47], P > .05). In the 50% + M group, post-intervention step counts (95% CI [919.62, 2918.91], P < .001) and follow-up step counts (95% CI [224.97, 3287.26], P < .05) were significantly higher than pre-intervention step counts, and the differences between follow-up and post-intervention step counts were not significant (95% CI [−1162.80, 1489.10], P > .05). The difference in step counts by time were all not significant in the 100% + S group. Only the two-way interaction between time and gender was significant. The results of the Bonferroni correction showed that the difference in step counts by time was not significant among females. By contrast, among males, post-intervention step counts were significantly higher than pre-intervention step counts (95% CI [754.99, 1963.00], P < .001). Although the main effects of group and gender were not significant, the main effect of time was significant. The results of the Bonferroni correction showed that post-intervention step counts were significantly higher than pre-intervention (95% CI [242.49, 1074.09], P < .01) and follow-up step counts (95% CI [27.66, 1130.72], P < .05) (see Figure 3).
Changes in Step Counts and Number of Goals Met after Follow-Up across Genders and Groups.

Note. a = 10%+B Group; b = 50%+M Group; c = 100+S Group; M = Male; F = Female; M(a) = Male in 10%+B Group; M(b) = Male in 50%+M Group; M(c) = Male in 100%+S Group; F(a) = Female in 10%+B; F(b) = Female in 50%+M Group; F(c) = Female in 100%+S.
***P < .001, **P < .01, * P < .05.
The Pearson correlation analysis between the total number of points and step counts in the follow-up period showed that correlation was not significant (r(47) = .26, P > .05).
Cost-Efficiency of the Intervention
Information regarding the variables by group and gender are presented in Table 5, along with the mean total number of points given for each condition. An independent T-test showed that there were no differences in step counts per point (t(15) = −1.25, P > .05) between males in the 10% + B (M = .09, SD = .08) and 50% + M (M = .18, SD = .06) groups.
Changes in Step Counts per Point and Total Points Earned by Group and Gender.

Social Validity of the Intervention
The means and standard deviations of the intervention satisfaction and usability by group and gender are presented in Table 6. A two-way ANOVA by group (10% + B, 50% + M, 100% + S) and gender (male, female) showed that the interaction between group and gender was not significant (Table 6). The main effect of gender was not significant, but the main effect of the group was significant. The results of the Bonferroni correction showed that the intervention satisfaction of the 10% + B group was significantly lower than the intervention satisfaction of the 100% + S group (95% CI [−3.69, −.20], P < .05). Meanwhile, the results of the analysis of intervention usability showed that the interaction and main effect were not significant.
Intervention Satisfaction and Usability by Group and Gender.

Discussion
This pilot study examined whether there were differences in the effectiveness, maintenance of effectiveness, cost-efficiency, satisfaction, and usability of the lottery incentive via mobile devices to promote walking based on the chance of winning the lottery, the amount of the prize, and gender. Although the sample size is rather limited, the results have several important implications.
First, the effectiveness of the lottery incentive to promote walking did not vary according to the chance of winning or the amount of the prize when the expected value of the total prize was fixed. Although this only applied to the male participants, the results showed that both lottery incentive options (10% + B and 50% + M) were more effective in promoting walking than continuous reinforcement (100% + S). However, no differences in effectiveness were found between the 10% + B group and the 50% + M group. This is inconsistent with the claims of previous researchers that a lottery incentive that provides a bigger prize at a lower chance of winning would be more effective.49,50 Caution is needed when interpreting the results of this study because its experimental manipulations were different from those of previous studies. First, the expected value of the lottery and the maximum compensation were set at equal across all groups to ensure experimental control, inequality having been identified as a possible limitation in previous studies. Thus, while the amount of the prize for each lottery was different for the 50% + M group and the 10% + B group, the expectations of the participants ought to have been equal between the groups. In other words, because the participants had equal expectations about the prizes they would receive during the 66 days, the expected amount of the prize provided each day may have been underestimated or overestimated. Another possibility worth considering is that the maximum compensation ($80) was not only smaller than the prize values offered in previous studies (approximately $120–$500, but possibly even more)24,31,51 but also smaller than a college student’s monthly average spending in the Republic of Korea (approximately $600). 52 In other words, differences between the groups may be underestimated since the participants’ motivation levels were not high.
There were also differences among the lottery incentive groups in terms of the maintenance of effectiveness. Specifically, the effectiveness of the lottery incentive was maintained until 2 months after the termination of the intervention only among the males in the 50% + M group. This finding is partly in line with previous research reporting that physical activity regresses to the baseline level when the reward is stopped in CM.24,51,53 In this study, the participants in the 50% + M group received a prize more often than participants in the 10% + B group during the research period. 24 According to the general principle of behavioral change, frequent rewards during the initial stages of learning are necessary because learning becomes limited when the reward frequency is too low. 42 The results of this study can be interpreted as showing that learning was greater in the 50% + M group, in which the participants received a prize more frequently. Therefore, these results suggest possible additional treatment components, such as the use of a reinforcement thinning technique to gradually reduce the frequency and size of the reward as the intervention progresses, to promote the maintenance of effectiveness.42,54
Second, no differences between groups were found in terms of the cost-efficiency of the lottery incentive. Among males, there were no differences in the increments of step counts per point between the 10% + B group (M = .09, SD = .08) and the 50% + M group (M = .18, SD = .19). This result suggests that the cost-efficiency of the lottery incentive does not differ in relation to the chance of winning or the amount of the prize. Possible explanations for this unexpected finding are as follows. The results may have been because of the manipulations used in this study that made the expected value of the lottery equal by limiting the maximum total point value regardless of the group; the cost-efficiency of the lottery incentive may depend on the interaction between the chance of winning and the prize amount. Therefore, it is necessary to accumulate additional information on the cost-efficiency of the lottery incentive by manipulating the expected value per lottery according to the combination of the 2 factors. In contrast, although not statistically significant, there was an actual difference in the total number of points provided between 10% + B and 50% + B. This may mean that the results related to cost-efficiency originated from the relatively small number of participants.
However, the lottery incentive strategy may be relatively more cost-efficient than other CM strategies. During the entire research period, the cost per participant in the 10% + B and the 50% + M groups was approximately $1–3 per week. This was approximately 10% of the cost per participant in previous research ($10–40 per week) that used CM based on continuous reinforcement to promote physical activity. 55 Such differences in cost indicate that lottery incentives are a cost-efficient strategy suitable for mHealth, the goal of which is to provide effective intervention to multiple users at a low cost. 20 Furthermore, as described above, unlike other CM groups in which the effectiveness was not maintained when the reward was stopped, effectiveness was maintained for the 50% + B group in this study. This suggests not only that the cost of the lottery incentive is lower than that of other CM but also that the maintenance of effectiveness can be achieved by the lower cost. However, the present findings cannot be directly compared with the results of previous studies, which did not measure values related to cost-efficiency. Moreover, prior studies used dependent variables, such as gym visits and program attendance, rather than actual physical activity levels. Furthermore, the specific cost-efficiency of the lottery incentive may vary depending on the type of target behavior and demographic conditions. Therefore, future research must introduce similar lottery incentive strategies into the actual mHealth system to accumulate practical information about cost-efficiency.
Third, this study found that there were gender differences in the effectiveness of the lottery incentive in promoting walking. The results of the analysis showed that the lottery incentive was effective in promoting physical activity only among males. In females, the effective promotion of physical activity was only found in the continuous reinforcement schedule (100% + S group). 42 These results are consistent with prior research, which has reported low responsiveness toward lottery use among women.32,34 Some researchers claim that gender differences arise from the low satisfaction with and usability of lotteries as perceived by women.32,34 However, the results of the analysis in this study showed that there were no significant gender differences in intervention satisfaction or usability in any of the groups. Another explanation for the gender difference may be based on the differences in personality traits (e.g., risk-aversion or sensation-seeking),34,56,57 demographic variables, 58 the size of the reward, or the habit of carrying a smartphone. However, it may be premature to draw conclusions about the gender differences related to the lottery incentive. Further research is required to test several hypotheses because this study and previous studies did not investigate them.
One of the biggest contributions of this study is that it chose evidence-based treatment from the behavioral change literature as a strategy to promote walking through mHealth and successfully demonstrated its effectiveness and efficiency through an experimental study. The study suggests that the strategies proven to be effective in the literature on behavioral change can be successfully applied to the mHealth field but that this testing process should precede dissemination of the application in the market. This study constitutes a rare but valuable effort; the lack of theoretical and empirical evidence in mHealth applications has been noted as major criticism. 10
The limitations of this study and suggestions for future research are as follows. First, it is necessary to replicate the effectiveness and cost-efficiency of the lottery incentive and gender differences in large samples with equal gender ratios. The sample size of this study (61 participants) is comparable to that of similar studies,29,44 but it barely met the requirement of sample size suggested by the power analyses (n = 60), the numbers of gender per group were relatively small, and the gender ratio at the follow-up was uneven. Moreover, the participants in this study were young and healthy college students and thus could have been physically stronger and more motivated to gain monetary rewards than average, meaning that the results could have been negatively skewed, showing lottery incentives to be more effective and cost-efficient on step counts. Since this was a pilot study that only included college students, future studies should use a larger sample size and control gender ratio and motivational factors to validate the results of this study. Second, it will be worthwhile to assess the effectiveness of the lottery incentive when applying an mHealth system that can provide immediate rewards. This study used a delayed reinforcement strategy of providing the reward after a certain time had elapsed, rather than providing an immediate reward after the goal was met. The minimization of delay in the reward may result in different findings. Third, this study was conducted only on walking, because of reasons such as ease of measurement and convenience of performance. Thus, there may be some limitations in the generalizability of the results of this study to other types of physical activity, such as biking, hiking, and standing. Fourth, step counts are typically measured via the pedometer function of mobile applications in most mHealth studies, but possible gender differences in the step count because of the way the smartphone is carried cannot be ignored. This should also be examined in future studies.
Footnotes
Author Contributions
CL designed the experiments, provided data collection and analysis, and wrote the manuscript. This manuscript is based on the Master’s thesis of Author 1, submitted at Yonsei University, Seoul, Republic of Korea. KMC designed the experiment, managed the experiment, and wrote the manuscript.
Declaration of Conflicting Interests
The author(s) declared no potential conflicts of interest with respect to the research, authorship, and/or publication of this article.
Funding
The author(s) disclosed receipt of the following financial support for the research, authorship, and/or publication of this article: This study was supported by the Ministry of Science and ICT of the Republic of Korea and the National Research Foundation of Korea (NRF-2017M3C4A7083533).
Ethics Approval
This study was conducted after receiving approval from Yonsei University Institutional Review Board (Approval No.: 7001988-201910-HR-591-09).
Informed Consent
Informed consent was given by all participants. The authors affirm that human research participants provide informed consent for publication of this manuscript.
Data Availability
The dataset are available from the first author upon request. Email at
Code Availability
The program code is available from the first author upon request. Email at