
Abstract
Environment pollution was closely related to human health. The energy consumption is one of the important sources of environmental pollution in the development of economy. This paper used undesirable two-stage meta-frontier DDF (distance difference function) data envelopment analysis model to explore the impact of environment pollutants from energy consumption on the mortality of children and the aged, survival rate of 65 years old and health expenditure efficiency in 27 high income countries, 21 upper middle income countries, and 16 lower middle income countries from 2010 to 2014. High income countries had higher efficiency of energy and health than middle income countries in general. But whether in high income or middle income countries, the efficiency of non-renewable energy is higher than renewable energy. There was much room for both high income countries and middle income countries to improve renewable energy efficiency. Besides, middle income countries need to improve the efficiency of non-renewable energy and reduce pollutant emissions per unit of GDP. In terms of health efficiency, upper middle income countries performed worse than lower income countries. This phenomenon might indicate there was a U-shaped relationship between health efficiency and income level. Upper income countries should pay more attention to the environmental and health problems and cross the U-shaped turning point. The contribution of this article was to consider the heterogeneous performance of energy efficiency, environmental efficiency, and health efficiency under the influence of income level differences, and found that there might be a U-shaped relationship between health efficiency and income level.
Keywords
What do we already know about this topic?
There was a relationship between energy consumption, environmental quality and health quality in a country, such as the input-output relationship. Countries with different regions and income levels might have different energy efficiency, environmental efficiency, and health efficiency.
How does your research contribute to the field?
This paper had 2 main contributions. First, this paper analyzed the input-output relationships and differences in energy consumption efficiency, environmental efficiency, and health efficiency in different countries at different income levels. The second contribution of this article was to divide income levels into 3 levels and found that there might be a U-shaped relationship between health efficiency and income level.
What are your research’s implications toward theory, practice, or policy?
Middle income countries should increase the efficiency of non-renewable energy use, increase supervision of environmental pollution problems, promote the progress of energy-saving and emission-reduction technologies, and reduce pollutant emissions per unit of GDP.
High income countries should take advantage of economic development and technological bases to increase investment in research and development of renewable energy technologies and improve the efficiency of renewable energy. In addition, high income countries should take the initiative to help the surrounding middle income countries to improve efficiency, because efficiency may have spatial autocorrelation and there will be spillover effects.
Middle income countries should increase their fiscal expenditures to meet the medical needs of residents, popularize medical common sense, strengthen the construction of basic medical systems, improve the health conditions of children and reduce mortality rate of children.
Upper income countries should pay attention to the environmental and health problems that had occurred in the process of pursuing rapid economic development, improve the efficiency of the health treatment stage, and cross the U-shaped turning point, so as to achieve sustainable economic development.
Introduction
Kraft and Kraft 1 put forward economic development was always accompanied by energy consumption. Energy supplies power for human production and life and was an indispensable and important support for economic development. However, Chow et al 2 pointed out the mainly energy resources used by humans were non-renewable resources, and the exploitation and use of coal and oil would also cause a series of ecological environmental problems, such as air pollution. Clancy et al 3 believed that one of the important reasons why the air problems were attached importance to by human beings was that the environment was closely related to human health. No one could not breathe unless he was dead. The impact of air quality on human health was also obvious. The Great Smog of 1952 was a typical example. And the production of air pollutants was closely related to energy consumption. Therefore, there was an input-output relationship between energy consumption, air pollution and human health, and this input-output relationship was divided into 2 stages. In the first stage, the input of labor, energy and capital would promote economic development, but at the same time, air pollutants would be generated after energy consumption. In the second stage, the emission of air pollutants would have a negative impact on the environment and human body, so the government needed to increase health expenditure to alleviate human health problems.
Based on this logic, this paper uses undesirable two-stage meta-frontier DDF data envelopment analysis model to analyze the input-output relationship between energy consumption, environmental pollution, and human health. Among them, energy consumption is divided into renewable energy consumption and non-renewable energy consumption. In terms of environmental pollution, this paper mainly concerned about air pollution, so this paper selected CO2 emissions and PM2.5 to analyze. In terms of human health, this article useed the mortality rate of children under the age of 5, the mortality rate of people aged 15-65 and the survival rate of people over 65 to measure. Panayotou 4 proposed the concept of an Environmental Kuznets Curve (EKC), that was the relationship between environmental quality and per capita income level was inverted U-curve. Zhang et al 5 studied the total factor energy efficiency of 23 developing countries and found that energy efficiency had a relationship with per capita income. However, some of the existing literature used outdated data, and some of the classification of income levels was too simple to fit economic reality well. Feng et al6,7 had analyzed this topic according to the grouping of EU countries and non-EU countries, as well as new EU countries and old EU countries. However, Feng’s grouping method was not exactly the same as grouping by income level, and his classification was too simple, presupposing a linear relationship between economic development level and energy efficiency and health efficiency, which was far from reality. Therefore, considering that countries with different levels of economic development and living standards may have differences in the above aspects, according to the standards of the World Bank, this paper finally selects the panel data of 27 high income countries, 21 upper middle income countries and 16 lower middle income countries from 2010 to 2014 for comparative analysis.
The rest of this paper is arranged as follows: Section 2 provides literature review, Section 3 introduces research models and methods, Section 4 analyzes empirical research results, and Section 5 is conclusion and implications.
Literature Review
In the past literature on energy, there are 2 main directions. The first is to explore the energy use and environmental pollution efficiency of various countries. The second is to analyze the reduction of air pollution emissions and environmental efficiency. Table 1 summarizes the above-mentioned literature as research on energy, environmental efficiency, and air pollution issues.
Energy and Environmental Efficiency and Air Environmental Pollution.

The literature on environmental pollution and health mainly emphasizes the impact of air pollution on human health. It can also be divided into 2 aspects. One is the impact of environmental air pollution exposure on health and diseases. The second is the impact and harm of environmental air pollution on the health of children and the elderly. Table 2 summarizes the above literature as research on air pollution and health.
A Summary of Research on Air Pollution and Health.

Because the above studies mostly use traditional DEA methods and focus on static analysis, ignoring changes in dynamic time and of the studies that have used Malmquist DEA to dynamically analyze efficiency, such as Li et al 11 , Choi and Roberts 18 , Yao et al 17 , etc., used the Malmquist productivity index to analyze the country’s energy and environmental efficiency. Although the Malmquist productivity index can compare the changes in productivity between years, the model cannot explain the impact of technological progress between years. And most studies focus on energy use and environmental efficiency, but still neglect to consider important air pollution indicators such as PM2.5. Although some scholars discuss the impact of exposure to air pollution on human health, such as Pope et al 45 , Chen et al, 46 and others, all researchers point out that the occurrence of human diseases is related to the impact of air pollution, but there are still few studies that simultaneously discuss the 3 aspects of economy, energy, and health. Feng et al 6 divided the sample into EU countries and non-EU countries, and compared the energy consumption efficiency, environmental efficiency, and health efficiency of the 2 categories of countries. That paper takes into account the impact of income on the above 3 efficiency differences to some extent, but ignores some high-income countries that exist in non-EU countries. Although Feng et al 7 divided the EU countries into new countries and old countries and also discussed energy consumption efficiency, environmental efficiency, and health efficiency, they did not consider the impact of different countries’ income levels on overall efficiency. Besides, the grouping method of Feng et al 7 is too simple, presupposing a linear relationship between economic development level and energy efficiency and health efficiency, which is far from reality. In order to solve the lack of Malmquist index and consider the continuous change of time, this paper uses the undesirable two-stage meta-frontier DDF data envelopment analysis model, using the dynamic concept proposed by Tone, 57 which has the characteristics of inter-period continuation, and the important characteristics of carry-over as a link between different periods, it can explain the reasons for the changes between different years. At the same time, using the DDF model proposed by Färe et al., 58 this model can not only use the direction to produce the distance function, but also analyze the increase of good output and reduction of bad output, and considered the dynamic effect of a carry-over, to break through the problem of static analysis in the past research, and to consider the continuous problems of different periods at the same time, to better reflect the changes in different periods. This model can be more suitable for analyzing the input-output relationships and differences in energy consumption efficiency, environmental efficiency, and health efficiency in different countries at different income levels.
Research Method
Introduction to the DEA Model
Charnes et al 59 proposed the CCR model in 1978 to evaluate the performance of multiple inputs and multiple outputs with fixed returns to scale. Banker et al revised the assumption of fixed returns to scale to Variable Return to Scale (VRS) in 1984 and proposed the BCC model. CCR and BCC are non-radial estimation methods; Tone 60 proposed the Slacks-Based Measure (SBM) based on the balance variable model, and used non-radial estimation method to present efficiency. DDF (Direction Distance Function) is a commonly used efficiency measurement tool. Because DDF can deal with input reduction and increase output at the same time. Chung et al 61 proposed the output-oriented distance function concept, which was an extended orientation output distance function (RDF). The traditional DDF is a ray measurement mode, and the efficiency calculation fails to include all non-zero differences and all sources of inefficiency. Therefore, the efficiency value of the institute is overestimated. In order to solve this type of problem, Färe and Grosskopf 58 and Chen et al 62 established a non-directed direction distance function. Compared with other methods, this function is better because it provides a more reasonable and accurate estimate result.
In the traditional DEA’s efficiency evaluation, an efficiency conversion is performed between the 2 variables through input and output items. The conversion process is identified as a “black box.” Färe et al 63 proposed the Network Data Envelopment Analysis (Network DEA) model, which believed that the production process was composed of many secondary production technologies, and regarded the secondary production technology as a sub-decision unit (Sub-DMU). The best solution is to use the traditional CCR and BCC models. Zhu 64 described the value chain process as a “black box” and believed that it must contain some sub-processes, which constituted the value chain system. To estimate the efficiency of a system, it is necessary to evaluate the efficiency of each of these sub-processes. In order to analyze the efficiency of each sub-process, many scholars have tried. Chen and Zhu 65 , Kao and Hwang, 66 and Kao 67 divide the whole business process into sub-processes, and connect the stages through some intermediate outputs. They calculated the efficiency of each stage under different conditions and analyzed which sub-process caused the efficiency loss of the system. After Färe et al, 63 Tone and Tsutsui 68 proposed a weighted slack-based measures (SBM) network data envelope analysis model, using linkage among decision-making units as the analysis basis for the Network DEA model, and think of each department as a Sub-DMU, and then use the SBM model to find the optimal solution. In the network DEA model, in recent years, more and more literatures are devoted to the research of multi-stage production process and its efficiency evaluation. Although a large number of studies have focused on assessing the efficiency of the two-stage process, two-stage DEA also allows for a dynamic approach, in which DMUs are evaluated at different time periods and carryovers are introduced to connect the various stages that make up the DMU at different periods (Tone and Tsutsui 69 ). In terms of the dynamic DEA model, window analysis was proposed by Klopp, 70 which was first used for dynamic analysis. Subsequent developments include Malmquist, 71 Färe et al 72 Malmquist index (divided into catch up and innovation effect), but these analyses did not analyze the effect of Carry-over activities in these 2 periods. Färe and Grosskopf 73 first put inter-connecting activities in dynamic DEA model. Subsequent developments include Nemoto and Goto 74 adding some important insights on dynamic DEA, and Nemoto and Goto 75 proposed a method for using dynamic DEA to adjust to the optimal level of quasi-fixed investment instantly. Later, Sueyoshi and Sekitani 76 incorporated the concept of returns to scale into a dynamic DEA model. Amirteimoori 77 defined the DEA model to assess dynamic income efficiency and was modified and extended by Färe and Grosskopf. 78 Tone and Tsutsui 69 extended the model to dynamic analysis of slacks-based measures.
The evaluation performance of DDF non-ray distance function is better, and it can provide more reasonable and accurate estimation results. However, Färe et al 58 DDF non-ray distance function failed to consider the two-stage inter-temporal persistence effect and regional differences, so this article combines Tone and Tsutsui 69 dynamic two-stage DEA and O’Donnell et al 79 meta-frontier, proposes an undesirable two-stage meta-frontier DDF data envelopment analysis model. This paper uses this model to evaluate the energy efficiency and healthy efficiency in high income countries and middle income countries from 2010 to 2014 to avoid underestimation or overestimation of efficiency values and improvement space.
Undesirable Two-Stage Meta-Frontier DDF Data Envelopment Analysis Model
Assume that due to different management types, resources, regulations, or environments, all manufacturers (N) are composed of decision-making units (N = N1 + N2 +. . ..+ Ng) of g groups. Suppose there are 2 stages in each t time periods
Under the meta frontier, the decision unit k can choose the final output that is most favorable to its maximum value, so the efficiency of the decision unit k under the common boundary can be solved by the following linear programming procedure.
Overall efficiency:
The efficiency of the DMU is:

S.T.
energy efficiency stage healthy efficiency stage
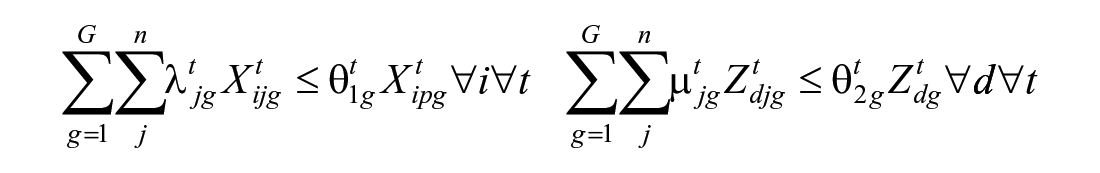


The link of 2 stages

The link of 2 periods (3)

Among them,
We can calculate the following 3 efficiency groups through the linear programming formula in model
(1) Stage efficiency:
The energy efficiency stage efficiency value is
The efficiency of stage L (L = 1, 2) of the DMU to be evaluated is evaluated relative to each period t

The healthy efficiency stage efficiency value is

(2) Period efficiency value
In this group, to evaluate the overall efficiency of each period t of the DMU being evaluated, it can be expressed as follows:

(3) The overall efficiency
In this group, the overall efficiency of the DMU being evaluated will be evaluated. The overall efficiency is given by the weighted sum of periodic efficiency on t, which can be expressed as:

From the above, the overall efficiency, period efficiency, division efficiency, and division period efficiency can be obtained using the meta-frontier model.
Group-Frontier
As each DMU under the group frontier chooses the most favorable final weighted output, the DMU efficiencies under the group frontier are solved using the following equations:
The efficiency of the DMU is:

S.T.
energy efficiency stage healthy efficiency stage

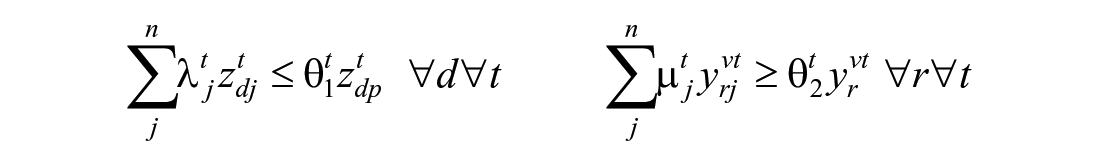


The link of 2 stages

The link of 2 periods (10)

Among them,
(1) Stage efficiency:
The energy efficiency stage efficiency value is
In this group, the efficiency of stage L (L= 1, 2) of the DMU to be evaluated is evaluated relative to each period t

The healthy efficiency stage efficiency value is

(2) Period efficiency value
In this group, to evaluate the overall efficiency of each period t of the DMU being evaluated, it can be expressed as follows:

(3) The overall efficiency
In this group, the overall efficiency of the DMU being evaluated will be evaluated. The overall efficiency is given by the weighted sum of periodic efficiency on t, which can be expressed as:

From the above results, the overall efficiency, the period efficiency, the division efficiency, and division period efficiency are obtained.
Technology Gap Ratio
As the meta-frontier model contains g groups, the technical efficiency of the meta-frontier (MFE) is less than the technical efficiency of the group frontier (GFE). The ratio value, or the technology gap ratio (TGR), is:

Energy and Health Efficiency
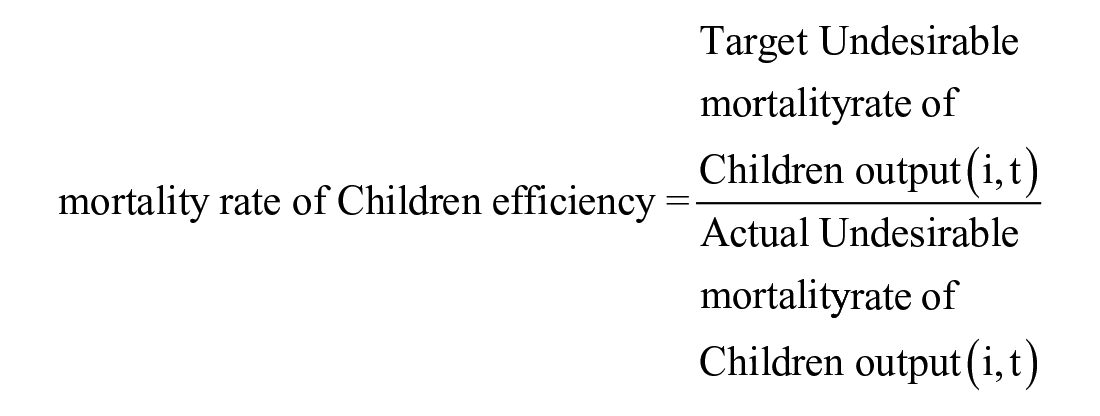
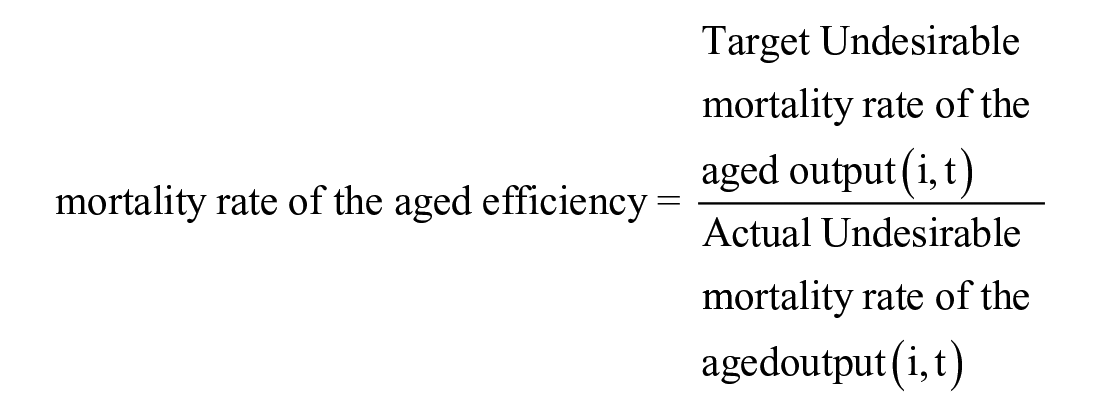
Hu and Wang’s 80 total-factor energy efficiency index was used to overcome any possible biases in the traditional energy efficiency indicators, for which there were ten key efficiency models; Labor, Renewable Energy, Non- Renewable Energy, GDP, health expenditure, mortality rate of Children, mortality rate of the aged, Survival rate of 65 years old, CO2 emissions, and PM2.5. In this study, “i” represented area and “t” represented time. The ten efficiency models are defined in the following:


If the target labor, renewable energy, non-renewable energy and health expenditure inputs equal the actual inputs, then the efficiencies are 1, which indicates overall efficiency; however, if the target labor, renewable energy, non-renewable energy and health expenditure inputs are less than the actual inputs, then the efficiencies are <1, which indicates overall inefficiency.
If the target desirable GDP and survival rate of 65 years old outputs are equal to the actual desirable outputs, then the efficiencies are 1, indicating overall efficiency; however, if the target desirable outputs are larger than the actual desirable outputs, then the efficiencies are <1, indicating overall inefficiency.
If the target undesirable mortality rate of children, mortality rate of the aged, CO2 emissions, and PM2.5 outputs are equal to the actual undesirable outputs, then the efficiencies are 1, indicating overall efficiency; however, if the target undesirable outputs are less than the actual undesirable outputs, then the efficiencies are <1, indicating overall inefficiency.
Empirical Analysis
Data Sources and Description
This study compares the energy efficiency and healthy efficiency in high income countries, upper middle income countries, and lower middle income countries from 2010 to 2014. The data in this paper is from the World Bank database. Now, there are 27 high income countries, 21 upper middle income countries, and 16 lower middle income countries in this paper.
The first stage: Production stage
Input variables: Labor: the number of employed people in a country over the age of 15 each year. Unit: million persons. Renewable energy: the annual renewable energy consumption of a country. Unit: Mega Joule. Non-renewable energy: the annual non-renewable energy consumption of a country. Unit: Mega Joule.
Output variables: GDP (desirable output): the sum of gross value added by all resident producers in the economy plus any product taxes and minus any subsidies not included in the value of the products. It is calculated without making deductions for depreciation of fabricated assets or for depletion and degradation of natural resources. Unit: billion dollars at current price.
The second stage: The health treatment stage
Input variables: Health Expenditure: total annual health expenditure in each country. Unit: billion dollars.
Output variables: Mortality rate of Children (undesirable output): the annual mortality rate of children under 5 years old in each country. Unit: percent. Mortality rate of the aged (undesirable output): the annual mortality rate of people over 65 years old in each country. Unit: percent. Survival rate (desirable output): the annual survival rate of 65 years old in each country. Unit: percent.
Link production stage and the health treatment stage variables
CO2: the annual CO2 emissions in each country. Unit: million ton.
PM2.5: Population-weighted exposure to ambient PM2.5 pollution is defined as the average level of exposure of a nation's population to concentrations of suspended particles measuring <2.5 microns in aerodynamic diameter, which are capable of penetrating deep into the respiratory tract and causing severe health damage. Exposure is calculated by weighting mean annual concentrations of PM2.5 by population in both urban and rural areas. Unit: micrograms per cubic meter.
Carry over production stage and the health treatment stage variable
Fixed assets: capital stock of each country is calculated by fixed assets investment in each country by the end of each year. Unit: billion dollars.
Annual Overall Efficiency Scores
Table 3 shows the annual overall efficiency of high income countries from 2010 to 2014. The overall efficiency of countries such as Brunei Darussalam, Iceland, Singapore, Saudi Arabia, Japan, and United States were always 1 in the 5 years from 2010 to 2014. The overall efficiency of Israel and Korea Rep. had ever reached 1 from 2010 to 2014. The overall efficiency of countries such as Belgium, Canada, Chile, Czech Republic, France, Germany, Greece, Netherlands, Poland, Portugal, and Spain were below the average overall efficiency from 2010 to 2014. Overall, there are 15 of the 27 high countries having the overall efficiency above the average efficiency. Besides, the overall efficiency of most of the high income countries are above 0.8. Therefore, high income countries have good performance in the overall efficiency in general.
Overall Efficiency of High Income Countries from 2010 to 2014.

Table 4 shows the annual overall efficiency of upper middle income countries from 2010 to 2014. None of these countries had kept an overall efficiency of 1 during the 5 years. The overall efficiency of Cuba, Georgia, and Irap had ever reached 1 from 2010 to 2014. The overall efficiency of Belarus, Bulgaria, China, Colombia, Kazakhstan, Malaysia, Mexico, Peru, Russian Federation, Serbia, South Africa, Thailand, and Turkey were below the average overall efficiency in most time from 2010 to 2014. Overall, there are only 8 of the 21 middle countries having the overall efficiency above the average efficiency. Besides, the overall efficiency of most of the upper middle income countries are below 0.6. Therefore, upper middle income countries have bad performance in the overall efficiency in general.
Overall Efficiency of Upper Middle Income Countries from 2010 to 2014.
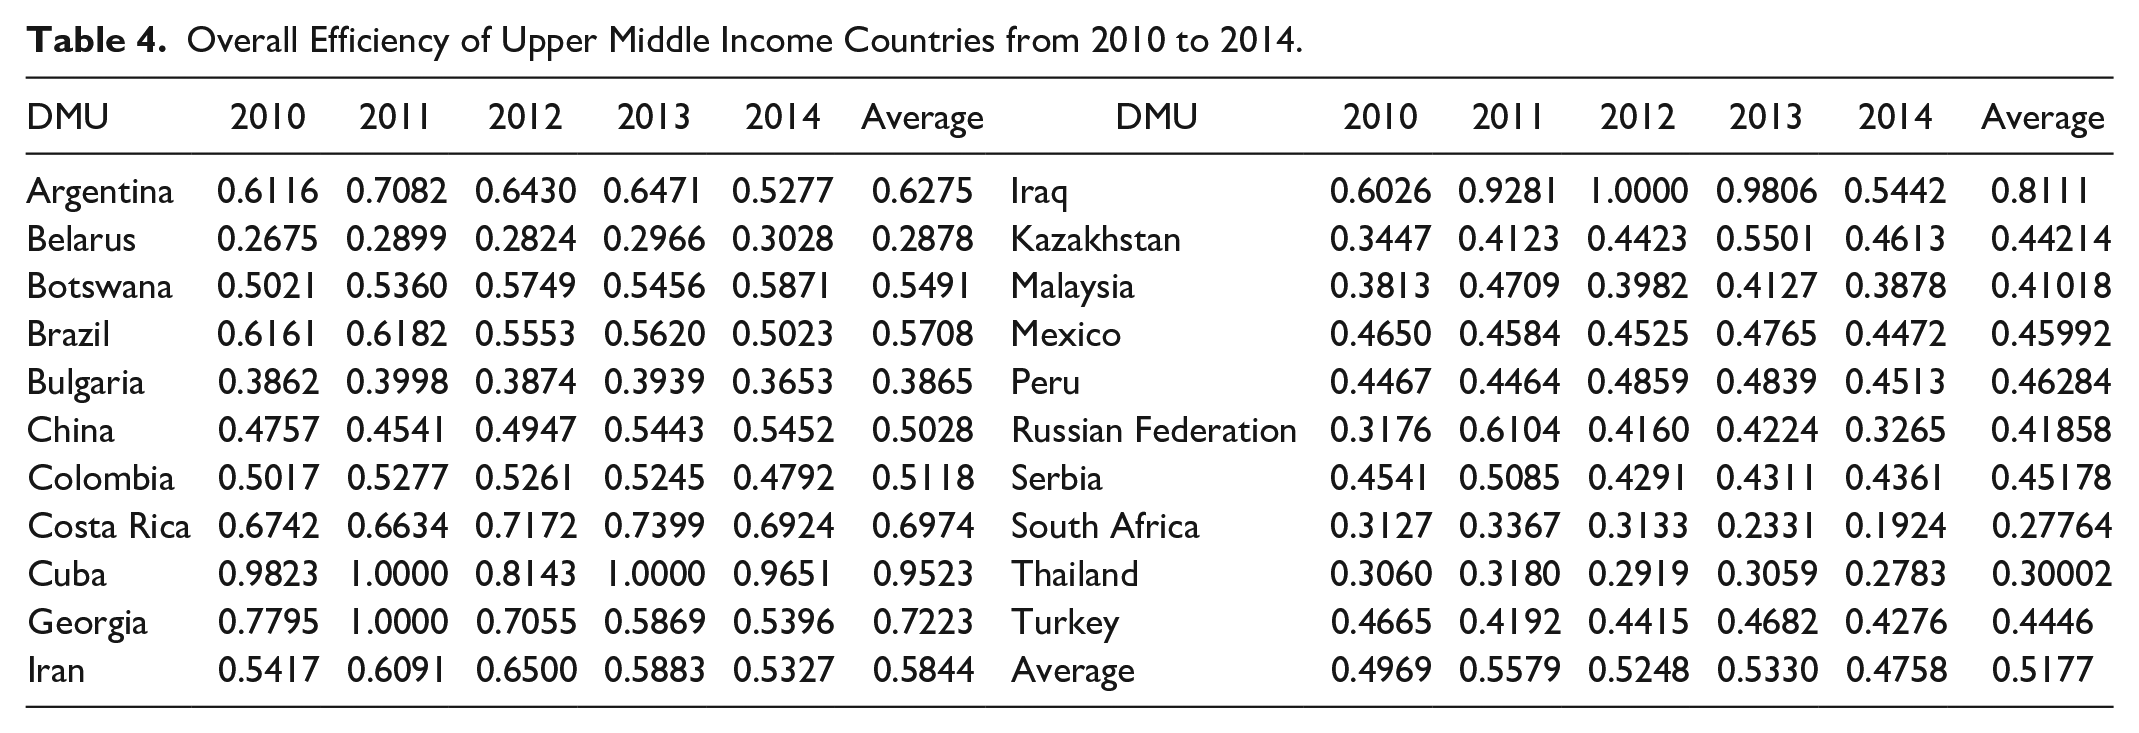
Table 5 shows the annual overall efficiency of lower middle income countries from 2010 to 2014. Only Cambodia had kept an overall efficiency of 1 during the 5 years. The overall efficiency of Kyrgyz Republic and Mongolia had ever reached 1 from 2010 to 2014. The overall efficiency of Bangladesh, India, Kenya, Morocco, Philippines, Tunisia, Ukraine, and Vietnam were below the average overall efficiency. Overall, there are only 8 of the 16 lower middle countries having the overall efficiency above the average efficiency. Besides, the overall efficiency of most of the lower middle income countries are below 0.6. Therefore, middle income countries have bad performance in the overall efficiency in general. However, the average overall efficiency of lower middle income countries was higher than that of upper middle income countries. It demonstrated that lower middle income countries have better performance in the overall efficiency than upper income countries in general.
Overall Efficiency of Lower Middle Income Countries from 2010 to 2014.

Through the comparison of the data in Tables 3, 4, and 5, we could find the average efficiency of high income countries was higher than that of upper and lower middle countries. Besides, there were 55.56% of high income countries, 38.09% of upper middle income countries and 50% of lower middle income countries having the overall efficiency above the average efficiency. Therefore, this might imply that there was a U-shaped relationship between overall efficiency and income level. This paper would discuss this phenomenon later. In addition, both high income countries and middle income countries in Eastern Europe have shown lower overall efficiency. Therefore, countries in Eastern Europe have greater room for improvement and need cooperation to improve overall efficiency. In addition, Western European countries should also pay close attention to the development of Eastern European countries and provide timely assistance to prevent negative spatial spillover effects.
Total Average Efficiency Scores Analysis in Each Stage
In order to specifically analyzed the differences in the overall efficiency of countries with different income levels, Table 6 showed the efficiency values at different stages. In the first stage, the efficiency of high income countries was above 0.9, and the efficiency value of middle income countries was around 0.5. The average efficiency of upper income countries is higher than that of lower middle income countries in general. In the second stage, the efficiency of high income countries was above 0.8, the efficiency value of upper middle income countries was around 0.45, and the efficiency value of lower middle income countries was around 0.56.
Average Overall Efficiency in Each Stage.

Figure 1 showed more clearly the difference of trends and gaps in efficiency between the high income countries and middle income countries in 2 stages. The efficiency of the first stage of high income countries showed a steady trend of fluctuations, with no obvious upward or downward trend. However, the efficiency of upper middle income countries and lower middle income countries showed significant differences in the 2 stages. This phenomenon would help explain the U-shaped relationship mentioned above. Though the efficiency of upper middle income countries and lower middle income countries were not much different in the first stage, the efficiency of lower middle income countries was significantly higher than that of upper middle income countries in the second stage. The reason for this phenomenon might be that upper income countries were in the stage of accelerating industrialization and rapid economic development, and a large number of environmental and medical problems had been accumulated in the early stage. Therefore, the efficiency of upper income countries in the second stage was lower than that of lower income countries.

Average annual overall efficiency in each stage.
The Technical Efficiency of the Group Frontier for High Income and Middle Income Countries
Table 7 showed the technology gap ratio (TGR) of high income and middle income countries from 2010 to 2014. Due to space limitations, this article did not list the TGR for each country. Table 5 showed the average overall TGRs of high income countries were higher obviously than that of middle income countries. However, the average overall TGRs of lower income countries was higher than that of upper middle income countries. In the first stage, the TGRs of high income countries were above 0.9, while the TGRs of middle income countries were below 0.7. In the second stage, the TGRs of high income countries were also above 0.9 while the TGRs of middle income countries were below 0.66. Besides, the TGRs of upper middle income countries was lower than that of lower income countries in each stage, and it was more significant in the second stage. Therefore, compared with high-income countries, middle income countries had a bigger gap between group frontier (GF) and meta-frontier (MF) in the energy efficiency and health efficiency. The phenomenon that the TGRs of upper income countries was lower than the TGRs of lower income countries implied that there was also a U-shaped relationship in terms of income levels and TGR.
Average TGRs of High Income and Middle Income Countries.

The Efficiency of the Input and Output Variables
Table 8 contained the data of annual average efficiency of each variable in the production stage. Labor, renewable energy and non-renewable energy were the input variables and GDP, CO2 and PM2.5 were the output variables. The data reflected the input and output efficiency of energy.
Comparison of Energy Efficiency.

Firstly, from the perspective of energy input, non-renewable energy was more efficient than renewable energy in general. However, there was some difference between high income countries and middle income countries. Firstly, high income countries had higher efficiency of renewable energy and non-renewable energy than middle income countries. Secondly, the gaps between renewable efficiency and non-renewable energy efficiency in high income countries and lower income countries were greater than in upper middle income countries. Thirdly, the renewable efficiency of upper middle income countries was higher than that of lower income countries. Therefore, there were much room for upper middle income countries to improve renewable energy and non-renewable energy efficiency. Besides, lower income countries should also improve renewable energy efficiency.
Secondly, from the perspective of energy output, GDP is the desirable output, CO2 and PM2.5 are undesirable outputs. It was obvious that high income countries had higher efficiency in GDP, CO2 and PM2.5 than middle income countries. However, there was some difference in the efficiency of middle income countries. The efficiencies of GDP in upper middle income countries and lower middle income countries were roughly equal from 2010 to 2014. But the efficiency of CO2 and PM2.5 in upper middle income countries and lower middle income countries were opposite. Upper middle income performed better in PM2.5, while lower middle income countries performed CO2.
Table 9 contains the data of annual average efficiency of each variable in the health treatment stage. Health expenditure is the input variable. Mortality rate of children, mortality rate of the aged and survival rate of 65 years old are the output variables. The data also reflects the input and output efficiency of health treatment.
Comparison of Health Efficiency.
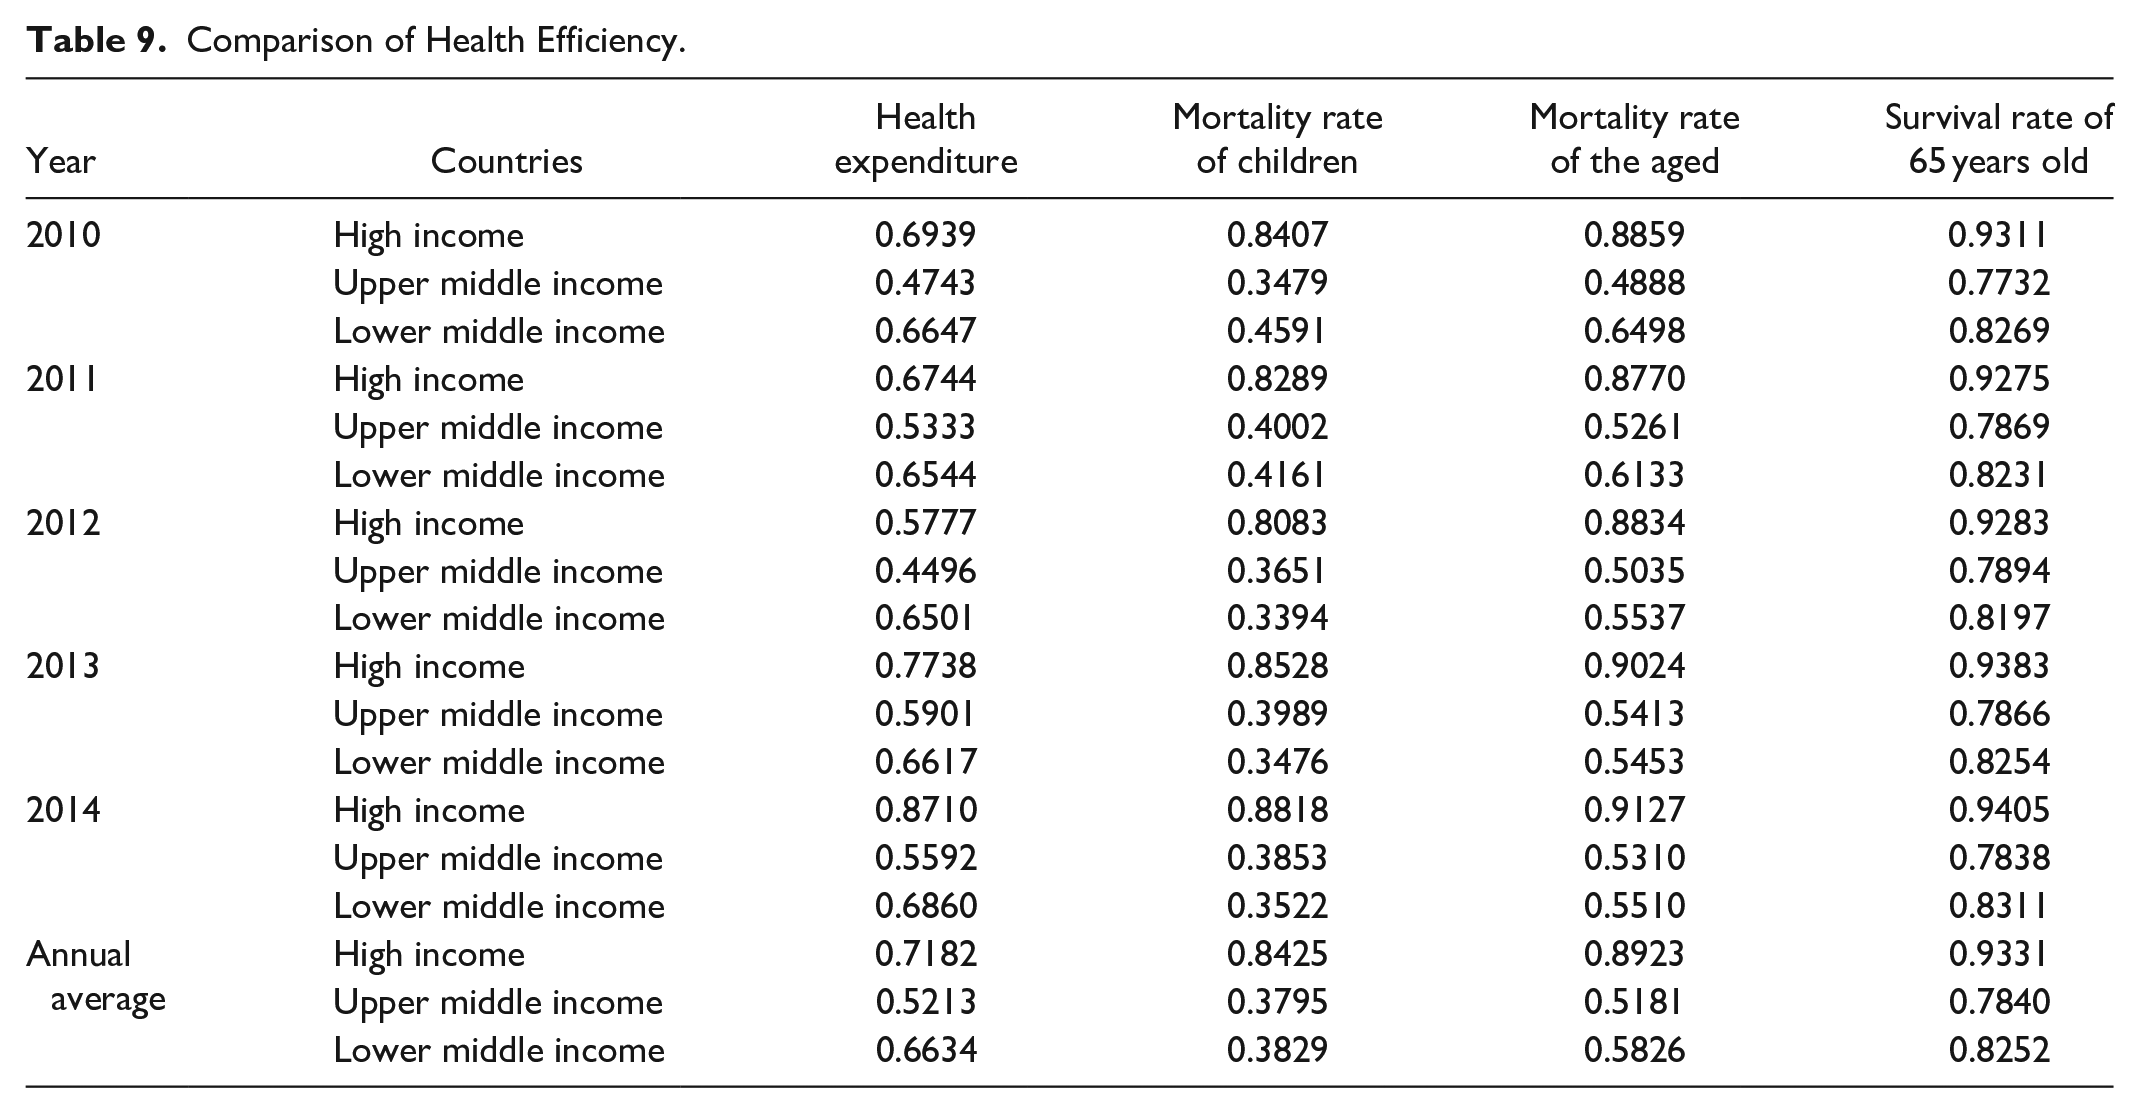
Firstly, from the perspective of health treatment input, high income countries performed better than middle income countries, and lower middle income countries performed better than upper middle income countries. Secondly, from the perspective of health treatment output, survival rate of 65 years old is the desirable output, mortality rate of children and mortality rate of the aged are undesirable outputs. It is obvious that high income countries have higher efficiency in mortality rate of children, mortality rate of the aged and survival rate of 65 years old than middle income countries, especially in mortality rate of children. Lower middle income countries performed better than upper middle income countries in mortality rate of children, mortality rate of the aged and survival rate of 65 years, especially in mortality rate of the aged.
Conclusions and Implications
This paper focused on the energy efficiency and health efficiency in high income countries and middle countries from 2010 to 2014. Furthermore, in order to better understand the health and energy efficiency performance of various countries at different income levels, this paper further refined the income level, which was divided into 2 categories: upper middle income countries and lower middle income countries. This paper calculated the efficiency for the inputs and outputs of the production stage and health treatment stage in high income countries and middle countries using undesirable two-stage meta-frontier DDF data envelopment analysis model. The efficiency we calculated included the efficiency of non-renewable energy, renewable energy, PM2.5, CO2, labor, GDP, health expenditure, mortality rate of children, mortality rate of the aged, and survival rate of 65 years old. This paper drew some conclusions by comparing and analyzing the efficiency of high income countries, upper middle income countries, and lower middle income countries. The detail conclusions were as follows:
The overall efficiency of high income countries was higher than middle income countries in general from 2010 to 2014. The average overall efficiency of high income countries was about 0.87 while the average overall efficiency of upper middle income countries was only about 0.50 and the average overall efficiency of lower middle income countries was about 0.55. Besides, there were 55.56% of high income countries, 38.09% of upper middle income countries, and 50% of lower middle income countries having the overall efficiency above the average efficiency.
There was a U-shaped relationship between health efficiency and income level. As the data showed, the efficiency performance of upper middle income countries in the health treatment was worse than that of high income countries and lower middle income countries. Specifically, the performance of upper middle income countries in health expenditure, mortality rate of children, mortality rate of the aged and survival rate of 65 years old was worse than the others.
In the production stage, the efficiency of high income countries is higher than middle income country and the gap between high income countries and middle income countries was widening. Besides, the efficiency of upper middle income countries was higher than that of lower middle income countries but the gap between upper middle income countries and lower middle income countries was small. Thus, there is much room for middle income countries to improve the efficiency of the first stage, namely energy efficiency.
Non-renewable energy was more efficient than renewable energy in general. Whether in high income or middle income countries, the efficiency of non-renewable energy was higher than renewable energy. High income countries should improve renewable energy efficiency because the gaps between renewable energy efficiency and non-renewable energy efficiency in high income countries are greater than in middle income countries.
Middle income countries produced more air pollutants than high income countries under the same conditions of economic growth from 2010 to 2014. The gaps between high income countries and middle income countries in the efficiency of GDP were about 0.1 from 2010 to 2014. But the gaps between high income countries and middle income countries in the efficiency of CO2 and PM2.5 were about 0.3 from 2010 to 2014.
There were much more room for middle income countries to reduce the mortality rate of children and mortality rate of the aged. The efficiency of mortality rate of children and mortality rate of the aged are only 0.5 and 0.8, respectively, which were very lower than high income countries.
Based on the above discussions, this paper puts forward the following practical and positive suggestions for improving the efficiency for high income countries and middle income countries.
Middle income countries should increase the efficiency of non-renewable energy, increase supervision of environmental pollution problems, promote the progress of energy-saving and emission-reduction technologies, and reduce pollutant emissions per unit of GDP.
High income countries should take advantage of economic development and technological bases to increase investment in research and development of renewable energy technologies and improve the efficiency of renewable energy. In addition, high income countries should take the initiative to help the surrounding middle income countries to improve efficiency, because efficiency might have spatial autocorrelation and there would be spillover effects.
Middle income countries should increase their fiscal expenditures to meet the medical needs of residents, popularize medical common sense, strengthen the construction of basic medical systems, improve the health conditions of children, and reduce mortality rate of children.
Upper income countries should pay attention to the environmental and health problems that had occurred in the process of pursuing rapid economic development, improve the efficiency of the health treatment stage, and cross the U-shaped turning point, so as to achieve sustainable economic development.
Footnotes
Declaration of Conflicting Interests
The author(s) declared no potential conflicts of interest with respect to the research, authorship, and/or publication of this article.
Funding
The author(s) disclosed receipt of the following financial support for the research, authorship, and/or publication of this article: This study was supported by the International Innovation Team Program in Philosophy and Social Sciences of Jilin university “China’s foreign trade and financial cooperation under the BRI” (2019GJTD03), the Major Program of the Key Research Base of Philosophy and Social Sciences of Jilin University “The Economic Dependence of China, Japan and Korea and the Construction of New Economic Cooperation under the BRI” (2019XXJD04).