
Abstract
Participation in the Medicare Quality Payment Program’s Merit Based Incentive Payment System (MIPS) has forced many healthcare administrators to strategize how to achieve success under value-based payment systems. A financial model was constructed to determine the marginal utility of compliance with various MIPS measures. Solo, small, medium, large, and very large practices were modeled using available data and final rules published by the United States Department of Health and Human Services (HHS). The model analysis found that small groups were generally incentivized not to comply with MIPS measures. Conversely, larger organizations were found to have strong financial incentives to maximize pursuit of MIPS measures. Incentives to pursue interoperability investments were projected to be generally under $10 200 for small organizations but approximately $690 000 for very large practices whereas the health information technology (IT) resources necessary to pursue these measures may not have nearly the same range of costs. In light of these findings, small groups may be driven to join larger groups as large groups continue to capitalize on their larger incentives to pursue MIPS measures. As financial success under MIPS is dependent on scale, healthcare systems that pursue consolidation may achieve greater success under quality payment programs similar to MIPS which include the newly proposed MIPS Value Pathways (MVPs).
Financial incentives for participation in the Merit-Based Incentive Payment System (MIPS) and the associated reporting burden disproportionately impacts healthcare organizations across the United States.
Our model provides a means to project Medicare reimbursement enhancement as a function of performance in Promoting Interoperability (PI) measures.
Our research suggests that the current MIPS program design may continue to catalyze consolidation in physician groups and make it extremely difficult for small practices to remain financially viable if they are heavily dependent on Medicare revenue.
Introduction
The passage of the Medicare Access and CHIP Reauthorization Act (MACRA) by Congress and the subsequent creation of the Quality Payment Program (QPP) by the Center for Medicare and Medicaid Services (CMS) streamlined a system of performance-based payment adjustments to Medicare reimbursement. The QPP program began in 2017 and now consists of the Merit Based Incentive Payment System (MIPS) and Advanced Alternative Payment Model (APM).
At present, the MIPS score measures a provider organization’s performance in 4 key areas: quality, cost, promoting interoperability (PI), and improvement activities. The subsequent score received and the range in which it is classified for a given performance year forms the basis for either a negative, neutral, or positive Medicare Part B payment adjustment 2 years following the performance year (PY). Figure 1 illustrates how organizations are subject to a negative, neutral, or positive adjustment if the MIPS score achieved falls below the performance threshold, at the performance threshold, or above the performance threshold for the given year, respectively.

CMS projected payment adjustments increase from ±4% for 2017 performance to ±9% for 2020 performance. Due to participation trends and budget neutrality, however, CMS revised the first maximum payment adjustment received in 2019 to 1.88%, far lower than the 4% originally projected. 1 By law, any positive payment adjustments made to providers that score above the performance threshold but below the exceptional performance threshold must be offset by negative payment adjustments from providers that fail to meet the performance threshold. 2 Congress approved $500MM per year through 2022 to be used as an exceptional performance bonus pool that is distributed among providers that meet or exceed the exceptional performance threshold for the given year. 2 The incentive bonus pool provides a means for CMS to reward top performers and incentivize exceptional performance.
Due to the potentially substantial economic incentives, provider organizations must strategize how best to position themselves to be successful under the program. PI compliance is of interest to many organizations given that PI is resource intensive, the resources are directly linked to performance, and PI represents a significant portion of the overall score. Satisfying MIPS performance measures requires extensive capital investment on behalf of MIPS eligible entities in a regulatory environment of shifting compliance parameters. For example, organizations must decide whether they will participate in the new PDMP query bonus that was recently introduced in PY 2019, among other recent program changes. Thus, organizations face annual uncertainty and must expend resources toward the development of a strategy to maximize Medicare revenue enhancement consistent with organizational priorities while not falling behind other organizations in performance rankings and public view.
In order to determine the optimal health IT strategy to maximize PI performance amid MIPS program constraints, a financial model was created. The model was used to calculate the break-even cost point for the implementation of health IT resources necessary to achieve PI performance goals.
Study Data and Methodology
The financial model was constructed using the most recently published MIPS performance score data. We used the CMS projection of a maximal 1.11% base incentive performance bonus and 3.58% maximum exceptional performance bonus for PY 2019 as the basis for the financial model calculations. 3 For PY 2019, a MIPS score of 0 to 29 was deemed below the performance threshold of 30 and was subjected to an adjustment of up to −7%. The 1.11% maximum base incentive was spread proportionally over the MIPS score range 30 to 100. MIPS scores between 75 and 100 received a 3.58% exceptional performance bonus spread proportionally. As a result, a score between 30 and 74 received an incremental positive adjustment ranging from 0.00% to 0.70%. Similarly, scores between 75 and 100 received an incremental positive adjustment ranging from 0.85% to a maximum of 4.69%. The modeled payment adjustments in relation to MIPS score received are illustrated in Figure 2.

Projected payment adjustments by MIPS score for PY2019.
PY 2019 MIPS scoring guidelines were implemented. Provider groups were classified as individual (1 provider), small group (2-15 providers), medium group (16-99 providers), and large group (100+ providers). The midpoint of the range of providers for a given group was used in computing Medicare Part B revenue for the group. In the absence of CMS distribution data, large provider groups were split into 2 groups—one with 100 providers and another with 500 providers. The average annual Medicare payment per provider reflected by CMS in 2017, $75 000, was used to estimate the group revenue. 4 Total group Medicare revenue approximated here is displayed in Table 1. For reference, Figure 3 shows the distribution of payment adjustments by group size for the first year of MIPS.
Medicare Part B Revenue by Group Size.

Note. This table summarizes the total Medicare Part B revenue calculated for each organization size based on the calculated average Medicare Part B revenue generated by a single provider in the United States.

Distribution of payment adjustments by group size for PY2017. 3
MIPS payment adjustment by group size data from the 2017 CMS QPP Experience Report Appendix was used to approximate the distribution of MIPS performance in PY 2017. 5 The negative payment adjustment MIPS score range, neutral payment adjustment MIPS score, positive payment adjustment MIPS score range, and exceptional performance MIPS score range as reported by CMS were 0 to 1.4, 3, 3.0 to 70, and 70 to 100, respectively. The midpoint of the range was used in the model except for negative and neutral adjustments. The performance level threshold was used for neutral adjustments as this was the only group to receive this adjustment. 5 A MIPS score of zero was used for negative adjustments due to a small negative adjustment score range (1.4 points out of 100) and also because many participants in this category were likely to have reported a score of zero or did not report. As a result, the MIPS percentage scores chosen to represent the negative payment adjustment range, neutral adjustment range, positive adjustment range, and exceptional performance adjustment range were 0, 3, 37, and 85, respectively. The number of National Provider Identifiers (NPIs) per group and by payment adjustment in addition to the representative score by payment adjustment were used to generate a sample distribution from which quartile MIPS scores were computed.
The approximation of group MIPS performance under varying conditions was performed by quartile using approximate MIPS scores. The PI category was varied while all other performance variables were held at the quartile (25th, 50th, or 75th percentile) level of performance. For example, the 50th percentile among small groups earned a score of 37/100 or 37% of available MIPS points. Therefore, the 50th percentile among small groups was modeled using a score of 37% of available MIPS points in all non-PI categories. This accounts for variations among point allocations between performance years. In PI participation scenarios, the model assumed the same overall score (37% in this case) for PI measure performance. Non-participation in PI was modeled as a score of zero for PI measures. The PDMP query bonus measure was modeled as a binary input with points earned toward the PI category if the measure was fulfilled. Group specific costs of implementation were not projected due to the variability and proprietary nature of these data.
Results
Case A—The Individual Practice
The individual practice model consisted of a solo provider earning an annual Medicare Part B revenue of $75 000. 4 Performance at the 25th, 50th, and 75th percentile among peers was considered. However, because performance at the 25th and 50th percentile was equivalent in this case, it was modeled jointly.
50th percentile and below among peers
As shown in Figure 4, the model projects that the solo practice performing at the 50th percentile or below would be subject to a penalty as large as $580 if it did not participate in PI. Choosing to participate in PI would result in a potential bonus of $95 in revenue. The financial implication of PI participation in this case is the sum of the avoided potential $580 penalty and the incentive potential $95 bonus, that is, $675. The costs associated with PI participation must be less than $675; otherwise, nonparticipation is most prudent. Despite the fact that this solo practice would likely absorb a financial loss due to the imposition of a penalty, if participation in PI measures would result in an even greater loss, the solo provider would not participate if the decision is financially driven. Participation in the new bonus PDMP query measure would not be advised as the solo group would expect to earn $15 for implementation that is sure to be outweighed by the cost.

Projected MIPS financial impacts on the individual practice for PY2019.
75th percentile among peers
As shown in Figure 4, there would be no penalty imposed for a solo practice performing at this level due to a high level of performance in other MIPS areas. Should the practice decide against participation in PI measures, the model projects it would receive a potential bonus of about $400. A decision to participate in PI measures would result in a potential bonus of about $1800. The financial implication of PI participation in this case is the difference between the incentive potential $1800 bonus of PI participation and the incentive $400 bonus due to pre-existing performance in other MIPS areas, that is, $1400. The costs associated with PI participation must be less than $1400; otherwise, nonparticipation is most prudent from the financial perspective. Participation in the new bonus PDMP query measure would not be advised as the solo group would expect to earn $230 for implementation that is sure to be outweighed by the cost.
Case B—The Small Group
The small group was modeled as 7 providers earning a combined annual Medicare Part B revenue of $520 000. Performance at the 25th, 50th, and 75th percentile among peers was considered.
25th percentile among peers
As shown in Figure 5, the model projects that a small group performing at this level may be subject to a potential penalty as large as $37 000 should it decide not to participate in PI measures. Due to this group’s low level of performance in other MIPS areas, participation in PI objectives will result in the same penalty. Participation or non-participation results in the same financial implication for a group in this position; therefore, there is no incentive for participation. Healthcare administrators would be better off exploring the quality category for areas of potential compliance since quality is the highest weighed category under MIPS and thus each point gained in quality will have the greatest impact on the group’s overall MIPS score. In general, administrators of groups performing at this level would be prudent to explore less-capital intensive means of earning a MIPS score that will not subject them to a negative adjustment. Participation in the new bonus PDMP query measure would not be advised as the small group in this position would not earn any additional revenue considering the low overall performance in MIPS.

Projected MIPS financial impacts on the small group for PY2019.
50th percentile among peers
As shown in Figure 5, the model projects that a small group performing at this level may be subject to a potential penalty as large as $4100 should it decide against participation in PI measures. A decision to participate in PI measures would result in a potential bonus of about $670. The financial implication of PI participation in this case is sum of the avoided potential $4100 penalty and the incentive $670 potential bonus, that is, $4770. The costs associated with PI participation must be less than $4770, otherwise nonparticipation is most prudent and the group would do better by absorbing the financial penalty. Participation in the new bonus PDMP query measure would not be advised as the small group would expect to earn $80 for implementation which would be outweighed by the cost.
75th percentile among peers
As shown in Figure 5, there would be no penalty imposed for a small group performing at this level due to a high level of performance in other MIPS areas. Should the group decide against participation in PI measures, the model projects it would receive a potential bonus of about $2800. A decision to participate in PI measures would result in a potential bonus of about $13 000 in revenue. The financial implication of PI participation in this case is the difference between the incentive potential $13 000 bonus of PI participation and the incentive $2800 bonus due to pre-existing performance in other MIPS areas, that is, $10 200. The costs associated with PI participation must be less than $10 200, otherwise nonparticipation is most prudent. Participation in the new bonus PDMP query measure may be advantageous if the group can implement it for less than $1600.
Case C—The Medium Group
The medium group was modeled as 42 providers earning a combined annual Medicare Part B revenue of $3 100 000. Performance at the 25th, 50th, and 75th percentile among peers was considered. However, because performance at the 50th and 75th percentile was equivalent in this case, it was modeled jointly.
25th percentile among peers
As shown in Figure 6, the model projects that a medium group performing at this level may be subject to a potential penalty as large as $24 000 should it decide against participation in PI measures. Electing to participate in PI measures would result in a potential bonus of $4000. The financial implication of PI participation in this case is sum of the avoided potential $24 000 penalty and the incentive potential $4000 bonus, that is, $28 000. The costs associated with PI participation must be less than $28 000; otherwise, the logical group would decide on a policy of nonparticipation. Participation in the new bonus PDMP query measure would not be advised as the medium group would expect to earn $500 for implementation which would be outweighed by the cost.
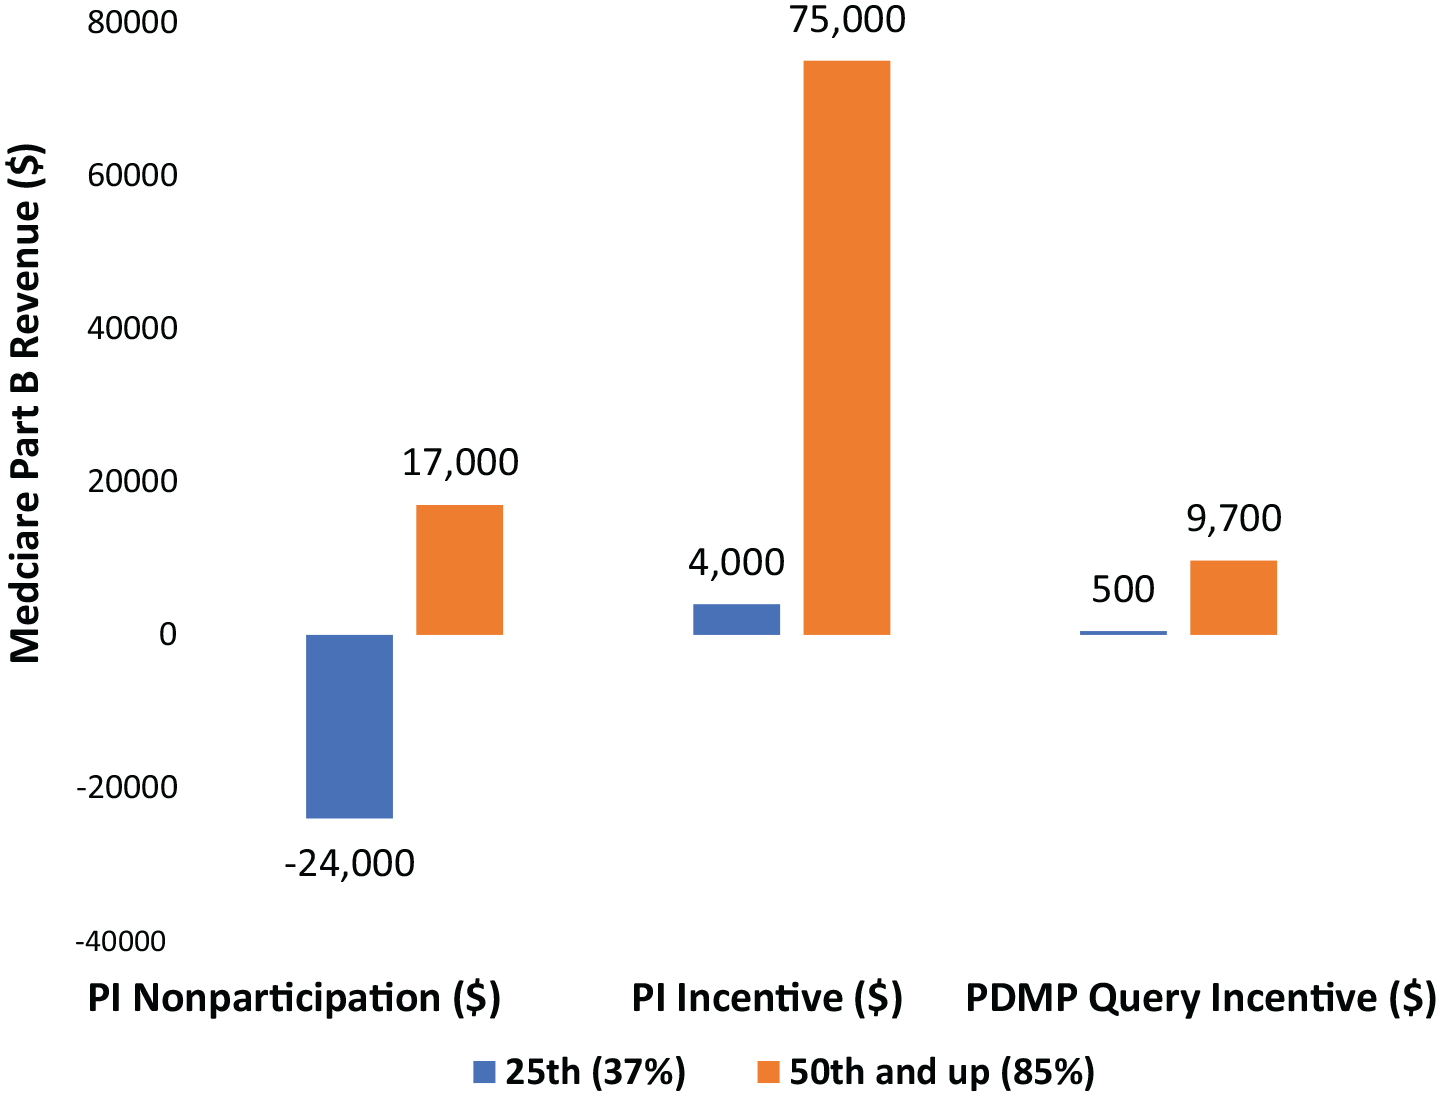
Projected MIPS financial impacts on the medium group for PY2019.
50th percentile and above among peers
As shown in Figure 6, there would be no penalty imposed for a medium group performing at this level due to a high level of performance in other MIPS areas. Should the group decide against participation in PI measures, the model projects it would receive a potential bonus of about $17 000. A decision to participate in PI measures would result in a potential bonus of about $75 000. The financial implication of PI participation in this case is the difference between the incentive potential $75 000 bonus of PI participation and the incentive $17 000 bonus due to pre-existing performance in other MIPS areas, that is, $58 000. The costs associated with PI participation must be less than $58 000; otherwise, the group would not participate. Participation in the new bonus PDMP query measure may be favorable for the medium group as long as implementation costs are below $9700.
Case D—The Large Group (100 providers)
The 100-provider large group was modeled with a combined annual Medicare Part B revenue of $7 500 000. Large groups performed well across the board with equal performance seen among the 25th to the 75th percentile. As shown in Figure 7, there would be no penalty imposed for a large group performing in this range due to a high level of performance in other MIPS areas. Should the group decide against participation in PI measures, the model projects it would receive a potential bonus of about $40 000. A decision to participate in PI measures would result in a potential bonus of about $180 000. The financial implication of PI participation in this case is the difference between the incentive potential $180 000 bonus of PI participation and the incentive $40 000 bonus due to pre-existing performance in other MIPS areas, that is, $140 000. The costs associated with PI participation must be less than $140 000; otherwise, the group would not participate. The model found that large groups have larger incentives than solo practitioners, small groups, and medium groups to participate in PI objectives. Participation in the new bonus PDMP query measure would be favorable for the large group as the costs of implementation are expected to be less than the incentive bonus of $23 000.

Projected MIPS financial impacts on the large group for PY2019.
Case E—The Very Large Group (500 providers)
Very large groups were modeled as 500 providers earning a combined annual Medicare Part B revenue of $37 000 000. Compared to large groups (100 providers), very large groups (500 providers) performing at the 25th percentile or above among peer groups have even stronger incentives to participate in PI objectives. As shown in Figure 8, there would be no penalty imposed for a very large group performing in this range due to a high level of performance in other MIPS areas. Should the group decide against participation in PI measures, the model projects it would receive a potential bonus of about $200 000. A decision to participate in PI measures would result in a potential bonus of about $890 000. The financial implication of PI participation in this case is the difference between the incentive potential $890 000 bonus of PI participation and the incentive $200 000 bonus due to pre-existing performance in other MIPS areas, that is, $690 000. The costs associated with PI participation must be less than $690 000, otherwise the group would not participate. The model also predicts that an organization of this size would also likely pursue compliance with the new PDMP query bonus measure to receive an additional potential bonus of $120 000 which is expected to be lower than the costs of implementation.
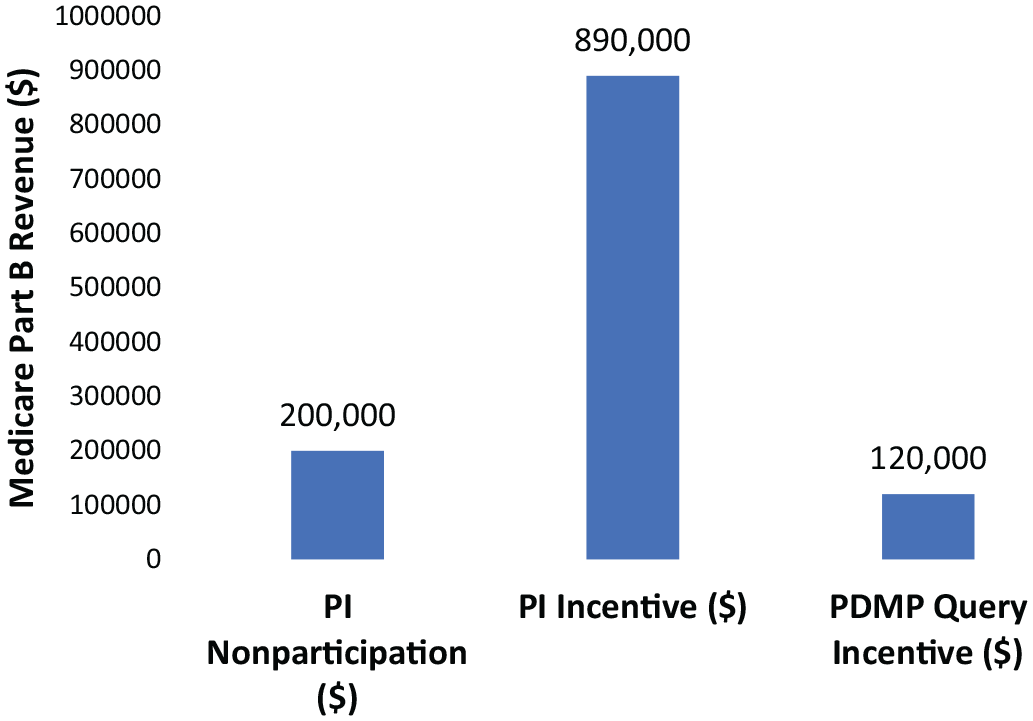
Projected MIPS financial impacts on the very large group for PY2019.
Discussion
MIPS incentivizes performance proportionally as shown in the case studies, and as a result, the scale of operations may be critical to the financial viability of compliance for organizations heavily dependent on Medicare Part B revenue. Organization size and existing MIPS performance may be critical factors to consider in resource allocation processes. Results are summarized in Table 2 and the implications discussed here should be taken in the context of an organization’s overall revenue stream and source in addition to the total estimated Medicare Part B revenue.
Financial Incentives by Group Size and Percentile Performance.
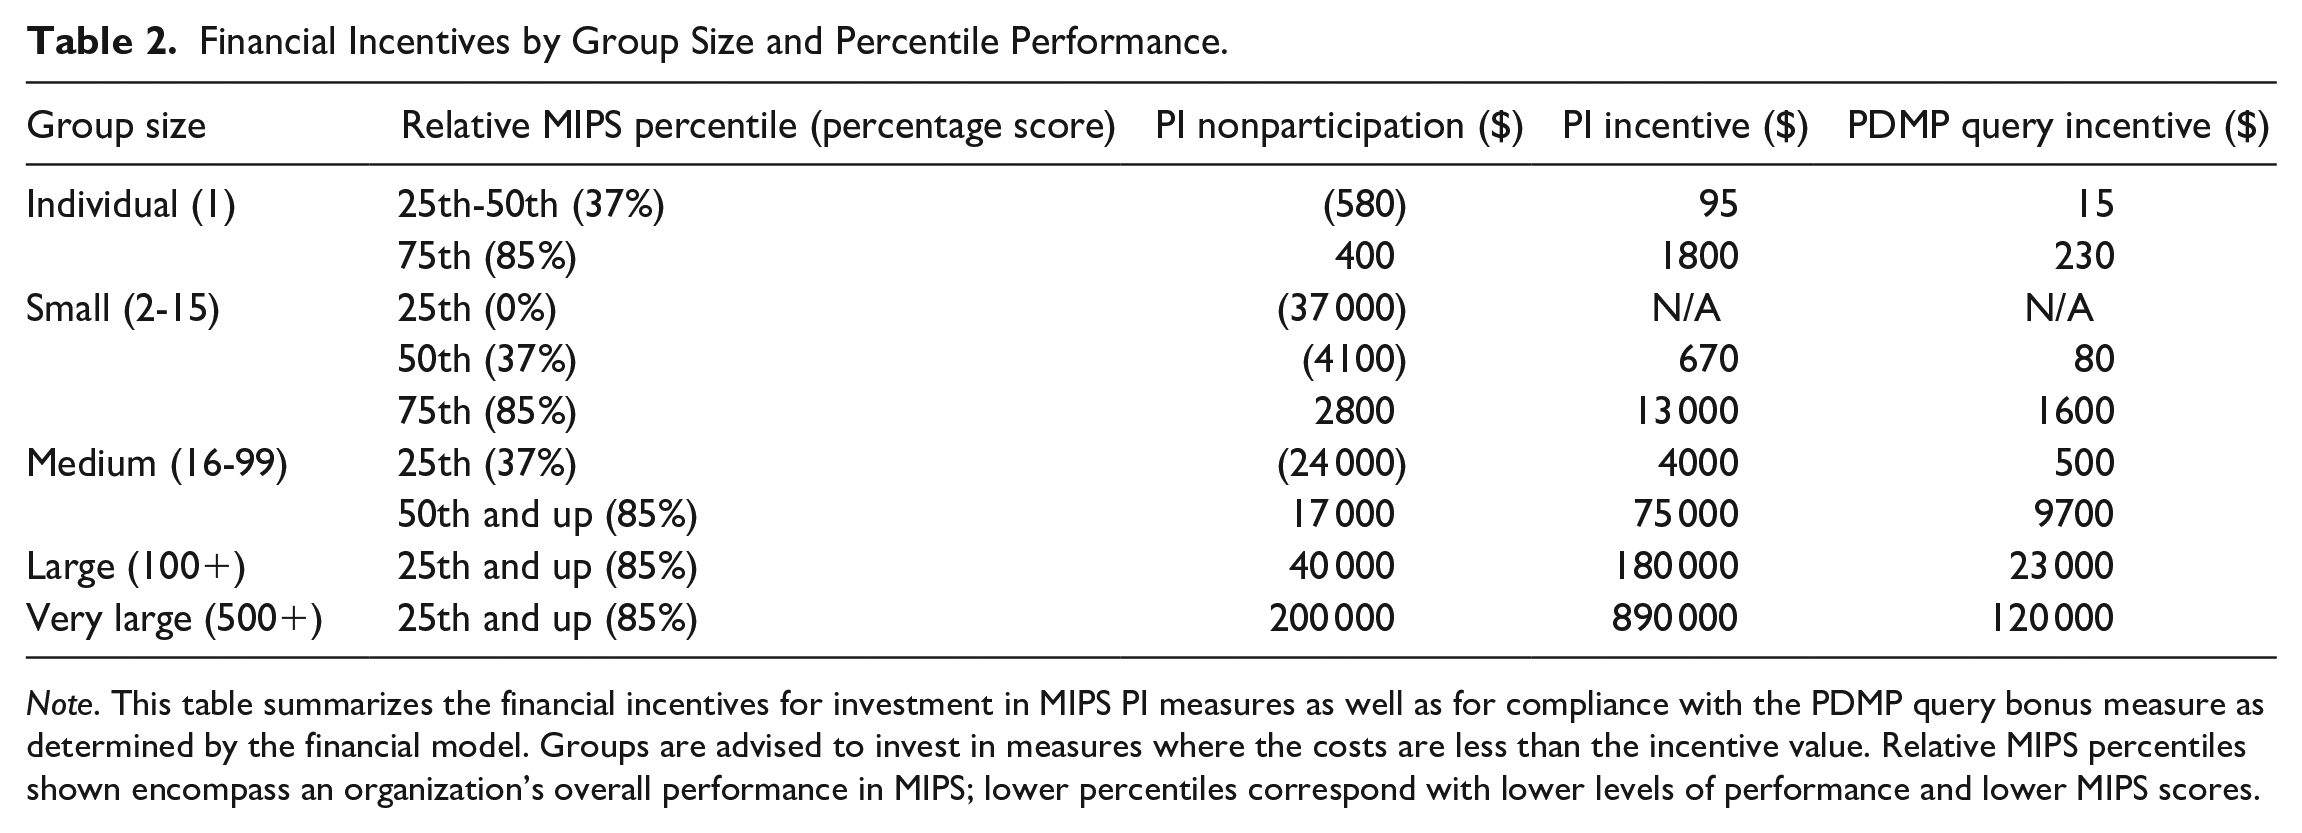
Note. This table summarizes the financial incentives for investment in MIPS PI measures as well as for compliance with the PDMP query bonus measure as determined by the financial model. Groups are advised to invest in measures where the costs are less than the incentive value. Relative MIPS percentiles shown encompass an organization’s overall performance in MIPS; lower percentiles correspond with lower levels of performance and lower MIPS scores.
Larger groups may have a greater capacity to implement operational changes and make capital investments due to their financial leverage and advanced organizational structure. Large groups also likely have dedicated clinical leaders, more sophisticated electronic health record support, and contracts with experienced consultants to ensure maximal compliance with MIPS objectives. Small groups may not have the capital nor dedicated administrators to comply fully with MIPS objectives, placing them at a disadvantage for earning a positive payment adjustment.
To illustrate this further, the model projects that a small practice performing at the median in MIPS among peers is incentivized by about $4800 to adopt PI objectives. A very large group performing at the median in MIPS among peers is incentivized by about $700 000 to implement PI measures. The large practice has a much greater incentive to comply when faced with capital decisions, especially since the IT implementation costs to meet PI measures are unlikely to scale in a similar manner. As the case studies illustrated, as a group increases its revenue, compliance with MIPS becomes more valuable and economically justifiable. Furthermore, only for the largest groups would the PDMP query bonus measure be logical to pursue.
Notably, the MIPS program seems to incentivize action for an organization outside of the performance range, specifically groups scoring below 30 MIPS points and above 75 MIPS points, as these ranges have the largest change in payment adjustment as seen in Figure 2. An organization in the performance range may only see incremental changes to their Medicare revenue stream unless they choose to invest in measures that elevate them to the exceptional performance range. However, organizations that find themselves in the negative adjustment range or the exceptional performance range may see larger returns in MIPS performance for their marginal investment. It follows that organizations performing at the top and bottom of the distribution would be the most likely to have incentive to improve their performance; however, whether it would be financially viable to do so is an organization-specific calculation. It is possible that smaller organizations or organizations less dependent on Medicare revenue may choose to be noncompliant with MIPS.
We acknowledge that our financial modeling is grounded in a number of assumptions that may simplify the conclusions presented. We draw the reader’s attention to the lack of publicly available in-depth performance data from CMS and the relative infancy of the MIPS program as contributing factors to the inability to derive a more sophisticated analysis of MIPS at present. Nevertheless, these findings raise concerns for the future health of MIPS and similar QPP programs whose goals are to incentivize organizations to make investments in areas that improve quality and interoperability, particularly if opt-out exceptions are allowed for low-performing organizations, thereby limiting the disincentive for poor performance and minimizing the potential bonus payment for exceptional performance.
A Look to the Future
In order to ease provider organizations into MIPS, MACRA provided CMS the authority to set early performance thresholds low. For example, the performance threshold for 2019 is 30 points, despite the fact that the national mean MIPS score was 74 for PY 2017.5,6 Beginning in 2022, however, CMS is required to raise the performance threshold to match the national average MIPS score from the previous reporting period. 3 As a result, larger organizations that expended capital resources to succeed under MIPS in the early years may be able to further capitalize on their gains while smaller organizations that are unable to make continuous capital expenditures may be forced to contend with dwindling Medicare revenues in the form of negative payment adjustments.
Under this assumption, every year, larger organizations may position themselves to earn the best possible MIPS score and earn positive payment adjustments. Smaller organizations may be be unable to meet this standard and, due to budget neutrality, they could be forced to accept negative payment adjustments that ultimately would be paid directly to larger organizations that have the necessary scale to succeed with these measures. Smaller practices heavily dependent on Medicare revenue may theoretically decide to join a larger organization for whom MIPS incentivizes continued growth.
As a result, larger groups may be incentivized to maximize scale as quickly as possible by purchasing smaller groups or merging with peer large organizations while smaller groups may be incentivized to sell to larger groups to stop losing money. The healthcare executive of a large provider group may desire to purchase smaller groups or merge with peer large groups as quickly as possible and before competitors are able in order to expand their economy of scale. Leaders of small provider groups may desire to sell as quickly as possible since they may continue to lose money if they remain independent and they may stand to gain from the economy of scale afforded through a larger organization in both overall cost reduction and compliance with MIPS objectives. Theoretically, with each iteration, larger groups would be able to perform even better given their increased scale while smaller organizations that were absorbed into larger groups would be able to share in their success. While we anticipate high transitional costs for group acquisitions that may exceed initial Medicare incentives, it is conceivable to expect a return on investment over many years into the future due to the ability to capitalize on enhanced payment for all Medicare reimbursement, the capacity to negotiate favorable terms with private payers because of the quality signal from strong QPP performance, and improvement in referral patterns that may result from consequent quality halo effects.
It is important to note that this overall scenario may not play out to the extent described at the present time due to the relatively modest overall costs of compliance in the scope of overall revenue. Additionally, mergers bring about a unique set of challenges and limitations depending on the practice style and geographic location, limiting their feasibility in some cases. Nevertheless, this overall scenario remains an important consideration for the future due to the zero-sum design of the MIPS program and as the program penalties become larger over time. It also remains possible that groups may become more dependent on Medicare revenue compared to the past as we see rising numbers of Medicare beneficiaries as the population ages. In such a situation, it is also possible that future costs may rise to a point that necessitates restructuring or closure of physician groups.
In future iterations of MIPS, CMS has signaled intent to shift away from individual performance measures in PY 2021 with the implementation of MIPS Value Pathways (MVPs). 7 Preliminary CMS publications suggest MVPs will build a foundation of PI measures while providing an avenue for clinicians to combine quality, improvement activities, and cost measures relevant to a specific clinician’s practice. 7 Despite little information published thus far, it is not unreasonable to suggest that organization-specific calculus in deploying PI and health IT resources will not change significantly with this new proposal.
Limitations of Model
Due to the novelty of the QPP program, PY 2017 MIPS data were used to approximate PY 2019 MIPS performance. The model likely underestimated PY 2019 MIPS performance due to reports of improved PY 2018 performance over PY 2017, suggesting that PY 2019 performance will likely be improved relative to PY 2017. 8 Based on recent historical trends, it is also likely that CMS payment adjustment guidance for PY 2019 is an overestimate and that actual PY 2019 positive adjustments will be smaller. To account for error in CMS projections of positive payment incentive magnitude, a sensitivity analysis can use the most recent error of 66% for PY 2018 (projected 5%, actual 1.68%) 1 to reasonably estimate that the true positive payment adjustment may be reduced up to 66% given past CMS projection error. Despite the potential for error, the directionality of the case studies does not change. Smaller groups ultimately are still less likely to achieve success relative to their highly-scaled, larger group counterparts. The largest groups capable of maximal compliance with MIPS will receive the highest available payment incentives while the smaller groups in which MIPS incentivizes non-compliance may be subject to a penalty. As a result, the model represents a reasonable estimate of payment adjustments under MIPS.
The model focuses on the PI objectives while leaving constant the other 3 MIPS domains—quality, cost, and improving activities. The scope was focused on PI objectives due to concerns of additional simplifying assumptions that may diminish the value of such an analysis due to the lack of publicly available MIPS performance data.
The incentives discussed here only reflect those of the Medicare program and do not include state Medicaid nor commercial payer incentives. To the degree that state Medicaid and commercial payers reward similar objectives now or in the future, provider groups may earn additional benefits not stated here. Under PY 2019 rules, Medicare Advantage organization payments made to non-contracted providers are subject to MIPS payment adjustments. 2 As an organization’s MIPS score may be used to adjust payments made by entities other than CMS, these effects would be further amplified as more revenue is subject to MIPS performance.
Investments in health IT resources are often amortized over their useful-life in the case of fixed-cost expenses. This model assumes all costs are fully realized in the year of purchase; this assumption is valid for subscription-based purchases which have a known or projected annual cost. The financial implication may be altered for fixed capital costs distributed proportionally over their useful-life span to more accurately reflect the organization’s financial position and decision-making process.
Finally, it is also important to consider that some expenses will scale with the size of the organization and that a fixed-cost expense model may not accurately portray the true costs of compliance. For example, under a scaled cost model, larger organizations likely bear a higher absolute cost relative to smaller groups for services like information technology support. In such a situation it is reasonable to include these organization-specific scalable costs—if known or reasonably approximated—in an overall cost analysis when making a decision on participation in MIPS program objectives.
Conclusion
These case studies can be used as a tool for healthcare provider groups to determine the best course of action to maximize their financial position and achieve success in the latest generation of value-based payment programs in the United States. Under MIPS, healthcare administrators may be advised to scale quickly depending on their overall circumstances and market position; otherwise, competitors may do so and an organization may lose the ability to compete in the future. Smaller groups lacking resources to invest in capital-intensive PI requirements may achieve the greatest success by merging with a larger group while larger groups may further succeed through the absorption of smaller groups or merging with peer large organizations. While the costs of mergers may not yield an immediate return on investment, we expect the return to be realized over many years as the MIPS program and other value-based quality payment programs continue to evolve. While this analysis focused on PI, future analyses of MIPS incentives may consider a cost-benefit discussion centering on the other domains of MIPS in the presence of additional performance data from CMS. While the QPP value-based payment system is still in its infancy in the United States, the fundamental decision facing managers remains a fairly simple one: obtaining organizational scale may be critical for long-term financial viability.
Footnotes
Acknowledgements
We thank Anna Abel for her support in building the model and providing institutional data. We also thank Robert Shesser, MD, MPH as co-director of the George Washington University School of Medicine Clinical Practice Innovation & Entrepreneurship scholarly track for his support of our work.
Author Contributions
Conception and design: DMK, BGC. Data analysis and interpretation: DMK, WBB, BGC. Manuscript drafting or revising: DMK, WBB, BGC. Final manuscript approval: DMK, WBB, BGC.
Declaration of Conflicting Interests
The author(s) declared no potential conflicts of interest with respect to the research, authorship, and/or publication of this article.
Funding
The author(s) disclosed receipt of the following financial support for the research, authorship, and/or publication of this article: This work was supported by the George Washington University School of Medicine and Health Sciences through the W.T. Gill Fellowship for medical students.
Ethical Approval/Patient Consent
This research did not require IRB approval at our institution as there were no study subjects, and all data came from publicly available sources.