
Abstract
Health insurance plans with high deductibles increase exposure to health care costs, raising concerns about how the growth in these plans may be impacting both the financial burden of health care expenditures on families and their access to health care. We find that foregoing medical care is common among low-income, privately insured families, occurring at a greater rate than those with higher incomes or Medicare coverage. To better understand the relationship between out-of-pocket (OOP) spending and access, we used the 2011-2014 Medical Expenditure Panel Survey (MEPS) data and a logistic model to analyze the likelihood of avoiding or delaying needed medical care based on health insurance design and other individual and family characteristics. We find that avoiding or delaying medical care is strongly correlated with coverage under a high-deductible health plan, and with depression, poor perceived health, or poverty. However, it is relatively independent of the percent of income spent on OOP costs, making the percent of income spent on OOP costs by itself a poor measure of health care unaffordability. Individuals who spend a small percentage of their income on health care costs may still be extremely burdened by their health plan when financial concerns prevent access to health care. This work emphasizes the importance of insurance design as a predictor of access and the need to expand the definition of financial barriers to care beyond expenditures, particularly for the low-income, privately insured population.
Keywords
Introduction
The Affordable Care Act (ACA) instituted a wide array of changes to the health insurance marketplace resulting in increased access for many previously uninsured individuals and increased standards for those with private employer or marketplace, nongroup coverage. While most notable for the resulting drop in uninsured rates across the country, primarily driven by the state Medicaid expansions and employer and individual mandates, the law also established regulations requiring stricter standards for a minimum acceptable level of coverage.1,2 These standards include guaranteed issue (preventing insurers from excluding those with preexisting conditions), the elimination of lifetime spending caps, limits on annual deductibles, limits on annual out-of-pocket (OOP) spending, and requirements that plans cover services considered essential to an individual’s health. These standards are aimed at reducing underinsurance, a situation where an individual’s coverage either leaves them liable for an unsustainable amount of medical OOP expenses or results in the inability to receive necessary care. 3
Despite the ACA regulations and guaranteed level of coverage, for many low-income individuals in the nongroup, individual market and employees covered with employer-sponsored insurance, their plan leaves them underinsured. This is especially true for those offered high-deductible health plans (HDHPs), which under the law in 2015 were allowed to have deductibles up to $6600 for an individual and $13 200 for a family. While often paired with health savings accounts (HSAs), a high-deductible plan for a low-income individual places a potentially significant burden for medical expenses before the deductible is reached as many of these individuals are unable to fund their HSA. 4 Furthermore, while these plans are subject to the OOP maximums established by the law, services not classified as essential health benefits and services provided out-of-network may not count toward the annual cap, further exposing an individual to higher expenses.
The use of HDHPs has increased substantially over the past 10 years, carrying with it several major concerns for low-income enrollees. 5 First, that these individuals will be forced to spend a large percentage of their income on health care expenses. Thresholds of 10% or 20% of total income have been identified as levels of concern for combined spending on premiums and OOP medical expenses. Previous work has shown that families making less than 200% of the Federal Poverty Level (FPL) are far more likely to have a health care financial burden—the percent of income spent on premiums and OOP costs—above these thresholds.6,7,8,9 In addition, it has been shown that these risks are even more pronounced in the pool of low-income individuals with HDHPs, who have almost twice the risk of health care expenditures exceeding 20% of income than those with a plan without such high deductibles.10,11 Furthermore, recent research has analyzed the impact of HDHPs on medical expenditures. HDHPs appear to cause reduced spending on outpatient care and pharmaceuticals, though no judgment has been yet been made on how such plan changes impact low-wage, privately insured persons.12,13,14
A potential complementary concern for the underinsured is that they avoid receiving necessary medical care altogether, such as dental care, filling prescriptions, or critical medical procedures. 15 Previous work that has looked solely at health care financial burden as a percent of income effectively censors those with the inability to spend on health care, and thus does not capture this concern. A low-income individual who spends 0% of their income on health care may nevertheless be extremely burdened by their underinsurance if they completely avoided care due to the potential OOP costs. Moreover, financial burden as a measure of underinsurance is problematic because the OOP caps under ACA make it mathematically impossible for some middle-income families to reach the 10% or 20% of income threshold, despite the possibility they may be significantly impacted by their medical expenses. 16 Previous work modeling avoided or delayed care only in families with children demonstrated that in such families, a measure of these concerns is a better predictor of unmet needs than raw OOP costs. 17
It is important to note that the concept of underinsurance includes components beyond the economic concerns of avoiding care due to cost and percentage of income spent on health care expenses mentioned above. Previous work has also identified underinsurance can occur as a result of plans not covering particular services or providers (structural underinsurance) or from an individual’s perception of the quality of a health plan and its coverage (attitudinal underinsurance). 18 Qualitative underinsurance measures to assess these concerns using access to care questions have been previously demonstrated in an analysis of the impacts of the ACA on people’s access to health care. 19 Furthermore, using the 2007 Health Tracking Household Survey, it was demonstrated that almost 20 percent of US adults faced some manner of unaffordability barrier to medical care. 20 It has also been found that lower income persons are more likely to experience nonfinancial barriers and less likely to use health care than their higher income counterparts. 21
In this article, we focus primarily on economic and attitudinal factors of underinsurance. To measure the attitudinal factor of underinsurance, we defined an unaffordability metric to identify individuals who avoid or delay medical care as a result of cost. We then compare this metric with a health care financial burden indicator—percent of family income spent on health care—measuring economic factors of underinsurance. Finally, focusing on the privately insured population, we develop a logistic model to predict the impact of financial barriers, plan type, and health characteristics on unaffordability concerns for this population.
Study Data and Methods
We analyzed the Medical Expenditure Panel Survey (MEPS) using SAS version 9.4. The MEPS population is a subset of the National Health Interview Survey (NHIS) respondents and is designed to provide nationally representative spending estimates of per-capita medical procedures. The most recent available data is from 2014. It was collected from March to May 2015 and includes responses from 34,875 individuals. Each individual is reported as part of a larger family with a corresponding characteristic weight determined by demographic and financial factors, thus allowing us to collapse the data to the household level. We used the Current Population Survey (CPS) family weights; the differences with MEPS-defined weights are small, but the CPS definition is broader. 22 For example, using the CPS definition, college students away from home count as members of their family’s household.
Outcome Variables
Our central data definition concerns unaffordability. We defined it as a dichotomous variable on a household level using a series of access to care questions. A family is defined as having an unaffordability concern if any member of that family reported either delay or loss of medical care, prescription medication, or dental care for financial reasons. We assume that family members typically pool resources used for medical care and that therefore unaffordability concern for any member of the family extends to others within that family. This accords with recent publications using unaffordability as a measure of financial barriers.16,17,18 Exact MEPS questions used to compute the unaffordability metric are found in Online Appendix A.
A second key variable is health care financial burden, which estimates financial barriers facing families. We defined health care financial burden as the proportion of total OOP medical expenditures divided by total income for each family. Previous work that quantifies health care financial burden using MEPS data sometimes includes individual contributions to premiums in addition to OOP expenditures for the privately insured population. 7 Our measure of health care financial burden in this article only includes OOP expenditures for 2 reasons. First, because we model unaffordability, which focuses on care decisions made at the margin, OOP expenditures may best represent the spending that is made for a marginal unit of medical care. Second, the MEPS data contain premium expenditures only for the privately insured population; therefore, only including OOP health care financial burden best allows for comparison across insurance types.
A final important outcome variable is the presence of an HDHP. MEPS separates out insurance plans according to their deductible within the privately insured population, allowing us to define a dichotomous variable as 1 for persons with a plan that has a deductible of at least $1300/$2600 for a single/family plan, respectively, and 0 otherwise. This distinction has been used in recent literature indicating a link between HDHPs and high health care financial burden. 10
Analytical Methods
Our first aim was to characterize unaffordability concerns across the US population. To accomplish this, we broke down the US population into subgroups differentiated by insurance type and income bracket. We then analyzed the relationship between unaffordability concerns and high health care financial burden within each group, to determine the overlap between the two.
Using these subgroups, we calculated a range of summary statistics, including using MEPS family weights to calculate the number of families within that group across the US population, unaffordability concerns, and health care financial burden. Next, we calculated how unaffordability problems within these subgroups have varied over time.
Finally, we set out to determine factors that had an impact on unaffordability among the privately insured, and included them into a model of families who would be most likely to have financial concerns regarding OOP medical expenditures. We thus developed a series of predictive logistic models of unaffordability on a household level to achieve this goal. A logistic model measures the percentage change in the odds of a dependent variable based on a 1-unit increase from a given baseline in each individual independent variable. We categorized indicator variables into 4 groups: income indicators, demographic indicators, psychological and health indicators, and insurance plan indicators. We then modeled unaffordability using income and each other indicator category, with one overall model including all significant indicators from our first three. The rationale behind the chosen indicators within each group was based on the authors’ intuition, MEPS data availability, and ensuring that the chosen indicators provided a comprehensive basis for each group. We used P values of .05, .01, and .001 for determining levels of statistical significance of the relationship between independent indicators and unaffordability in each model, using .01 as a cutoff for indicator inclusion in our overall model.
Results and Analysis
Our first aim was to compare unaffordability with health care financial burden as a measure of financial barriers for the US population. Figure 1 shows that not only are financial concerns relatively nonoverlapping with high health care financial burden but also that reliance on health care financial burden misses a large portion of the population that is foregoing care and therefore potentially not spending much money on health care. The correlation coefficient r is −0.06753 between high health care financial burden and unaffordability and is not statistically significantly different from 0 (indicating independence).

Relationship between affordability and high OOP financial burden by insurance type and income level, 2014.
Summary statistics of unaffordability across all insurance types and income groups are shown in Table 1.
Unaffordability and health care financial burden by insurance type and income level, 2014.

Note. For a full definition of the questions governing this definition of unaffordability, see Online Appendix A. Health care financial burden incorporating premium costs is included in parentheses. The equations governing the difference between this health care financial burden definition and a mean of the ratios can be found in Online Appendix B. FPL = Federal Poverty Level.
Table 1 demonstrates that low-wage (income <200% of the FPL), privately insured families, a group that encompasses more than 14 million households, face high unaffordability barriers to receiving medical care, with between 14% and 16% of such families reporting foregoing medical care as a result of cost. This stands in stark contrast to higher wage, privately insured families, which tend to face among the lowest unaffordability barriers to receiving care of any group. The low-wage, privately insured groups also have very high levels of average financial burden, even sometimes exceeding annual income, particularly when premium costs are included. In the low-wage, privately insured population, financial burdens above 100% of annual income are most likely a result of families relying on savings to pay for their premiums and OOP expenses.
Trends of financial barriers over the past 4 years are shown in Figure 2. Unaffordability barriers facing privately insured families with the lowest incomes (0-100 FPL) reached a 4-year high in 2014, while consistently surpassing Medicare and approaching the concerns reported by public-only insured families. It is noteworthy that both the number of uninsured families as well as the rate at which uninsured families report financial concerns have decreased substantially over the past 4 years.
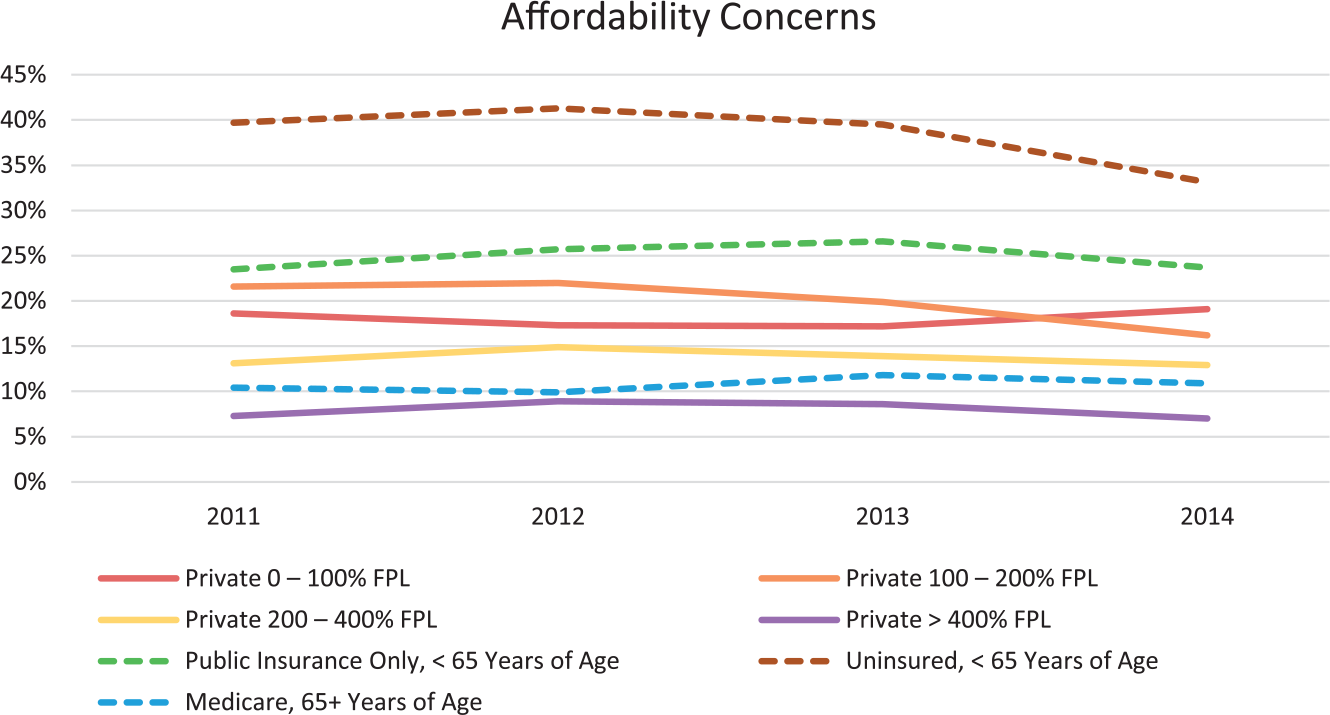
Affordability concerns over time by insurance type and income level, 2011-2014.
To better understand the results shown in Table 1 and Figure 2, we tested a series of models looking for a set of indicators that had statistically significant relationships with unaffordability within the privately insured population (Table 2). Indicator definitions not found in the text can be found in Online Appendix C.
Logistic model of unaffordability indicator strength within the privately insured population, 2014.

Note. Predicted values adjusting for all covariates. For a full accounting of the model, including indicators that are not statistically significant, see Online Appendix D. For technical details, see Online Appendix E. For Charlson comorbidity groups and weightings, see Online Appendix F.
Statistically significant using P = .05. **Statistically significant using P = .01. ***Statistically significant using P = .001.
Table 2 displays the parameters of a series of predictive logistic models. For example, a 1-unit change in family income in our model refers to 10 000 dollars; in our Income + Demographic indicators model, for example, for every additional 10 000 dollars of family income, there is a 6.8% decrease in the odds of that family reporting a financial concern.
Every model indicates that family income is significantly correlated with unaffordability using a P value of .001. In addition, this correlation is relatively stable regardless of which other independent indicators are held constant. This finding is consistent with the hypothesis that low-wage families are more likely to forego medical care due to its cost.
Perceived health has a strong positive correlation with unaffordability—the poorer someone’s perceived health, the more likely they are to report unaffordability concerns. This indicator was significant using a P value of .001.
Depression in a family’s reference person demonstrated a strong correlation with likelihood to report unaffordability concerns. The rate at which increased depression correlated to increased unaffordability concerns was statistically significant using a P value of .001.
HDHPs play a large role in the perceived unaffordability of health care. Our models indicate that families with HDHPs were expected to be at least 49.7% more likely to report unaffordability concerns, even when correcting for family income, perceived health, depression, age, and sex of the reference person. Using HDHPs as an indicator was statistically significant using a P value of .001.
Discussion
By implementing a metric for health care unaffordability, we are able to demonstrate the importance of considering both unaffordability and health care financial burden concerns in at-risk populations. The relative lack of intersection between families with financial concerns and those with high health care financial burden (Figure 1) indicates that these 2 concerns represent distinct and complementary problems of potential underinsurance. The substantial proportion of families that avoid or delay care, despite not reaching a 10% or 20% financial burden threshold, emphasizes the importance of a qualitative unaffordability metric. Avoided or delayed care, which our results show is surprisingly common among low-income and uninsured families, represents a significant public health concern. Delaying and avoiding care likely results in poorer management of chronic health conditions, increases the chance health problems go undiagnosed, and likely increases future health care costs by failing to prevent more severe health conditions. Avoidance of care due to financial concerns is necessary to consider alongside health care expenditures, and with increased patient cost-sharing and the rising prevalence of HDHPs, low-income families are at an even greater risk for both high health care financial burden and unaffordability concerns.
In our model of unaffordability risk, we identify factors that compound to put a privately insured family at risk for avoiding or delaying medical care even beyond income (Table 2). In particular, we find large and significant reported risks of avoiding care when a family is covered under an HDHP, when their reference person has worse perceived health, and when their reference person reports depression. These results both support recent findings that HDHPs result in significant increased financial barriers to obtaining care and invite several possible psychological explanations. 10 The first is that those who are depressed or perceive themselves to be unhealthy are more likely to report negative experiences, such as foregoing medical care due to its cost. 23 The second is that persons who cannot afford medical care become depressed or unhealthy as a result of the financial barriers they are facing. 24 While the latter represents a possible reverse causality wherein unaffordability results in depression, the true directionality is unknown. Previous work into this relationship has demonstrated that depression may directly influence access to care through multiple mechanisms. 25 The percentage of family income spent on OOP expenditures is not predictive of reporting unaffordability concerns, likely due to the independence between unaffordability and health care financial burden.
When using our unaffordability definition to identify individuals who are significantly underinsured, it is important to note the risk of false-positives. Our unaffordability metric is based on qualitative survey responses within the MEPS questionnaire, which is more ambiguous than calculated measures of expenditure burden. We can observe this possible false identification of at-risk families by looking at the results in the >400% FPL privately insured population. While we typically would not define these families as financially at risk, our unaffordability metric shows a larger-than-expected percentage who report avoiding or delaying medical care due to cost. This may be a result of those who, even at high income levels, are particularly price sensitive. 26 It could also be a result of those who have a distaste of high medical costs or by the politicization of recent health care debates.
Our multiyear analyses indicate a slight downward trend in unaffordability concerns in some of the most at-risk groups, including both the privately insured population between 100% and 200% of FPL and the uninsured population from 2011 to 2014 (Figure 2); both trends could be a result of Medicaid expansion under the ACA. 27 We find that the low-wage, privately insured population remains more vulnerable to reporting foregoing medical care due to financial barriers than the Medicare population and is almost as vulnerable as the Medicaid population. These results add an important rationale to refocus research and policy on this group.
Conclusion
Low-wage, privately insured individuals present a unique research and policy opportunity for improving medical care accessibility and unaffordability in the United States. To examine financial barriers within this population, we applied a measure of unaffordability and demonstrated its distinct and complementary relationship with the established health care financial burden measure of barriers to accessing care. From our unaffordability measure, we created a model of barriers facing the privately insured population. This model pointed to both vulnerability of low-wage populations to unaffordability concerns and HDHPs having a strong negative impact on families reporting being able to afford medical care. These results highlight the value of increased research on low-wage, privately insured persons, as well as further investigation into the impacts of high-deductible health plans on financial barriers to obtaining medical care.
Footnotes
Declaration of Conflicting Interests
The author(s) declared no potential conflicts of interest with respect to the research, authorship, and/or publication of this article.
Funding
The author(s) disclosed receipt of the following financial support for the research, authorship, and/or publication of this article. This article received internal funding from the Altarum Institute.
Supplementary Material
Supplementary material is available online.
References
Supplementary Material
Please find the following supplemental material available below.
For Open Access articles published under a Creative Commons License, all supplemental material carries the same license as the article it is associated with.
For non-Open Access articles published, all supplemental material carries a non-exclusive license, and permission requests for re-use of supplemental material or any part of supplemental material shall be sent directly to the copyright owner as specified in the copyright notice associated with the article.