
Abstract
The Families First Coronavirus Response Act (FFCRA) enacted in March 2020 prohibited states from redetermining Medicaid eligibility until March 31st, 2023. However, there has been little direct evidence on how the FFCRA affected coverage continuity, health care access and utilization among Medicaid beneficiaries. In this cross-sectional study, we employ data from the 2015 to 2022 National Health Interview Survey and a difference-in-differences design to study the FFCRA effects by comparing changes in outcomes between Medicaid and privately insured individuals over time. The sample is limited to non-elderly adults aged 19 to 64 years with income below 300% of the federal poverty level. We find that Medicaid beneficiaries experienced a decline in coverage interruptions in 2021 and 2022 relative to privately insured individuals. Additionally, Medicaid beneficiaries had improved access in 2021, with less reporting of unaffordable healthcare needs and delayed medical care due to cost. There were no discernable effects on hospitalizations, ED visits, and doctor/health professional visits. The continuous Medicaid coverage provision under the FFCRA was associated with enhanced coverage stability and improved access to care for Medicaid beneficiaries. Findings highlight potential benefits from new policy initiatives to improve Medicaid coverage continuity.
Keywords
Medicaid beneficiaries have historically experienced more coverage interruptions and access barriers compared to those with private insurance, leading to higher administrative costs and worse health outcomes.
This study investigates a timely and important policy issue regarding how the Families First Coronavirus Response Act (FFCRA), which required states to offer continuous Medicaid coverage to Medicaid beneficiaries, impacted insurance continuity and health services outcome for Medicaid beneficiaries.
The continuous Medicaid coverage provision under the FFCRA was associated with enhanced coverage stability and improved access to care for Medicaid beneficiaries, underscoring the potential benefits of new state initiatives aimed at improving Medicaid coverage continuity.
Introduction
The COVID-19 pandemic brought significant disruptions to labor markets and loss of employer-sponsored health insurance coverage to millions in the United States.1,2 Beginning in March 2020, the federal government required states to offer continuous Medicaid coverage to Medicaid beneficiaries under the Families First Coronavirus Response Act (FFCRA). This policy prohibited states from redetermining Medicaid eligibility until March 31st, 2023, effectively offering continuous Medicaid coverage to enrolled beneficiaries, in exchange for additional federal funding. With this requirement, those enrolled in Medicaid at any time when this policy was enacted would have been continuously covered in Medicaid until March 31st, 2023, regardless of changes in their income or categorical eligibility.
Before the FFCRA, federal law required states to review eligibility of Medicaid enrollees only once every 12 months.3,4 However, state Medicaid agencies retained the authority to disenroll individuals from coverage if they received information from enrollees or periodic data checks indicating ineligibility for Medicaid. 4 In 2019, over half of the states implemented periodic checks at least once per annual renewal period, with some states conducting quarterly or more frequent eligibility checks before the next annual renewal.4,5 Such renewal or redetermination processes could have led to disenrollment within short periods from initial enrollment.6,7 This churning in Medicaid coverage could have worsened access to care ultimately leading to delayed services, higher use of emergency department (ED), and more hospitalizations.8 -10 In addition, Medicaid churning could increase administrative costs for Medicaid agencies and create extra burden for providers and Medicaid managed care organizations.3,7
Before the FFCRA, states focused on children when extending enrollment before redetermining eligibility. Twenty-four states had provided children in Medicaid of any age with a 12-month continuous coverage. 5 Previous studies suggest that low-income children living in those states were more likely to have Medicaid coverage and less likely to experience insurance gaps; they also had better access to care than children in other states without continuous coverage.9,11 Such provisions were not common for adult Medicaid beneficiaries before the FFCRA; to our knowledge, only New York and Montana had implemented a 12-month continuous enrollment period for adults through Medicaid waivers. 5 Therefore, the FFCRA likely had an important effect on coverage continuity and access to care for adult Medicaid beneficiaries. However, empirical evidence on such effects remains sparse. We aim to add to this empirical evidence in this study.
Following the start of the COVID-19 pandemic, nearly 50 million individuals are thought to have experienced disruptions in work hours, job stability, and income by May 2020. 12 Employment disruptions led to a rise in Medicaid enrollment by nearly 5 million individuals from March to September 2020. 13 However, the economy and labor markets began recovering quickly in late 2020 and through 2022. 14 Without the FFCRA, many Medicaid beneficiaries who regained employment and income would have become ineligible before or by their next enrollment renewal date. Examining how the FFCRA impacted coverage continuity and healthcare access for adult Medicaid beneficiaries is important not only to evaluate this specific policy but also the potential value of future policies aimed at reducing Medicaid churning and coverage continuity. As of April 2023, 4 states had received waivers to provide 12-month continuous coverage to their Medicaid adult beneficiaries. 15 Understanding the FFCRA effects will shed light on the potential future effects of such policies.
In this study, we study a timely and important policy issue regarding how the FFCRA continuous Medicaid coverage provision affected Medicaid beneficiaries’ health services outcomes. Medicaid beneficiaries have historically experienced more coverage interruptions and access barriers compared to privately insured individuals.16,17 Whether the FCCRA reduced these gaps between Medicaid and privately insured individuals is not known. To date, there has been little direct evidence on how the FFCRA affected coverage continuity and health care access and utilization among Medicaid beneficiaries. In this study, we examine how the FFCRA affected coverage continuity, access to care, and health services utilization of Medicaid beneficiaries compared to privately insured individuals through 2022, more than 2 years after enactment.
Methods
Data and Sample
We use data from the National Health Interview Survey (NHIS) from 2015 through 2022. The NHIS includes a nationally representative cross-sectional sample of the civilian noninstitutionalized population residing in the 50 states and District of Columbia. The NHIS includes individual-level information on sociodemographic variables, health insurance coverage, health care access and utilization, and health indicators. In 2019, the NHIS changed its survey design and questionnaires (details in Supplemental Appendix A), making the data before 2019 not directly comparable to that from 2019 or later years. Therefore, we analyze the 2 periods of 2015 to 2018 and 2019 to 2022 separately as detailed below.
We restrict the main sample to adults aged 19 to 64 years with past year income below 300% FPL to allow for income fluctuations for Medicaid beneficiaries exceeding eligibility levels during the FFCRA effective period. Individuals with higher income are less likely to have been income eligible for Medicaid anytime within the past year or 2 (see Supplemental Appendix B for details). Nonetheless, as a sensitivity check, we select alternate samples of individuals below 400% FPL and those with high school or less education irrespective of income. We further limit the sample to individuals who reported only a single source of insurance coverage from either Medicaid or private coverage. Individuals with health insurance from other sources or with both private and Medicaid coverage are excluded from the analytical sample (about 10% of the total sample). Descriptive statistics of the analytical sample are in Supplemental Appendix Tables 1 and 2.
Outcomes
We evaluate 2 health insurance continuity outcomes. The first measure is a binary indicator for whether the individual was without coverage anytime over the past 12 months. The second outcome is the number of months without health coverage during the past 12 months. We include 2 measures/groups for this second outcome: 1 measure/group includes everyone with 0 gap months assigned for those with 12-month coverage (ie, no coverage interruptions); another measure/group only includes those who reported some coverage interruption (ie, at least 1 month gap) and excludes individuals with no coverage interruptions. We also include the following 4 binary indicators of health care access over the past 12 months: (1) any delayed medical care due to cost; (2) needed but could not afford medical care; (3) needed but could not afford mental health care; and (4) needed but could not afford medications. Finally, we evaluate the following health services utilization measures in the past 12 months: (1) any doctor/health professional visits; (2) any ED visits; and (3) any hospital stays.
Research Design and Statistical Analysis
In this cross-sectional study, we employ a difference-in-differences design that compares outcome changes before (2019) and after (2020-2022) the FFCRA enactment between individuals covered by Medicaid (treatment group) and those privately insured (control group) at the survey time. We include privately insured individuals as the control group to account for contemporaneous events (for example, disruptions to healthcare access and delivery due to the pandemic) that possible influenced the study outcomes similarly between the 2 groups. Moreover, this control group allows us to directly examine how the FFCRA influenced the gaps in coverage continuity, access, and services utilization between Medicaid and privately covered individuals. Since the FFCRA Medicaid continuity provision is not expected to have direct effects on privately insured individuals, they provide a plausible control group in this difference-in-differences design.
To understand the FFCRA effects over time, we first estimate an event-study difference-in-differences model with year-by-year changes in outcomes from 2020 to 2022 versus 2019 (reference year). Because individuals were only partially treated in 2020 (the FFCRA enacted in March 2020) and outcomes are measured over a 12-month look-back window, we expect smaller FFCRA effects in 2020 than 2021 and 2022. Moreover, due to the pandemic, the NHIS collected data using telephone instead of in-person interviews in 2020 and had a lower response rate; there was also a concern about greater non-response with lower socioeconomic status. 18 The event-study design avoids conflating any potential differential non-response bias between the treatment and control groups in 2020 with subsequent years. However, to maximize power if effects were similar across years, we also estimate a classical difference-in-differences model combining post-FFCRA years, first 2020 to 2022, then 2021 and 2022 (excluding 2020) versus 2019. To examine the validity of the difference-in-differences design, we evaluate whether there are differential pre-trends in outcomes in 2015-2018 between Medicaid and privately insured individuals.
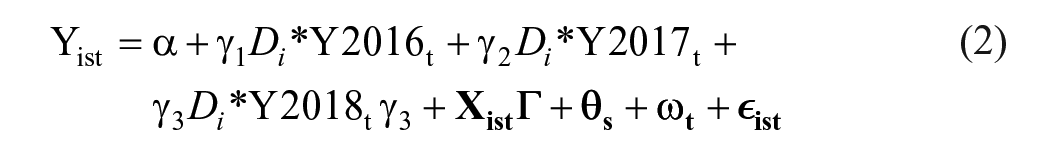
Specifically, we estimate the following model:

where
The model adjusts for conceptually relevant individual characteristics in
In addition to the event study difference-in-differences design we mentioned above, we estimate a classical difference-in-differences model combining post-FFCRA years to maximize power if effects were similar across years. We first estimate this model pooling 2020, 2021, and 2022. However, individuals were only partially treated in 2020 considering since the FFCRA was enacted in March 2020 and outcomes are measured over a 12-month look-back window. Moreover, the NHIS response rate was lower in 2020 NHIS and there was a concern about non-response bias with the switching to telephone instead of in-person interviews and greater non-response with lower socioeconomic status. 18 Therefore, we estimate another classical difference-in-differences model excluding 2020. In another model, we further exclude 2021 to account for potential continuing impacts from COVID-19 pandemic, thus comparing only 2022 to 2019 in that model.
As a check of the validity of the difference-in-differences design, we evaluate whether there are differential pre-trends in outcomes in 2015 to 2018 between Medicaid and privately insured individuals. Since the 2019 NHIS may not be directly comparable to earlier years to examine pre-trends due to the NHIS redesign as noted above, we examine these pre-trends in 2015 through 2018. Specifically, we estimate the following model:
Y2016, Y2017, and Y2018 are binary indicators for years 2016, 2017, and 2018, respectively, with 2015 as the reference year. All other parameters are defined the same as the equation (1). The outcome pre-policy trends between the two groups are captured by
All regressions are estimated with linear least squares and NHIS sampling weights to generate national representative estimates. As a robustness check, we estimate the models accounting for the complex survey design. All analyses are completed using Stata/SE 17.0; the “svy” package is used when accounting for the complex survey design. Estimates are considered statistically significant at P < .05.
Results
Continuity of Insurance Coverage
Among individuals who experienced coverage gaps in 2019, nearly 50% had 3 or fewer months without health insurance, and about 10% had 10 or more months without coverage, with an average of 4.7 months. Supplemental Appendix Figure 1 shows unadjusted trends of insurance continuity indicators for Medicaid and privately insured individuals below 300% FPL, separately for 2015-2018 and 2019 to 2022. The two groups have similar trends in the proportion experiencing insurance gaps in 2015-2018. However, this proportion declines in 2020 to 2022 among Medicaid beneficiaries (especially in 2021) but increases among privately insured individuals in 2020 to 2021 before declining in 2022. The trends for number of months without health insurance are mostly similar (except for an increase in 2022 among Medicaid beneficiaries).
Table 1 Panel A reports the event-study difference-in-differences estimates of the FFCRA effects on coverage continuity for Medicaid beneficiaries relative to privately insured individuals. Medicaid enrollees had a lower likelihood of experiencing an insurance coverage interruption in the past 12 months in 2021 and 2022 than 2019 by 6.1 and 4.7 percentage points, respectively, compared to privately insured individuals. Importantly, the gap in this outcome between the two groups closed in 2021-2022 (Supplemental Appendix Figure 1). There was also a decline in number of months without coverage (when including individuals with 0 months) in 2021 and 2022 by 0.4 and 0.2 months, respectively, versus 2019 among Medicaid beneficiaries compared to privately covered individuals. There was a more pronounced decline in coverage gaps by 1.2 months in 2021 among Medicaid beneficiaries when restricting the sample to individuals who experienced some coverage gaps (ie, excluding those who had 0 coverage gap months). There was however no effect on months without coverage in this subgroup in 2022. There were no effects on coverage interruptions under any outcome measure in 2020, consistent with a partial exposure to the FFCRA. Lastly, estimating the effects over different post-FFCRA years in a classical difference-in-differences model (Table 1 Panel B) shows declines in both any insurance gaps and the number of months without coverage when including 0 coverage gap months with relatively more pronounced effects when excluding 2020. However, when limiting the sample to individuals who experienced some gaps, the decline in months without health insurance was not statistically significant with noticeably larger standard errors due to the small sample size.
Difference-in-Differences (DD) Estimates of the FFCRA Effects on Experiencing Insurance Gaps, 2019 to 2022 NHIS, 19 to 64 Year Old Individuals below 300% of the FPL.
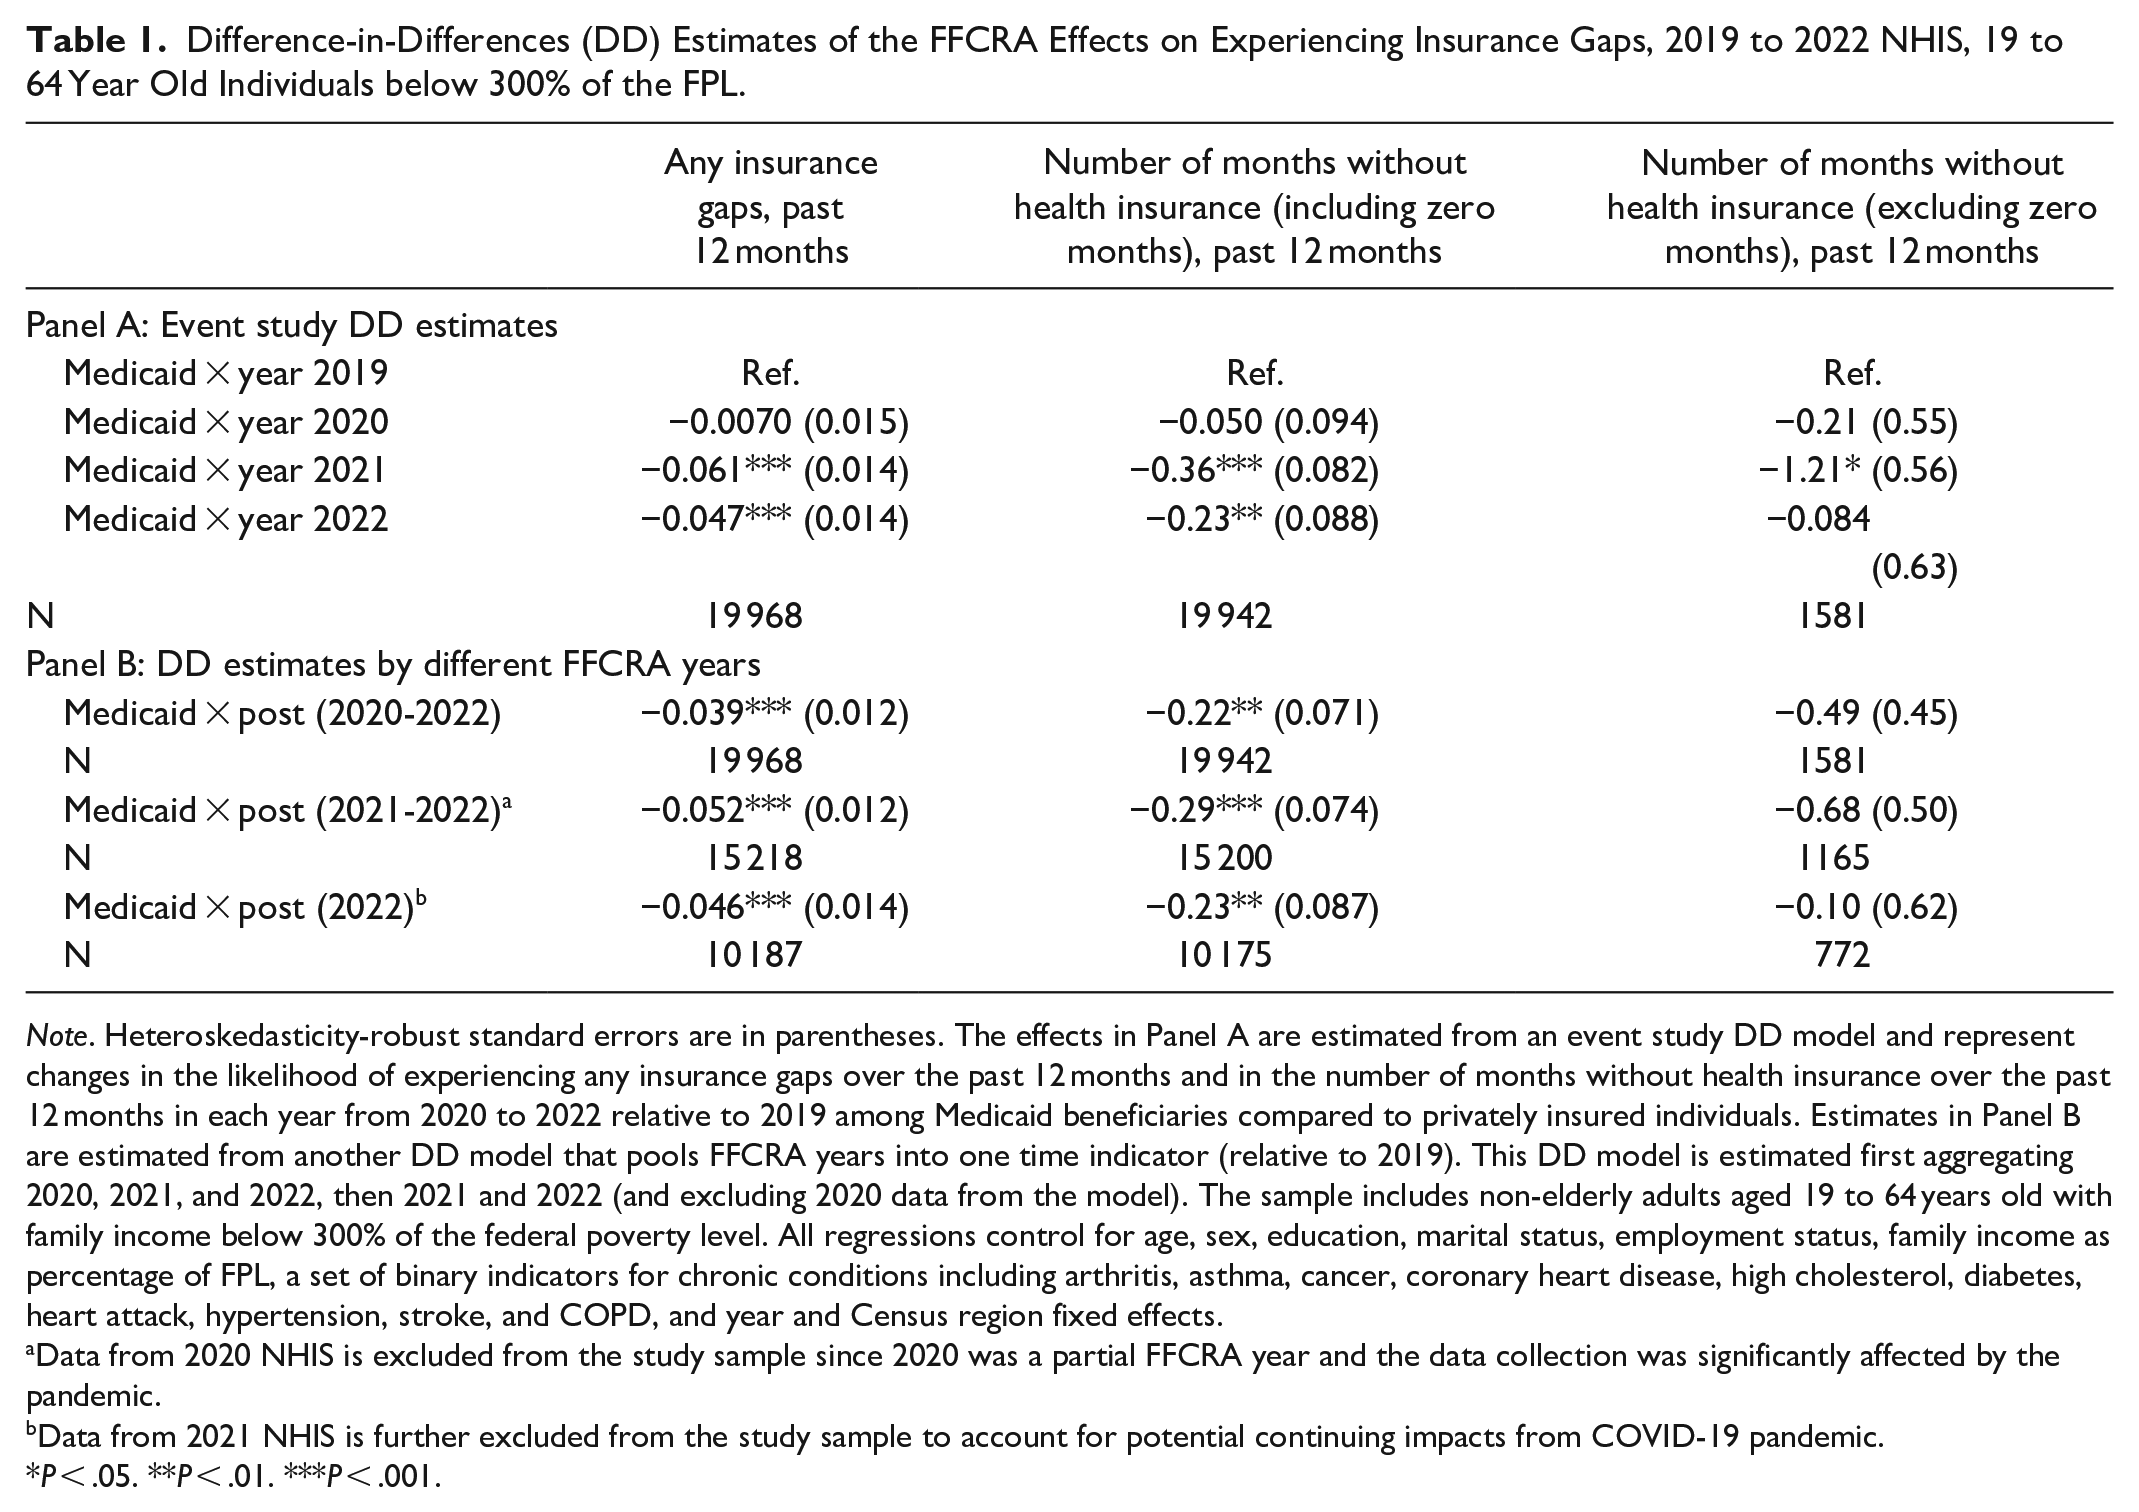
Note. Heteroskedasticity-robust standard errors are in parentheses. The effects in Panel A are estimated from an event study DD model and represent changes in the likelihood of experiencing any insurance gaps over the past 12 months and in the number of months without health insurance over the past 12 months in each year from 2020 to 2022 relative to 2019 among Medicaid beneficiaries compared to privately insured individuals. Estimates in Panel B are estimated from another DD model that pools FFCRA years into one time indicator (relative to 2019). This DD model is estimated first aggregating 2020, 2021, and 2022, then 2021 and 2022 (and excluding 2020 data from the model). The sample includes non-elderly adults aged 19 to 64 years old with family income below 300% of the federal poverty level. All regressions control for age, sex, education, marital status, employment status, family income as percentage of FPL, a set of binary indicators for chronic conditions including arthritis, asthma, cancer, coronary heart disease, high cholesterol, diabetes, heart attack, hypertension, stroke, and COPD, and year and Census region fixed effects.
Data from 2020 NHIS is excluded from the study sample since 2020 was a partial FFCRA year and the data collection was significantly affected by the pandemic.
Data from 2021 NHIS is further excluded from the study sample to account for potential continuing impacts from COVID-19 pandemic.
P < .05. **P < .01. ***P < .001.
The results are similar in the extended event-study difference-in-differences model including demographic/health subgroup by year interactions and when accounting for the complex survey design (Supplemental Appendix Table 3). Results are also similar when including individuals below 400% FPL or those with high school or less education (Supplemental Appendix Table 4) and controlling for mental health status measures (Supplemental Appendix Table 5) Results of the pre-trend analyses are shown in Supplemental Appendix Table 5. There are no pre-trend differences between the two groups that would suggest bias in the FFCRA effect estimates on the two insurance interruption outcomes.
Health Care Access
Supplemental Appendix Figure 2 presents unadjusted trends for health care access. Trends are overall comparable over 2015 to 2018 between Medicaid and privately covered individuals, except for a slight increase in reporting medical care delay due to cost and needing but not affording medical care among privately insured individuals in 2018. In 2021, there were declines among Medicaid beneficiaries in reporting medical care delay due to cost and needing but not affording health care but not among privately insured individuals. However, access declined in 2022 among Medicaid beneficiaries remained relatively stable among privately insured individuals.
The event-study difference-in-differences estimates for health care access are reported in Table 2 Panel A. Estimates are consistent with the descriptive trends, suggesting improved access among Medicaid enrollees in 2021, although this improvement dissipated in 2022. Compared to privately insured individuals, Medicaid beneficiaries were less likely to report delayed medical care due to cost over the past 12 months by nearly 4 percentage-points in 2021 than 2019. There was also less reporting of needing but not affording medical care, mental health services, and medications by about 3 percentage-points. However, all effect estimates for access measures are smaller and statistically non-significant in 2022, generally consistent with the smaller effects on coverage in 2022 than 2021 described above. Effect estimates in 2020 were also small and non-significant. Aggregating post-FFCRA years shows significant declines in delaying care due to cost in 2020-2022 and declines in needing but not affording services in 2021-2022 (Table 2 Panel B). These two effect estimates are smaller and not statistically significant when only comparing 2022 to 2019.
Difference-in-Differences (DD) Estimates of the FFCRA Effects on Health Care Access, 2019 to 2022 NHIS, 19 to 64 Year Old Individuals below 300% of the FPL.

Note. Heteroskedasticity-robust standard errors are in parentheses. The effects in Panel A are estimated from an event study DD model and represent changes in the likelihood of experiencing care delays due to cost and unaffordable health care over the past 12 months in each year from 2020 to 2022 relative to 2019 among Medicaid beneficiaries compared to privately insured individuals. Estimates in Panel B are estimated from another DD model that pools FFCRA years into one time indicator (relative to 2019). This DD model is estimated first aggregating 2020, 2021, and 2022, then 2021 and 2022 (and excluding 2020 data from the model). The sample includes non-elderly adults aged 19 to 64 years old with family income below 300% of the federal poverty level. All regressions control for age, sex, education, marital status, employment status, family income as percentage of FPL, a set of binary indicators for chronic conditions including arthritis, asthma, cancer, coronary heart disease, high cholesterol, diabetes, heart attack, hypertension, stroke, and COPD, and year and Census region fixed effects.
Data from 2020 NHIS is excluded from the study sample since 2020 was a partial FFCRA year and the data collection was significantly affected by the pandemic.
Data from 2021 NHIS is further excluded from the study sample to account for potential continuing impacts from COVID-19 pandemic.
P < .05. **P < .01. ***P < .001.
Results were largely similar when adding socioeconomic/health subgroup by year interactions, accounting for the complex survey design, employing the alternate samples, and controlling for mental health status (Supplemental Appendix Tables 7–9). When examining pre-trends for access in 2015-2018, there is no consistent pattern of differences between the two groups (Supplemental Appendix Table 10). For 2 of the 4 outcomes, delayed medical care due to cost and needing but not affording care, there is an increase in 2018 among privately covered individuals. However, there is no such effect for the two other access outcomes or for prior years (2016-2017 vs 2015). One potential explanation is the disproportional increase in marketplace and employer-sponsored family premiums in 2018.19,20 Deductibles in employer-sponsored plans also increased more in 2018 than the prior years. 21 Taken as a whole, there do not appear to be systematic pre-trend differences that would explain the post-FFCRA effects.
Health Services Utilization
The unadjusted graphs of the health services utilization measures in 2019-2022 show little difference in trends between Medicaid and privately insured individuals (Supplemental Appendix Figure 3). Consistent with that, the event-study difference-in-differences estimates are small and non-significant (Table 3 Panel A). Effect estimates are also small and not significant when aggregating post-FFCRA years (Supplemental Table 3 Panel B). While most results are comparable in the alternate models (Supplemental Appendix Table 11), samples (Supplemental Appendix Table 12) and controlling for mental health status (Supplemental Appendix Table 13), there was an increase in reporting doctor’s visits and decline in ED visits in 2021 among Medicaid beneficiaries when extending the sample to income below 400% FPL, and a decline in ED visits in 2022 when selecting the sample based on high school or less education. There were no pre-trends (2015-2018) in these health services utilization outcomes (Supplemental Appendix Table 14).
Difference-in-Differences (DD) Estimates of the FFCRA Effects on Health Services Utilization, 2019 to 2022 NHIS, 19 to 64 Year Old Individuals below 300% of the FPL.

Note. Heteroskedasticity-robust standard errors are in parentheses. The effects in Panel A are estimated from an event study DD model and represent changes in the likelihood of having any doctor office visits, any emergency room use, and any hospital stays over the past 12 months in each year from 2020 to 2022 relative to 2019 among Medicaid beneficiaries compared to privately insured individuals. Estimates in Panel B are estimated from another DD model that pools FFCRA years into 1 time indicator (relative to 2019). This DD model is estimated first aggregating 2020, 2021, and 2022, then 2021 and 2022 (and excluding 2020 data from the model). The sample includes non-elderly adults aged 19 to 64 years old with family income below 300% of the federal poverty level. All regressions control for age, sex, education, marital status, employment status, family income as percentage of FPL, a set of binary indicators for chronic conditions including arthritis, asthma, cancer, coronary heart disease, high cholesterol, diabetes, heart attack, hypertension, stroke, and COPD, and year and Census region fixed effects.
Data from 2020 NHIS is excluded from the study sample since 2020 was a partial FFCRA year and the data collection was significantly affected by the pandemic.
Data from 2021 NHIS is further excluded from the study sample to account for potential continuing impacts from COVID-19 pandemic.
Discussion
This study provides novel evidence on how the FFCRA continuous Medicaid coverage provision affected coverage continuity, access to care, and health services utilization for individuals enrolled in Medicaid. We examine these effects over more than 2 years since enactment in March 2020. We find that Medicaid beneficiaries had less coverage interruption following this provision primarily in 2021 and to a lesser extent in 2022. This improvement in coverage continuity led to closing the gap in the proportion experiencing coverage interruptions in the last 12 months between Medicaid beneficiaries and privately insured individuals. Moreover, there is some evidence of enhanced access to care among Medicaid beneficiaries in 2021 with less reporting of delayed medical care due to cost and of needing but not affording medical care, mental health care, and medications. However, there is little evidence of effects on health services utilization.
Why would the FFCRA impact on access dissipate in 2022? We acknowledge that our study provides no direct evidence on this question. Notably, this result is consistent with the smaller effects on coverage interruption in 2022 than 2021. One potential factor is underreporting of continued Medicaid coverage among beneficiaries who recently gained private coverage (for example, due to employment) especially in 2022 either because they were unaware of continued Medicaid coverage or because their private insurance was the primary source of coverage and payer.22 -24 Because of the 12-month look-back window in reporting outcomes, those covered by Medicaid in that window but reported private coverage only at the survey time (and therefore assigned to the control group) could have benefited from the FFCRA, leading to attenuated effects on outcomes.
This potential underreporting is consistent with the gap in Medicaid coverage rates between the survey data like American Community Survey (ACS) and Current Population Survey and administrative Medicaid enrollment reports during the pandemic.23 -25 For example, the undercount of Medicaid enrollment in the ACS compared to administrative Medicaid enrollment increased from about 8% in 2019 to 12% in 2020 and 16% in 2021. 25 With the continuing labor market rebound in 2022, 26 more people would gain private coverage with employment 27 and more of those individuals would have had Medicaid coverage for over 12 months, possibly leading to more underreporting of Medicaid coverage in survey data. In the NHIS sample, the proportion reporting both private and Medicaid coverage (though excluded from the analysis) increased from 0.8% in 2020 to 1.2% in 2022, further suggesting increased Medicaid underreporting among the privately covered group in 2022.
A related issue is understanding whether the difference-in-differences estimates in this study are primarily driven by improvement in coverage continuity and access among Medicaid beneficiaries or worsening of these outcomes among privately covered individuals or both. The descriptive trends (Supplemental Appendix Figure 1) indicate that both changes are contributing to the estimates for coverage continuity in 2021, although the change among the Medicaid covered group is larger than those among the privately covered group. However, coverage interruptions decline in 2022 more for privately than Medicaid covered individuals. This is consistent with underreporting of continued Medicaid coverage among privately covered individuals, but also with other possible changes such as longer employment and marketplace subsidy expansions under the American Rescue Plan (ARP) of 2021 leading to more stable private coverage by 2022. In that case, the FFCRA effect estimates on coverage interruptions of Medicaid beneficiaries may be viewed as a lower bound.
In contrast, for the access measures, there is less of a change among the privately insured group based on the descriptive trends (Supplemental Appendix Figure 2), and the difference-in-differences estimates appear to be largely driven by changes within the Medicaid covered group, including improvement in access in 2021 and worsening in 2022. A potential factor for this apparent worsening in reported access among Medicaid beneficiaries in 2022, which may also explain the dissipated FFCRA effects on access in that year, is the end of the pandemic income-support programs (eg, stimulus checks, expanded child tax credits, and pandemic related unemployment insurance programs) 28 and the skyrocketing inflation in 2022. 29 These changes might disproportionately constrain the financial resources of Medicaid beneficiaries and their access to care such as by reducing their ability to cover transportation costs and cost-sharing. 30
We find no evidence for effects on health services utilization. Health care supply and workforce constraints during the pandemic may contribute to this result. Doctor visits were generally steady among both groups during the pandemic, with a slight decline among privately covered individuals in 2021. In contrast, both groups had a decline in ED visits in 2020-2021 followed by an increase in 2022. And hospitalizations increased slightly for privately insured individuals in 2021 and for Medicaid beneficiaries in 2022. Because of changes in healthcare delivery, it is possible that the effect of Medicaid continuity on utilization (and access) during the pandemic may differ from a more ordinary time. Moreover, if some individuals anticipate health coverage loss and time health services utilization before that to the extent possible, this may partly contribute to the null effects on health services use over the past 12 months despite some evidence of decline in months without coverage. Another factor is the widespread use of telehealth during the pandemic. The NHIS survey did have a specific variable documenting the use of telehealth until 2020, so we cannot directly estimate effects on telehealth services use. The measure of any doctor/health professional visits is derived from the following NHIS question: “About how long has it been since you last saw a doctor or other health professional about your health?” 31 Beginning in 2020, the NHIS added the following question on use of telehealth services: “During the past 12 months, have you had an appointment with a doctor, nurse, or other health professional by video or by phone?” 31 The 2020-2022 NHIS data on this measure shows that among those who reported using telehealth services, about 92%-94% (varying by year) also reported seeing a doctor or other health professionals based on the other question by which we measure seeing a doctor or health professional. This suggests that most individuals who used telehealth services as reported on the recently added question either also had an in-person visit or also reported their telehealth services under the other question. In any case, the outcome measure of seeing a doctor or health professional is likely capturing any use of telehealth services use for most individuals.
Previous studies using data from individual states point to the FFCRA continuous Medicaid coverage provision as the main driver for the rise of Medicaid enrollment during the pandemic due to declines in disenrollment. 32 Their findings are consistent with ours. However, our study focuses on coverage continuity, access, and utilization experiences of individuals enrolled in Medicaid at the survey time when the FFCRA was active, so we go beyond examining effects on the proportion covered in Medicaid at 1 point in time and focus on how the experiences of Medicaid beneficiaries changed under the FFCRA.
It is estimated that approximately 17 million individuals, including 5 million children and 12 million adults, would ultimately lose their Medicaid coverage after the FFCRA continuous Medicaid coverage expired on March 31, 2023. 33 As a result, improving Medicaid coverage continuity has recently become a primary policy focus, although efforts thus far have been largely piecemeal. The ARP introduced an option for states to extend postpartum Medicaid coverage from 60 days to a full year, effective April 1, 2022. 34 As of September 2023, 37 states and the District of Columbia have implemented this 12-month extension. While this extension does not eliminate the risk of Medicaid churning after 12 months, it improves coverage continuity at the higher income eligibility levels during one-year postpartum.
Furthermore, the recent Consolidated Appropriations Act of 2023 mandates that all states implement 12-month continuous coverage for children in Medicaid and CHIP beginning in January 2024. Although there is presently no federal directive requiring a similar policy for Medicaid adult beneficiaries, some states have taken the initiative to provide 12-month continuous coverage to adults. 15 As previously mentioned, 4 states (Kansas, New Jersey, New York, and Oregon) have obtained waivers to implement a 12-month continuous coverage plan for adult Medicaid beneficiaries. Additionally, Massachusetts has an approved waiver to offer 12-month continuous coverage to individuals following their release from correctional institutions and 24-month coverage for those experiencing homelessness. Our study offers some insights into the potential effects of such extensions. However, as noted before, effects could differ from the FFCRA provision due to changes in health care supply constraints and demand over this period and the difference in the length of continuous coverage (eg, 12 months versus up to 3 years under the FFCRA provision). Understanding the effects of these policies in future studies as data become available would be important.
Limitations
Our study has some limitations. First, other policies during the COVID-19 pandemic aiming at steadying private coverage such as the ARP complicate the comparison to the private group. As noted above, any potential effects from these policies on improving private insurance coverage continuity and utilization of services with private coverage would lead to lower-bound estimates of the FFCRA effects on Medicaid covered individuals in this design comparing to privately insured individuals. This limitation implies that the effects on access and services utilization might be larger than estimated in this study. Another issue is that the 12-month look-back window for outcomes from 2020 and the first 2 months of 2021 still includes time when the FFCRA was not active, which could dilute the policy effects primarily in 2020. Since interview month is not available for 2019 (the reference year), we do not select observations based on interview month from 2020-2021 to avoid seasonal composition differences compared to 2019. Also, outcomes are self-reported which may introduce measurement errors. However, such errors are not unique to certain years or groups and, therefore, are unlikely to bias the policy effect estimates. An additional limitation is that the publicly available NHIS data does not include state identifiers, preventing us from evaluating state-specific characteristics that could potentially lead to varying effects of FFCRA across states such as provider supply. However, not controlling for such state characteristics should not confound the average effects, since FFCRA is a national policy implemented across all states. Additionally, controlling for Census region fixed effects accounts for some geographic variation in the study outcomes.
Conclusion
In study, we find that Medicaid continuous provision under the FFCRA enhanced insurance continuity among Medicaid beneficiaries. Moreover, there is some evidence of enhanced access to care including decline in reporting delayed medical care due to cost and in needing but not affording medical care, mental health care, and medications. However, there is overall no evidence of effects on health services utilization.
Supplemental Material
sj-docx-1-inq-10.1177_00469580241282052 – Supplemental material for Effects of the Families First Coronavirus Response Act on Coverage Continuity and Access for Medicaid Beneficiaries
Supplemental material, sj-docx-1-inq-10.1177_00469580241282052 for Effects of the Families First Coronavirus Response Act on Coverage Continuity and Access for Medicaid Beneficiaries by Wei Lyu and George L. Wehby in INQUIRY: The Journal of Health Care Organization, Provision, and Financing
Footnotes
Author’s Note
Wei Lyu is also affiliated to University of Alabama at Birmingham, Birmingham, AL, USA.
Authors Contribution
Wei Lyu contributed to design, data acquisition, statistical analysis, data interpretation, and manuscript drafting. George Wehby contributed to conception, design, statistical analysis, data interpretation, and writing and critically revising the manuscript. All authors gave final approval and agreed to be accountable for all aspects of the work.
Data Availability Statement
The study data is publicly available and can be obtained from National Center for Health Statistics, Centers for Disease Control and Prevention.
Declaration of Conflicting Interests
The author(s) declared no potential conflicts of interest with respect to the research, authorship, and/or publication of this article.
Funding
The author(s) received no financial support for the research, authorship, and/or publication of this article.
Ethical Approval and Informed Consent Statement
Institutional Review Board review is not required since this study uses de-identified and publicly available data.
Supplemental Material
Supplemental material for this article is available online.
References
Supplementary Material
Please find the following supplemental material available below.
For Open Access articles published under a Creative Commons License, all supplemental material carries the same license as the article it is associated with.
For non-Open Access articles published, all supplemental material carries a non-exclusive license, and permission requests for re-use of supplemental material or any part of supplemental material shall be sent directly to the copyright owner as specified in the copyright notice associated with the article.