
Abstract
We examine the evidence from the long-run abnormal returns using data for 76 health care and biopharmaceutical initial public offerings (IPOs) listed in a 29-year period between 1986 and 2014 in the Association of Southeast Asian Nations (ASEAN) countries such as Indonesia, Malaysia, Singapore, Thailand, the Philippines, Vietnam, Myanmar, and Laos. Based on the event-time approach, the 3-year stock returns of the IPOs are investigated using cumulative abnormal return (CAR) and buy-and-hold abnormal return (BHAR). As a robustness check, the calendar-time approach, related to the market model as well as Fama-French and Carhart models, was applied for verifying long-run abnormal returns. We found evidence that the health care IPOs overperform in the long-run, irrespective of the alternative benchmarks and methods. In addition, when we divide our sample into 5 groups by listing countries, our results show that the health care stock prices of the Singaporean firms behaved differently from those of most of the other firms in ASEAN. The Singaporean IPOs are characterized by a worse post-offering performance, whereas the IPOs of Malaysian and Thai health care companies performed better in the long-run.
Introduction
Globally, health care expenditure (spending per capita) increased dramatically by 60% between 2004 and 2014. Health care expenditure covers a wide range of areas, such as medical practitioner incomes, costly medical procedures, pharmaceutical products, and hospital administration. World Health Organization (WHO) data estimate the average total health care spending per capita in Association of Southeast Asian Nations (ASEAN) to be US$544. Interestingly, not too many investors realize that the ASEAN region (ie, Brunei, Cambodia, Indonesia, Laos, Malaysia, Myanmar, the Philippines, Singapore, Thailand, and Vietnam) provides good access to a wealth of innovation in the health care service sector; much of this innovation has been derived from other sectors. In addition, there is an increasing demand for health care services, spurred on by the growth in middle-class households, better education, and greater health awareness. Singapore and Brunei top the list with expenditure per capita of US$2273 and US$1449, respectively. Medical tourism steadily contributes to the increasing number of foreign patients using some of ASEAN’s world-class medical facilities. Thailand’s health tourism is now worth about US$2 billion and receives 40% of the medical tourist arrivals in Asia. Malaysia’s foreign patients, meanwhile, reached over 600 000 in 2015 with the revenue from them increasing from US$83.6 million in 2007 to US$197.6 million in 2015. ASEAN is expected to boost health spending to provide better health care services and catch up with the average spending rate in fully developed countries.
Rapidly aging populations, especially in Singapore and Thailand; the increasing prevalence of chronic diseases; and government initiatives improving access to health care services are the key significant factors for overall public health care spending in the South East Asia region. Recently, the medical tourism market in Malaysia, Singapore, and Thailand was projected to grow from between US$2.64 billion in 2014 and US$4.48 billion in 2019. Because of this, health care firms are eager for growth through developing and expanding their products and services, with entry into the public market typically receiving funding from multiple sources. Another well-known source of funding for several heath care companies is through the issue of their own initial public offerings (IPOs). An IPO is defined as the first offer of stock by a private company to the public. IPOs are generally issued by companies seeking or raising capital to create a public market in which founders and other shareholders can convert some of their wealth into cash at a future date and the IPO issuers will obtain the assistance of underwriters or investment banks. 1
There are several reasons for health care, biotechnology, and pharmaceutical firms seeking to sell their stocks to the public; they are the internal growth of existing or potential products and product lines, diversification into related and unrelated areas, an exit mechanism for owners, and for survival. 2 However, IPO anomalies have been closely examined over the last few decades. A well-known study was of “IPO underperformance in the long-run.” 3 Most prior empirical studies suggest that IPOs have negative abnormal returns over different holding periods after going public.4-6 Thus, investors could not gain any returns if they bought the IPOs on the first trading day and held them for the long-horizon period. However, health care IPO performance has not been examined by itself. To the best of our knowledge, the performance of health care IPOs has only received limited attention in the literature. Existing studies focus only on the US market.7-9 Firms doing business related to a medical program or to pharmaceutical and biotechnology must deal with revenue flows that are not driven by market forces; the demand for health care services is instead determined by government policies. This may lead health care and biopharmaceutical IPOs to perform differently in the long-run when compared with IPOs from other industries. In this article, we aimed to study the long-term performance of health care and biopharmaceutical IPOs for companies listed on the Indonesian, Malaysian, Singaporean, and Thai stock markets and to examine the robustness of existing empirical evidence, using a variety of different methods to calculate abnormal returns by applying different market benchmarks and by using more robust statistical tests.
In terms of the value of investigating the ASEAN case and the contribution of our study, the health care IPO stock market is particularly interesting to analyze for a number of reasons. First, compared with other countries that already have established markets, such as the United States and the United Kingdom, the stock markets in the Southeast Asia region are relatively new stock exchanges. As a result, there are not yet many public companies from the health care industry listed on these stock exchanges. Such health care IPOs have consequently not been closely studied in the ASEAN market in the same way as they have been in established markets. Second, the size of firms in Southeast Asia is moderately small, and thus, the exchange requirements to list IPOs differ from those in developed countries. This may cause different patterns in ASEAN health care IPOs’ pricing and thus lead to different price dynamics over time. This is also of significant interest because the existence of any long-term return patterns in the IPO market can affect investment strategies. Third, the ASEAN exchange is a moderate trading market, but it is nevertheless well integrated into the global financial system. Hence, the results presented in our study may have broader implications for many emerging markets that are also trying to go global by implementing economic, trade, and financial reforms. Our findings may therefore indeed be useful and provoke expressions of interest in health care IPOs from investors in many other emerging markets. Finally, we also present more results for robustness purposes, using a calendar-time approach based on the market model and on the Fama and French 3-factor and the Carhart 4-factor models. The calendar-time approach is applied in this study to address contemporaneous cross-correlation, which may be a concern, given some financial turmoil (eg, the Asian Financial Crisis in 1997, and also the Global Financial Crisis in 2007) affecting all IPO stocks in the market at certain points in time during the sample period.
Our findings suggest that health care and biopharmaceutical IPOs in ASEAN outperform in the long-run, irrespective of the alternative benchmarks and methods used. Based on the event-time and the calendar-time approaches, our findings support the results of studies by Palkon 10 and Williams and Young, 9 which concluded that health care IPOs overperform in the long-horizon. Interestingly, when we consider the listed countries individually, the Malaysian and Thai IPOs perform better in the long-run than the Indonesian and Singaporean IPOs.
Related Literature
The behavior of IPO returns in the long-run has attracted considerable attention in the literature in recent years. Ritter 3 showed evidence of substantial negative returns from IPOs in the long-horizon. He suggested that IPO firms intend to go public when investors are overoptimistic about the firm’s future growth potential. Thus, one reason for the long-term performance of IPOs is a possible overvaluation in the early aftermarket trading. Ritter 11 attributed such long-term underperformance to the fact that IPO investors are overoptimistic about IPO valuations, whereas there is much uncertainty concerning the value and growth of the IPO companies. In consequence, investors overpay for IPOs in the initial period of listing. However, when more information becomes available in the subsequent period, the difference in opinions between optimistic and pessimistic investors is reduced. As a result, the IPO price declines after going public, or when the investors receive more information about the company.
Shiller 12 introduces the “fads hypothesis” from an investor’s viewpoint. This maintains that, contrary to the rational expectation models, there are fads in the stock market, and the IPO market overpricing is due to the presence of such fads. For a similar hypothesis, Ritter3,11 proposes an “impresario hypothesis” to explain the phenomenon of IPO underperformance in the long-run. Investment bankers (the impresarios) underprice IPOs to stimulate an excess in IPO demand. Broadly speaking, the impresario hypothesis or fads hypothesis demonstrates that the market for IPOs is subject to fads and that IPOs are deliberately underpriced by investment bankers to create the appearance of excess demand, much in the same way as the promoter of a rock concert attempts to make it an event. These hypotheses suggest that the lowest subsequent returns should follow the initial returns.
Most of the prior empirical studies have supported IPO underperformance in the long-run.3,5,6,13-15 In contrast, the findings of Jelic et al, 16 Ahmad-Zaluki et al, 17 and Moshirian et al 18 have all demonstrated IPOs’ long-run overperformance using market index benchmarks in certain countries, such as Malaysia, China, and Korea. This somewhat mixed picture regarding IPOs’ long-term performance may be related to the application of different methods and approaches to measure the abnormal returns. Companies doing business within the health care service must deal with revenue flows that are not mainly driven by market forces. Therefore, the demand for health care services is substantially determined by government policy, as opposed to consumers’ preferences, as is the case for most other goods and services. 8 Therefore, some specific features of health care and biopharmaceutical shares should be taken into account. The value of health care and biopharmaceutical IPOs may be adversely affected if financial markets react to the presence of nonmarket revenue flows. As a result, investors may believe that firms in the health care sector are less able to enhance revenues through traditional marketing and promotion techniques, compared with their counterparts in other industries. We would therefore expect IPO underperformance in the long-run to be as documented by several IPO studies, if the market treated health care IPOs similarly.
In the health care and biopharmaceutical context, Guirguis et al 8 specifically investigated the postoffering performance of 223 IPOs issued during 1985-1996 in the health care industry. Their results showed that the IPOs’ 3-year buy-and-hold abnormal return (BHAR) underperformed the returns of the market index by 15% and the matching health care index by 85%. Similarly, Brau and Holloway 7 examined the aftermarket performance of 345 US health care IPOs going public between 1970 and 2008 in the period up to 5 years after their listing. They reported that the IPOs underperformed the benchmark in the long-run by an average of −0.22%, −28.32%, and −51.38% using 1-, 3- and 5-year BHARs, respectively. In contrast to recent studies, William and Young 9 used 133 biopharmaceutical IPOs listed in the US market between 1996 and 2007. They found a positive 3-year aftermarket return of 14.1%. However, they calculated the long-run return of IPOs by using the offer price. This may have produced such a biased result because they considered the initial return (or IPO underpricing) to calculate the long-run abnormal return. This was similar to the study by Palkon 10 of 81 health care IPOs going public in 1997. He also used the offer price to calculate aftermarket return and thus found 65.4% of the IPOs had a positive return. There are a few important similarities between the previous event studies of the long-term performance of health care and biopharmaceutical IPOs.7,8,10 First, they used only BHAR when measuring the long-run IPO performance and, furthermore, they considered an equally weighted (EW) portfolio of IPOs.
However, Fama 19 suggested that BHAR has more statistical problems than cumulative abnormal return (CAR) due to a positive skewness bias. This leads to the negative bias of the standard t statistics. To address this inference problem, Lyon et al 20 developed new techniques, such as a skewness-adjusted t test. Unfortunately, previous studies of the health care performance of IPOs were unaware of the skewness bias issue. This article addresses these issues in the research analysis, and in contrast to existing previous studies, the health care IPO performance in ASEAN countries in the long-run was examined, using a wide range of alternative benchmarks and models that had been designed to adjust for size effects. In addition to this, as a further robustness check, we examined the cross-section average of the calendar regression results of the long-run returns.
Research Methodology
Previous studies used several different methods to investigate the long-term performance of IPOs. In general, either raw returns or abnormal returns (measuring price dynamics relative to some benchmark) are used to assess the long-run performance. The studies of Ritter, 3 Carter et al, 21 Jelic et al, 16 Durukan, 22 Ritter and Welch, 1 Burrowes and Jones, 23 Álvarez and González, 24 and Su and Bangassa 15 employed cumulative average returns (CAR) and buy-and-hold returns (BHAR). In our article, we follow this event-time approach by exploiting abnormal return measures, CAR and BHAR, to investigate the performance of health care IPOs in the long-run. We also selected the appropriate market indices as benchmarks for each IPO firm depending on their stock exchange listing and the size of the IPO firms. The abnormal returns of the IPOs were considered in horizons of up to 36 months after the first day of trading. This was done to be able to make comparisons with the findings presented in previous IPO studies, which typically followed Ritter 3 and other papers that had adopted similar methodology.
Cumulative Abnormal Return
The market-adjusted abnormal returns of company i in event month t (ARi,t) were calculated for each event month t as follows:

where Ri,t is the monthly raw return of the company i in event month t excluding the initial return. This article excludes IPO underpricing because of the effect that stabilizing activities by underwriters may exert on stock prices.
The average market-adjusted return for a sample of n companies in event month t is then defined as follows:

In the case of the value-weighted (VW) arithmetic mean of the market-adjusted returns, the abnormal return was computed as follows:

where ω i is the weight of market value calculated as MVi / ΣiMVi (and MVi is the market value of the IPO firms on the first day of trading) and ARi,t is the market-adjusted return. The cumulative average abnormal return (CARi,t) of company i from event month 1 to event month t was defined as follows:

Buy-and-Hold Abnormal Return
The abnormal return of company i in event month t defined as buy-and-hold abnormal return (BHARi,t) was calculated as follows:

where Ri,t and Rm,t are the monthly returns on the stock i and the market index in event month t, respectively. The mean buy-and-hold returns were calculated as follows:

For the EW variant: ω i = 1 / n, and for the VW variant: ω i = MVi / ∑iMV; MVi is the IPO firm’s stock market value on the first trading day. Previous empirical studies have documented that long-run abnormal returns are positively skewed.15,17,20,25 As a result, the conventional t statistic is negatively biased. To eliminate the skewness bias and to be able to perform tests that the CARs and BHARs are significantly different from 0, the skewness-adjusted t statistic needs to be applied:
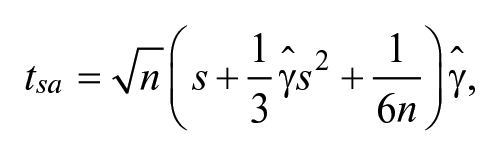
where
Data and Sample
The sample adopted in this study includes all 76 health care and biopharmaceutical IPO stocks in the ASEAN region, listed on the Indonesian, Malaysian, Singaporean, Thai, Philippines, Vietnamese, Myanmar, and Lao stock markets during the period from 1986 to 2014. Unfortunately, there is no Standard Industrial Classification (SIC) code system in ASEAN countries. However, they do have their own particular industry classification, which differs from exchange to exchange. In our sample, health care services, hospitals, and pharmaceutical and biotechnological companies are therefore grouped into a single industry, namely, the health care and biopharmaceutical sector. The stock price data for individual IPO companies were collected from the Thomson Reuters DataStream. In particular, the data comprised each IPO’s closing price on the first day of trading and the 36 monthly stock returns following going public. The monthly stock returns for each IPO were compared with monthly returns of stock market indices such as the Jakarta Composite Index (JSX), the FTSE Straits Times Index (STI), the FTSE Bursa Malaysia, the Stock Exchange of Thailand (SET), the Philippines Stock Exchange (PSE), the Hanoi Stock Exchange (HSE), the Yangon Stock Exchange (YSE), and the Lao Securities Exchange (LSX) indices.
Table 1 reports the main characteristics of the data divided according to IPO year across the entire sample and split by listed country samples. However, for the Philippines, Vietnam, Myanmar and Laos, the number of health care IPOs was not large enough for meaningful statistical analysis. We therefore grouped them under one heading, namely, “Other.” Approximately 66% of health care IPOs went public after the Asian Financial Crisis in 1997 and the Internet Bubble period. Most of the IPOs in our sample are from the Malaysian stock market (27%). In all, 24% and 21% of the sample belong to the Thai and Singaporean stock markets, respectively.
Sample Size of Health Care IPOs in ASEAN Countries.

Note. Health care and biopharmaceutical IPOs in Philippines, Vietnam, Myanmar, and Laos are combined in one group as the “Other.” IPO = initial public offering; ASEAN = Association of Southeast Asian Nations.
Empirical Findings
In this section, the main results, including a robustness analysis, are presented and an extensive discussion of our findings is provided. Table 2 shows the descriptive statistics for the excess returns of Thai IPOs over the 36-month period after going public. In relatively finite samples, the abnormal return may suffer from the problem that the excess returns are not normally distributed. Therefore, the Jarque-Bera test was used to verify the null hypothesis about normal distribution. We rejected the null hypothesis. This indicates that the average market-adjusted returns between months 1 and 36 are not normally distributed, which may cause statistical inference problems. To check for a possible bias in the calculation of long-run abnormal returns, we applied a bootstrapped skewness-adjusted t statistic and the nonparametric Wilcoxon signed rank test.
Average Market-Adjusted Returns for Health Care IPOs in ASEAN From 1986 to 2014 and Normality Test.

Note. This table shows descriptive statistics of market-adjusted returns up to 36-month period after going public, excluding the initial return (IPO underpricing). The Jarque-Bera test results of null hypothesis show distributions that are normal. IPO = initial public offering; ASEAN = Association of Southeast Asian Nations.
**, and * indicate statistical significance at the 1%, 5%, and 10% levels, respectively.
Long-Run Performance Results in the Portfolios of Health Care and Biopharmaceutical IPOs
Tables 3 and 4 present the EW and VW abnormal returns of health care IPO firms for up to 3 years after listing. These are calculated using CAR and BHAR measures. The EW and VW abnormal returns for the first month are 5.67% and 1.24% and are statistically significant at 0.10 and 0.05 levels. This implies that the initial return continues to the early aftermarket trading. For the ASEAN market (entire sample), the results indicate that health care IPOs are overperforming between 4.88% (Adj. t-stat = 1.91) at month 1 and 2.82% (Adj. t-stat = 2.52) and 5.57% (Adj. t-stat = 2.48) for the EW CARs and BHARs at the end of year 3. This finding of an underperformance is in contrast with Guirguis et al 8 and Brau and Holloway, 7 who showed that the US health care IPOs underperform relative to the benchmarks in the long-run. Notably, the aftermarket returns of the ASEAN health care and biopharmaceutical IPOs, measured by BHAR, display a much greater overperformance than those using CAR. However, when we divided the entire sample into 5 subsamples according to listing exchange, we found a wide variation in the health care IPOs’ performance in the long-horizon across countries. For Malaysian and Thai stock markets, the results indicate that the health care and biopharmaceutical IPOs overperformed between 4.08% and 7.94% at month 1 and 57.25% and 18.99% at month 36, respectively, for the EW BHARs. In contrast, for the Singaporean health care IPOs, it was found that there were negative returns and that they were statistically significant at the end of year 3 using EWCAR (–36.54%) and EWBHAR (–39.41%). Negative abnormal returns at year 3 were also obtained using the nonparametric Wilcoxon signed rank test. This finding of underperformance in the Singapore market is consistent with the results of existing studies in the US health care market.7,8 Several possible reasons which could explain the underperformance of the Singaporean health care IPOs and support the findings of the US market are that the economic growth and system differ from those in ASEAN countries and the size of the capital market is considerably larger than the others. Furthermore, Singapore is only one developing country in the same region.
Equally and Value-Weighted CARs for Health Care IPOs Listed From 2001 to2012 in ASEAN.
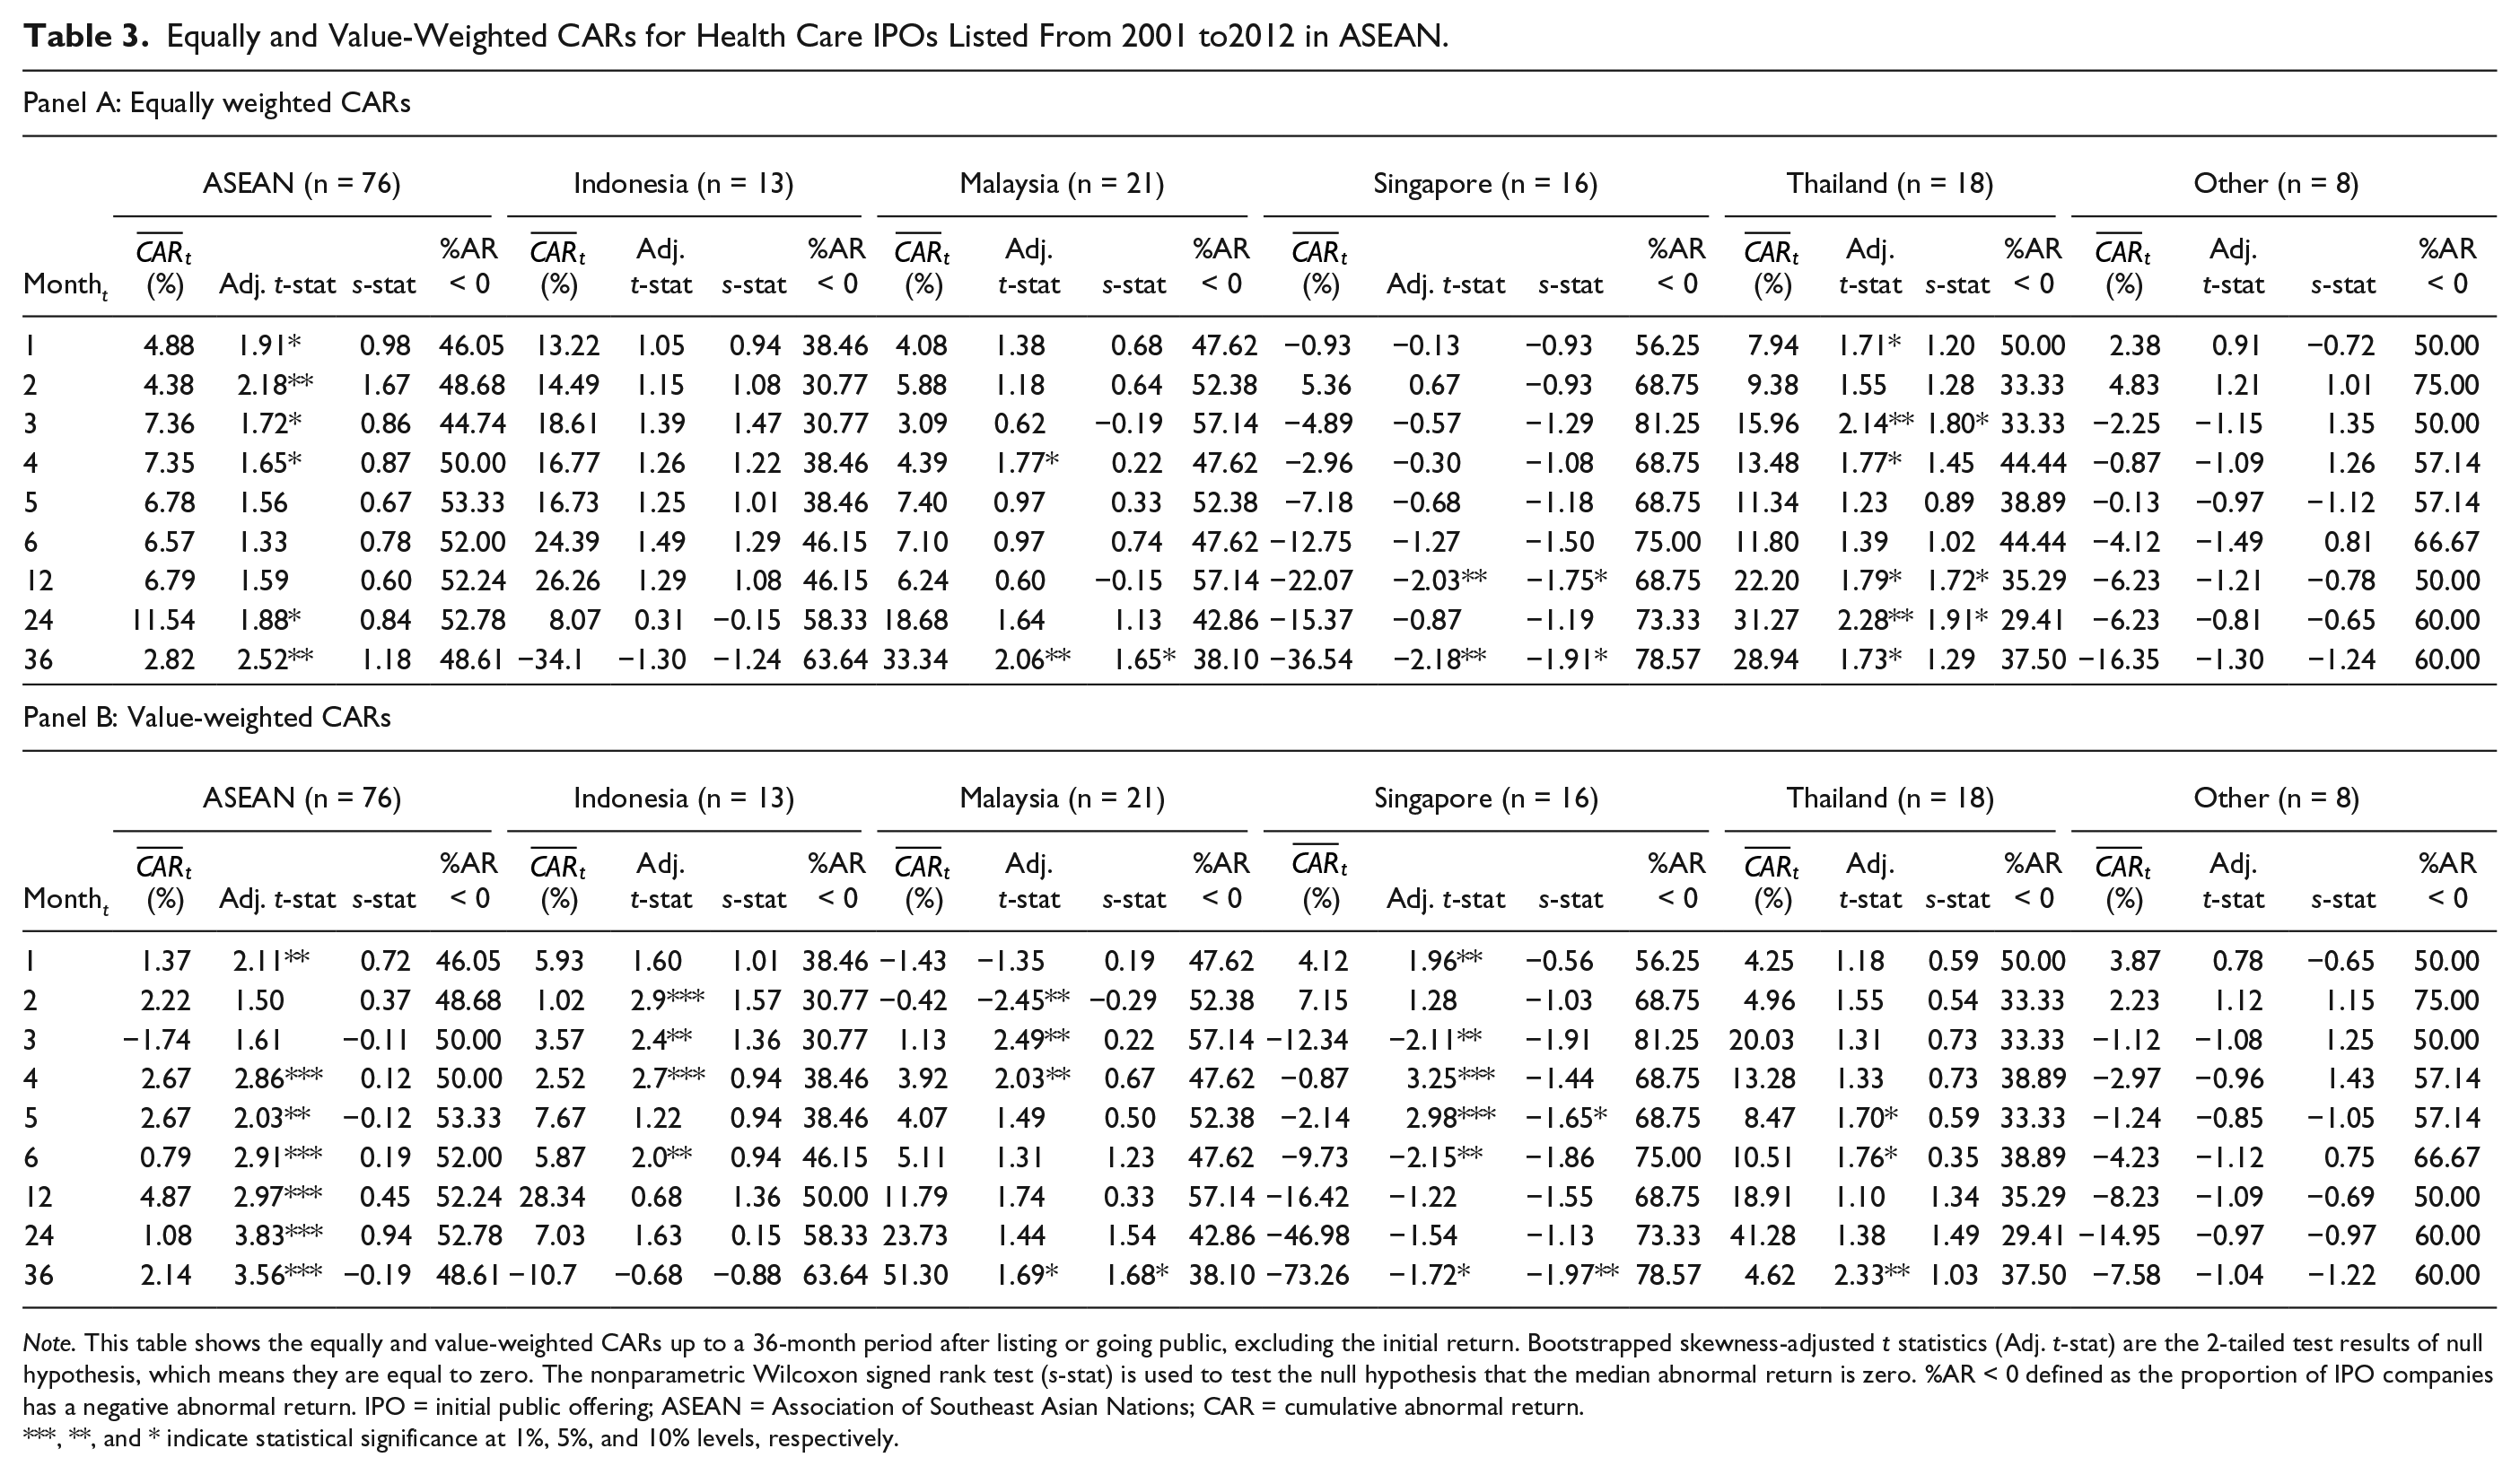
Note. This table shows the equally and value-weighted CARs up to a 36-month period after listing or going public, excluding the initial return. Bootstrapped skewness-adjusted t statistics (Adj. t-stat) are the 2-tailed test results of null hypothesis, which means they are equal to zero. The nonparametric Wilcoxon signed rank test (s-stat) is used to test the null hypothesis that the median abnormal return is zero. %AR < 0 defined as the proportion of IPO companies has a negative abnormal return. IPO = initial public offering; ASEAN = Association of Southeast Asian Nations; CAR = cumulative abnormal return.
**, and * indicate statistical significance at 1%, 5%, and 10% levels, respectively.
Equally and Value-Weighted BHARs for Health Care IPOs Listed From 2001 to2012 in ASEAN.

Note. This table shows the equally and value-weighted BHARs up to a 36-month period after listing or going public, excluding the initial return. Bootstrapped skewness-adjusted t-statics (Adj. t-stat) are the 2-tailed test results of null hypothesis, which means they are equal to zero. The nonparametric Wilcoxon signed rank test (s-stat) is used to test the null hypothesis that the median abnormal return is zero. %AR < 0 defined as the proportion of IPO companies has a negative abnormal return. IPO = initial public offering; ASEAN = Association of Southeast Asian Nations; BHAR = buy-and-hold abnormal return.
**, and * indicate statistical significance at 1%, 5%, and 10% levels, respectively.
In attempts to measure the performance of IPOs in the long-run, one can apply either an EW portfolio of IPOs or a VW market portfolio to calculate CAR and BHAR. Fama 19 suggested that EW returns may produce different inferences from those derived from VW returns. We therefore considered both EW and VW portfolios, which provided an important robustness check for the findings. The results of a cross-sectional analysis and a country-specific value-weighted cumulative abnormal return (VWCAR) and value-weighted buy-and-hold abnormal return (VWBHAR) over a 36-month horizon are presented in Tables 3 and 4, Panel B. Using the market VW portfolio of IPOs, the findings show a similar pattern of results, where the health care and biopharmaceutical IPOs for the entire Malaysian and Thai samples have positive abnormal returns after going public and show poor performance for the Singaporean health care IPOs.
The CAR and BHAR figures for the health care IPO samples in Tables 3 and 4 are plotted in Figures 1 to 4. The CAR and BHAR show an outperformance throughout the whole long-horizon period for all the Malaysian and Thai IPOs, whereas the aftermarket returns of the Indonesian health care IPOs display similar patterns between the event months 1 and 22, after which period the CAR and BHAR drop instantaneously. However, the CAR and BHAR, as EW and VW measures, for the Singaporean IPOs move just under the zero-return line (exhibiting underperformance) until the end of year 3.

Long-run performance of heath care IPOs in ASEAN countries using EWCAR.

Long-run performance of heath care IPOs in ASEAN countries using VWCAR.

Long-run performance of heath care IPOs in ASEAN countries using EWBHAR.

Long-run performance of heath care IPOs in ASEAN countries using VWBHAR.
Calendar-Time Abnormal Return Regression Results
Fama 19 also suggested that the event-time approach overstates the statistical inferences, once it no longer controls for correlation among individual firms. Therefore, as a final robustness check of the results, the calendar-time portfolio approach using Fama and French’s 26 3-factor and Carhart’s 27 4-factor models was used to eliminate the potential problems of cross-sectional correlations among ASEAN health care stocks in the event-time approach and also to obtain more robust t statistics. First, the average monthly abnormal returns on a diversified portfolio, composed of firms going public within the last 36 months in each calendar month between July 1990 and December 2014, were calculated. Second, Fama and French’s 26 and Carhart’s 27 models were estimated to test the significance in the pattern of long-term returns. If IPOs overperform on a risk-adjusted basis, a portfolio of IPOs should consistently overperform relative to the Fama-French and the Carhart models. The monthly excess returns on EW and VW portfolios of IPOs were regressed on the market premium, the size premium, and the value premium, using the following model:

and
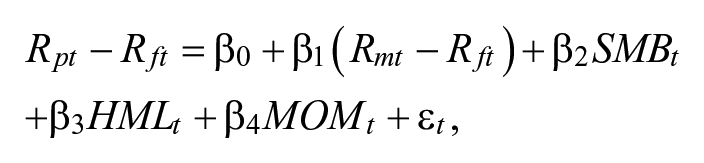
where Rpt is the return of the IPO portfolio in month t, Rft is 1-month T-bill rate, observed at the beginning of month t, Rmt is the VW return on the market index in month t, SMBt (small minus big) is the monthly return on the zero-investment portfolio for the size factor in the stock returns or the difference between the EW average of the returns on a portfolio of small stocks and a portfolio of big stocks, and HMLt (high minus low) is the monthly return on the zero-investment portfolio for the book-to-market equity factor in stock returns, or the difference between the return on a portfolio of high book-to-market ratio stocks and a portfolio of low book-to-market ratio stocks, constructed independently from the size portfolio. The MOMt variable is therefore defined as: MOM = 1/2 (Small High + Big High) – 1/2 (Small Low + Big Low). It is the monthly return on a zero-investment portfolio for a momentum factor constructed as the difference in returns between a portfolio of past winner stocks and a portfolio of loser stocks, defined as described above.
The calendar-time approach method weights each month equally. This leads to a reduction of any underperformance when it is correlated with the number of IPOs in the portfolios. 28 As a result, the intercepts, the estimates of which are based on the weighted least squares (WLS) method, weighted by the square root of the number of IPOs in the IPO portfolios in each calendar month, provide a test of the null hypothesis that the mean monthly abnormal return on the calendar-time portfolio is zero.
Table 5 presents the estimated intercepts from the regressions as indicators of the risk-adjusted performance of the ASEAN health care IPOs. Considering first the long-run performance of the EW portfolio, the mean intercept for the Fama-French 3-factor model is 0.48% per month (see Table 5, Panel A). This value implies a 3-year abnormal return of 18.81% [ie, calculated as: (1 + 0.0048)36 – 1]. The t statistics of 3.01 indicates that the average monthly return is statistically significant at a 1% level. The same table in Panel B presents the results when the health care IPO portfolios were value-weighted. In this case, they still overperformed by 0.56% (t-stats = 3.30) per month, indicating a positive 3-year excess return of 22.27%. The results of similar regressions for the CAPM and Carhart’s model are also reported in the same table. Notably, the t statistics indicate that the intercept is positively and strongly significant for the Fama-French and Carhart’s regression models. This article can therefore conclude that, based on the calendar-time approach, the ASEAN health care and biopharmaceutical IPO companies during the 3-year period after going public underperformed their benchmarks on a risk-adjusted basis using either EW or VW portfolios. These findings are thus consistent with the long-run health Care and biopharmaceutical IPOs’ performance using the event-time approach.
Calendar-Time Abnormal Returns on ASEAN Health Care and Biopharmaceutical IPO Portfolio Regressions, July 1990-December 2014, Using Weighted Least Squares.

Note. The sample period was July 1990 to December 2014, which consists of 294 months. The maximum number of event companies in the IPO portfolio was 14, which occurred in December 2006. The minimum number of event companies was 6, which occurred in July 1990. This table presents the regression results of the calendar-time monthly market-adjusted abnormal returns using the market model, the Fama and French (1993) 3-factor model, and the Carhart 4-factor model. The t statistics are calculated using the time-series standard deviation of the mean monthly abnormal returns. The statistical significance is generated after making White heteroscedasticity adjustments. The t statistics are shown in brackets. ASEAN = Association of Southeast Asian Nations; IPO = initial public offering; SMB = small minus big; HML = high minus low; CAPM = capital asset pricing model; MOM = momentum factor .
**, and * indicate statistical significance at the 1%, 5%, and 10% levels, respectively.
Conclusions
Overall, this article shows that health care and biopharmaceutical IPOs in ASEAN overperformed in the long-run after going public. We find a different long-term health care IPO price pattern in the ASEAN market data when compared with the long-term IPO underperformance in other industries. Moreover, our findings mostly contrast with the existing US heath care studies. The results show that the fads hypothesis partially explains the underperformance of ASEAN health care IPOs in the long-run. For Singaporean IPOs, the result is similar to the US IPOs in terms of a negative relation between initial returns and 3-year aftermarket abnormal returns. However, when the entire sample was segmented into 5 subgroups, we posit that investors who buy and hold Malaysian and Thai IPOs in the health care and biopharmaceutical sector can gain positive returns in the long-run. It can be seen that this study does not support the impresario hypothesis, if we consider the health care IPOs’ listing in the Thai and Malaysian stock markets. Therefore, our findings concerning the performance of health care IPOs over a long-horizon period may depend on the listed country. For instance, the results from the Singaporean stock market suggest that investors cannot earn any abnormal returns, irrespective of the alternative benchmarks and weighting methods used. In addition, a possible reason for the Thai and Malaysian health care IPOs performing better in the long-run is the longer lock-up (silent) period. The average silent period for strategic shareholders in Thailand and Malaysia is about 1 to 1.5 years, whereas it is 3 to 6 months in the United States and Singapore. The authors expect that investors will sell their IPOs or reduce their share proportion immediately after the lock-up period. Interestingly, once we consider EW and VW returns of health care IPOs separately, we find that small- and medium-sized firms perform better than big-sized firms in the long-run.
The findings from this article may also assist investors in devising active trading strategies, aiming to generate superior returns by investing in new health care IPOs in ASEAN (eg, by buying Malaysian and Thai health care IPOs in the initial aftermarket period and holding them for a long-term period, instead of short-selling Singaporean health care IPOs when they are already listed on the market). In addition, the findings imply that any new issuers may benefit from our findings about IPO underperformance being due to the lower cost of equity when going public. Finally, the results presented in our article may have broader policy implications for many other emerging markets similar to the countries in ASEAN, which are expanding globally by implementing economic, trade, and financial reforms. The findings may therefore also be useful for regulators overseeing other emerging markets beyond ASEAN countries.
Footnotes
Acknowledgements
The authors thank the Editor, Umair Shafique; the Managing Editor, Dennis Palkon; and anonymous referees for their helpful comments and suggestions for improving the overall quality of this article.
Declaration of Conflicting Interests
The author(s) declared no potential conflicts of interest with respect to the research, authorship, and/or publication of this article.
Funding
The author(s) received no financial support for the research, authorship, and/or publication of this article.