
Abstract
The purpose of this article is to explore differences in the socioeconomic, demographic characteristics of older adults in the United States with respect to their use of different types of dental care services. The 2008 Health and Retirement Study (HRS) collected information about patterns of dental care use and oral health from individuals aged 55 years and older in the United States. We analyze these data and explore patterns of service use by key characteristics before modeling the relationship between service use type and those characteristics. The most commonly used service category was fillings, inlays, or bonding, reported by 43.6% of those with any utilization. Just over one third of those with any utilization reported a visit for a crown, implant, or prosthesis, and one quarter reported a gum treatment or tooth extraction. The strongest consistent predictors of use type are denture, dentate, and oral health status along with dental insurance coverage and wealth. Our results provide insights into the need for public policies to address inequalities in access to dental services among an older US population. Our findings show that lower income, less wealthy elderly with poor oral health are more likely to not use any dental services rather than using only preventive dental care, and that cost prevents most non-users who say they need dental care from going to the dentist. These results suggest a serious access problem and one that ultimately produces even worse oral health and expensive major procedures for this population in the future.
Introduction
As longevity increases and the Baby Boom generation ages, there will be a dramatic shift in health care use among the population in the United States. Although the effect of this population shift has been explored for the use of other forms of medical care, less is known about what might be expected for dental care utilization. Understanding the predictors of the types of services sought by older adults could help practitioners better target their outreach and best serve the growing elderly patient base. From a policy perspective, it can also provide insights into characteristics of older Americans who are not able to obtain more expensive restorative, surgical, and prosthetic dental services required to maintain good oral health and their permanent teeth.
The proportion of older adults using any dental care in a given year generally approximates that of the full population (43% vs 44%), but some recent estimates suggest that among the elderly, dental care use rates may be increasing.1-3 Moreover, far fewer Americans face the prospect of being edentulous than in the past, with the 2000 “Oral Health in America: A Report of the Surgeon General” noting that “about 30 percent of adults 65 years and older are edentulous, compared to 46 percent 20 years ago.” Provided this trend continues, it is likely that as older adults retain their teeth, they will also experience a growing need for dental care. 4 Indeed, recent projections show the share of dental expenditures for those 60 years and older increasing from 25% in 2010 to 38% by 2040 reflecting both the aging of the population and the higher cost per visit and frequency of visits by the elderly. 5
For retired adults, paying for dental care can be challenging. At the time of retirement, many workers not only experience a dramatic drop in income but the loss of employer-sponsored health benefits as well. 6 Medicare, which provides health insurance coverage to virtually all Americans aged 65 and older for medical care, does not cover dental care. 7 Among older Americans above age 50, approximately 58% of those who are working had coverage in 2006, compared with slightly less than 38% of those who were retired, with a declining likelihood of coverage with age.3,8-10 Faced with fixed incomes and lacking dental insurance benefits, it is reasonable to speculate that though older Americans may not forgo dental care altogether, they may ration the services they receive once they decide to visit a dental provider.
For the entire US population, the typical visit to the dentist has shifted over the past 60 years or so from disease-based practice (exams, prophylaxis, amalgams, and occasional extractions) to more routine check-ups and oral health maintenance (restorations and specialty-type prosthodontics, endodontic, periodontics, orthodontic, and oral surgery procedures). 11 Similarly among Americans 65 and older receiving care in 2009, slightly more than 80% received at least 1 diagnostic procedure (examination or X-ray) whereas 74% had at least 1 preventive procedure (cleaning, fluoride, or sealant) during the year. 12 More costly treatments were relatively less common: About 22%, 25%, and 11% received at least 1 restorative, prosthetic, or oral surgery procedure, respectively, in the same year. An upward trend in the percentage receiving preventive, diagnostic care and a downward trend in receiving other dental services was also discovered between 1999 and 2009. 12
Recent research has investigated the characteristics of non-elderly individuals receiving preventive and basic and major restorative services, but a gap exists in determining how these services have been allocated across different populations of older adults. 13 Our study seeks to further explore the types of dental care that older adults in the United States receive by focusing on the characteristics of those receiving no dental care, those receiving major (restorative, surgical, or prosthetic) services, and those receiving only non-major services. We hypothesize that financial factors will serve as barriers to accessing expensive restorative and specialty dental services by older Americans and may even discourage use of critical preventive services.
Data and Methods
The Health and Retirement Study (HRS) is a nationally representative, biennial survey of non-institutionalized individuals aged 51 and older in the United States. It is fielded by the University of Michigan with primary funding from the National Institute of Aging. The initial sample of respondents was first surveyed in 1992, with the sample replenished in 1998, 2004, and 2010 to account for the aging of the sample. Given this scheme, in 2008, the HRS was representative of the population 55 and older.14-15
For the 2008 wave of the HRS, we helped develop an experimental module designed to collect more detailed information about dental utilization and insurance status than was available in the core HRS survey, which contained relatively few detailed questions related to dental care. Specifically, dental utilization in the core survey focused on self-reports of any use in the 2 years prior to the HRS interview (or since the last interview in 2006). Dental insurance in the core survey for dental users was based on whether insurance at least partially covered expenses or for non-users, would have covered any costs if the person had needed to see a dentist. Extrapolation of the source of such coverage was based on reported health insurance coverage. In the supplement, persons not reporting any coverage in the core were asked directly if they have dental insurance and if not, why not. Those reporting coverage in the core were asked for the source of the coverage. To limit respondent burden, we were limited to approximately 2 to 3 minutes of questions and thus were not able to cover all relevant content. All other explanatory variables in our study were based on data collected in the core questionnaire of the HRS
Just under 10% of HRS respondents (1246 of 14 970) were included in the dental module. An analysis of the sample of module respondents on key characteristics confirmed that module assignment is random across respondents to the full HRS; we could not reject the hypothesis that the groups were statistically the same (results available on request). For this reason, we infer that statistics from the module are also nationally representative. Because the module only included a portion of HRS respondents, however, the weighted sample does not weight to the full elderly population, but approximately one tenth of the elderly adult population in the United States (a total weighted sample size of 6 187 623).
The module asked a series of questions to respondents based on whether they reported having dental use since the previous HRS survey approximately 2 years earlier. These questions are outlined in Figure 1 and discussed in the next section. For those who did not use services, respondents were asked reasons for non-use. Among those who reported using dental care, a series of questions sought to learn more about the types of services that were used.
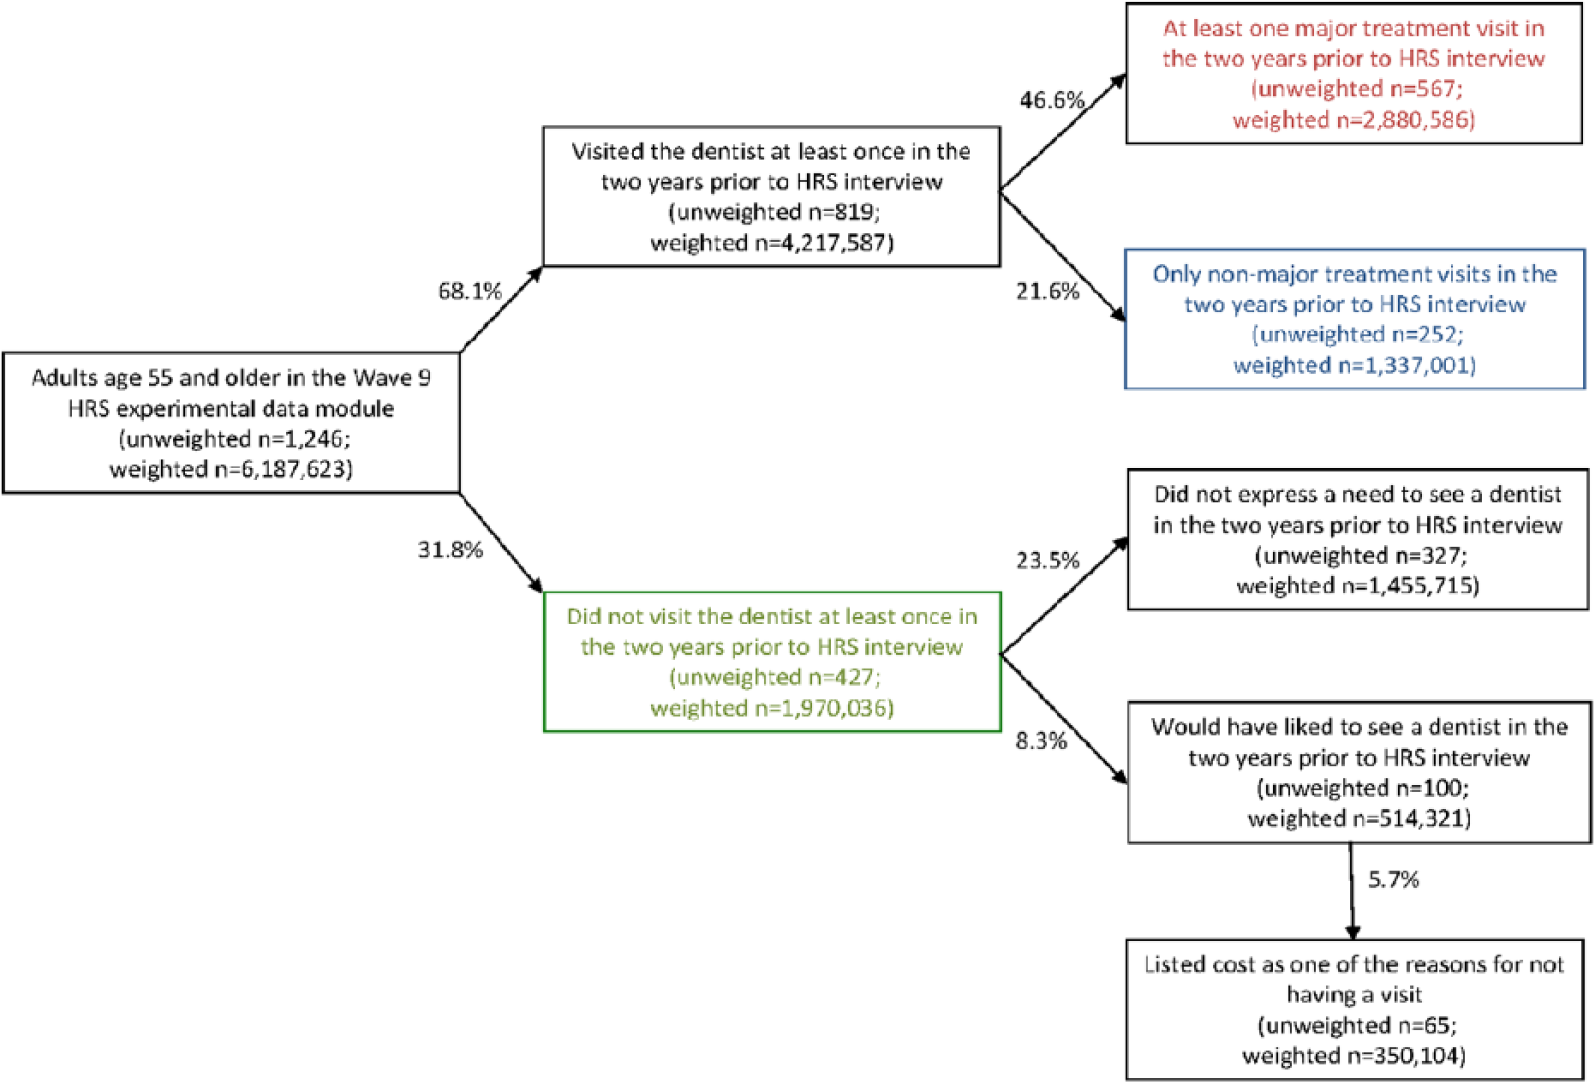
Dental utilization pathways among older adults aged 51 and older, 2008 HRS dental module.
The module collected detailed information from respondents about the dependent variables in our study: the types of services used in the time since the previous HRS interview, which typically is about 2 years. Because of the lengthy recall period and time constraints, only data on major restorative, surgical, and prosthetic dental services were collected in the module. These included fillings, crowns, root canals, dentures, inlays, orthodontics, gum treatments, implants, bondings, bridges, oral surgeries, and extractions. Older persons with dental use but not receiving any major services are assumed to have only received diagnostic, preventive services such as X-rays, exams, cleanings, fluoride treatments, and sealants. We were thus unable to know the proportion of users of major services who had one or more preventive, diagnostic visits.
With this limitation in mind, we categorized utilization into three types: (1) no visits, (2) 1 or more major visits, and (3) only 1 or more non-major visits.
Using this 3-way categorization of dental utilization, we assessed factors associated with higher proportionate use of 1 category of use over another. We did this descriptively in a bivariate context as well as using a multinomial logistic model. Whereas bivariate information is purely descriptive and does not account for correlations across predictors, the multinomial logistic model formalizes the relationship while holding other factors constant. The multinomial logistic analysis models the relationship between individual predictors and the likelihood of 1 of the 3 outcomes described in the preceding paragraph. In each case, the outcome of interest is modeled relative to a reference group. For example, we consider the effect of predictors on at least 1 major treatment visit relative to no visit at all (group 2 relative to group 1 above), on only non-major visits to no visits (group 3 relative to group 1), and on only non-major visits relative to having at least 1 major visit (group 3 relative to group 2). Our findings report odds ratio for use by each group relative to a reference category. An odds ratio greater than 1.0 indicates that the group had a higher likelihood of the type of use noted than the reference group; an odds ratio less than 1 indicates lower usage of the noted type by the group relative to the reference.
All characteristics that were used as stratifiers were defined based on data collected in wave 9 of the HRS, the same wave as the experimental data module was fielded. Although the majority of these characteristics (age, gender, education level) are defined in standard ways, a few benefit from an additional description. Income in the HRS is self-reported across numerous possible sources, and then aggregated into a single measure of household income. Using this measure, we defined income groups. “Lower, middle, and highest income groups” are defined as persons living in households with incomes less than 200%, between 200% and 400%, and above 400% of the poverty threshold, respectively. Similar to income, the HRS collects detailed wealth information from respondents across sources before aggregating into a single measure of household wealth. “Lower, middle, and highest wealth groups” are defined as persons living in households with wealth below the fourth decile, between the fourth and sixth deciles, and above the sixth decile, respectively. “Not retired” are persons in the labor force. We categorized individuals based on their reported retirement status in waves 8 and 9 of the HRS. “Retired” are persons either fully or partly retired. “Other” retirement status refers to persons not in the labor force and not retired. “Always” retirement change refers to persons fully or partly retired in both waves. “Entered” retirement change refers to persons entering full or partial retirement between waves. “Never” retirement change refers to persons in the labor force in both waves. “Other” retirement change refers to persons either entering the labor force between waves; entering not retired, not in the labor force between waves; or not retired, not in the labor force in both waves. We defined transitions in dental insurance in a similar way, using information collected in waves 8 and 9 of the HRS. “Never” coverage change is defined as persons without dental coverage in both waves. “Intermittent” coverage change is defined as persons either gaining or losing dental coverage between waves. “Always” coverage change is defined as persons with dental coverage in both waves.
All analysis was conducted using SAS Version 9.3.1, and all results take into account the complex sampling design of the HRS. 16
Results
Reasons Older Adults Give for Not Using Dental Care
Among module respondents, 68.1% reported using dental care in the previous 2 years and 31.8% did not report use (Figure 1). (All reported percentages use HRS respondent-level sampling weights from 2008.) Respondents who did not use services (the lower branch of Figure 1) were asked if they would have liked to have done so. Only about one quarter of respondents said that this was the case (8.3% of the 31.8% overall without use); the remainder did not indicate that they had desired a visit. Those who reported that they would have liked to visit were then asked reasons why they did not go; these reasons were not mutually exclusive. The most common reason given was cost: About two thirds of the 8.3%, or 5.7% of the module sample respondents, reported this as a factor.
Distribution of Dental Utilization, by Service Type
Among those reporting any dental utilization in the previous 2 years (upper branch of Figure 1), two thirds reported using at least 1 major restorative, surgical, or prosthetic dental service (46.6% of all module respondents). The remaining one third reported utilization but did not indicate using any of the major services.
Figure 2 shows the frequency with which specific, major services were used by respondents; all percentages shown are among the 4 217 587 weighted respondents who reported any utilization. Because of the low frequency of use for some of the major services, we aggregated in several instances. The most commonly used major service category was fillings, inlays, or bonding, reported by 43.6% of those with any utilization. Just over one third (34.8%) of those with any utilization reported a visit for a crown, implant, or prosthesis, and one quarter (25.5%) reported a gum treatment or tooth extraction. Fewer than 1 in 5 respondents reported a visit for a root canal or dentures.

Rates of service use by respondents reporting dental care utilization from 2006 to 2008 using service category.
Predictors of the Type of Dental Utilization
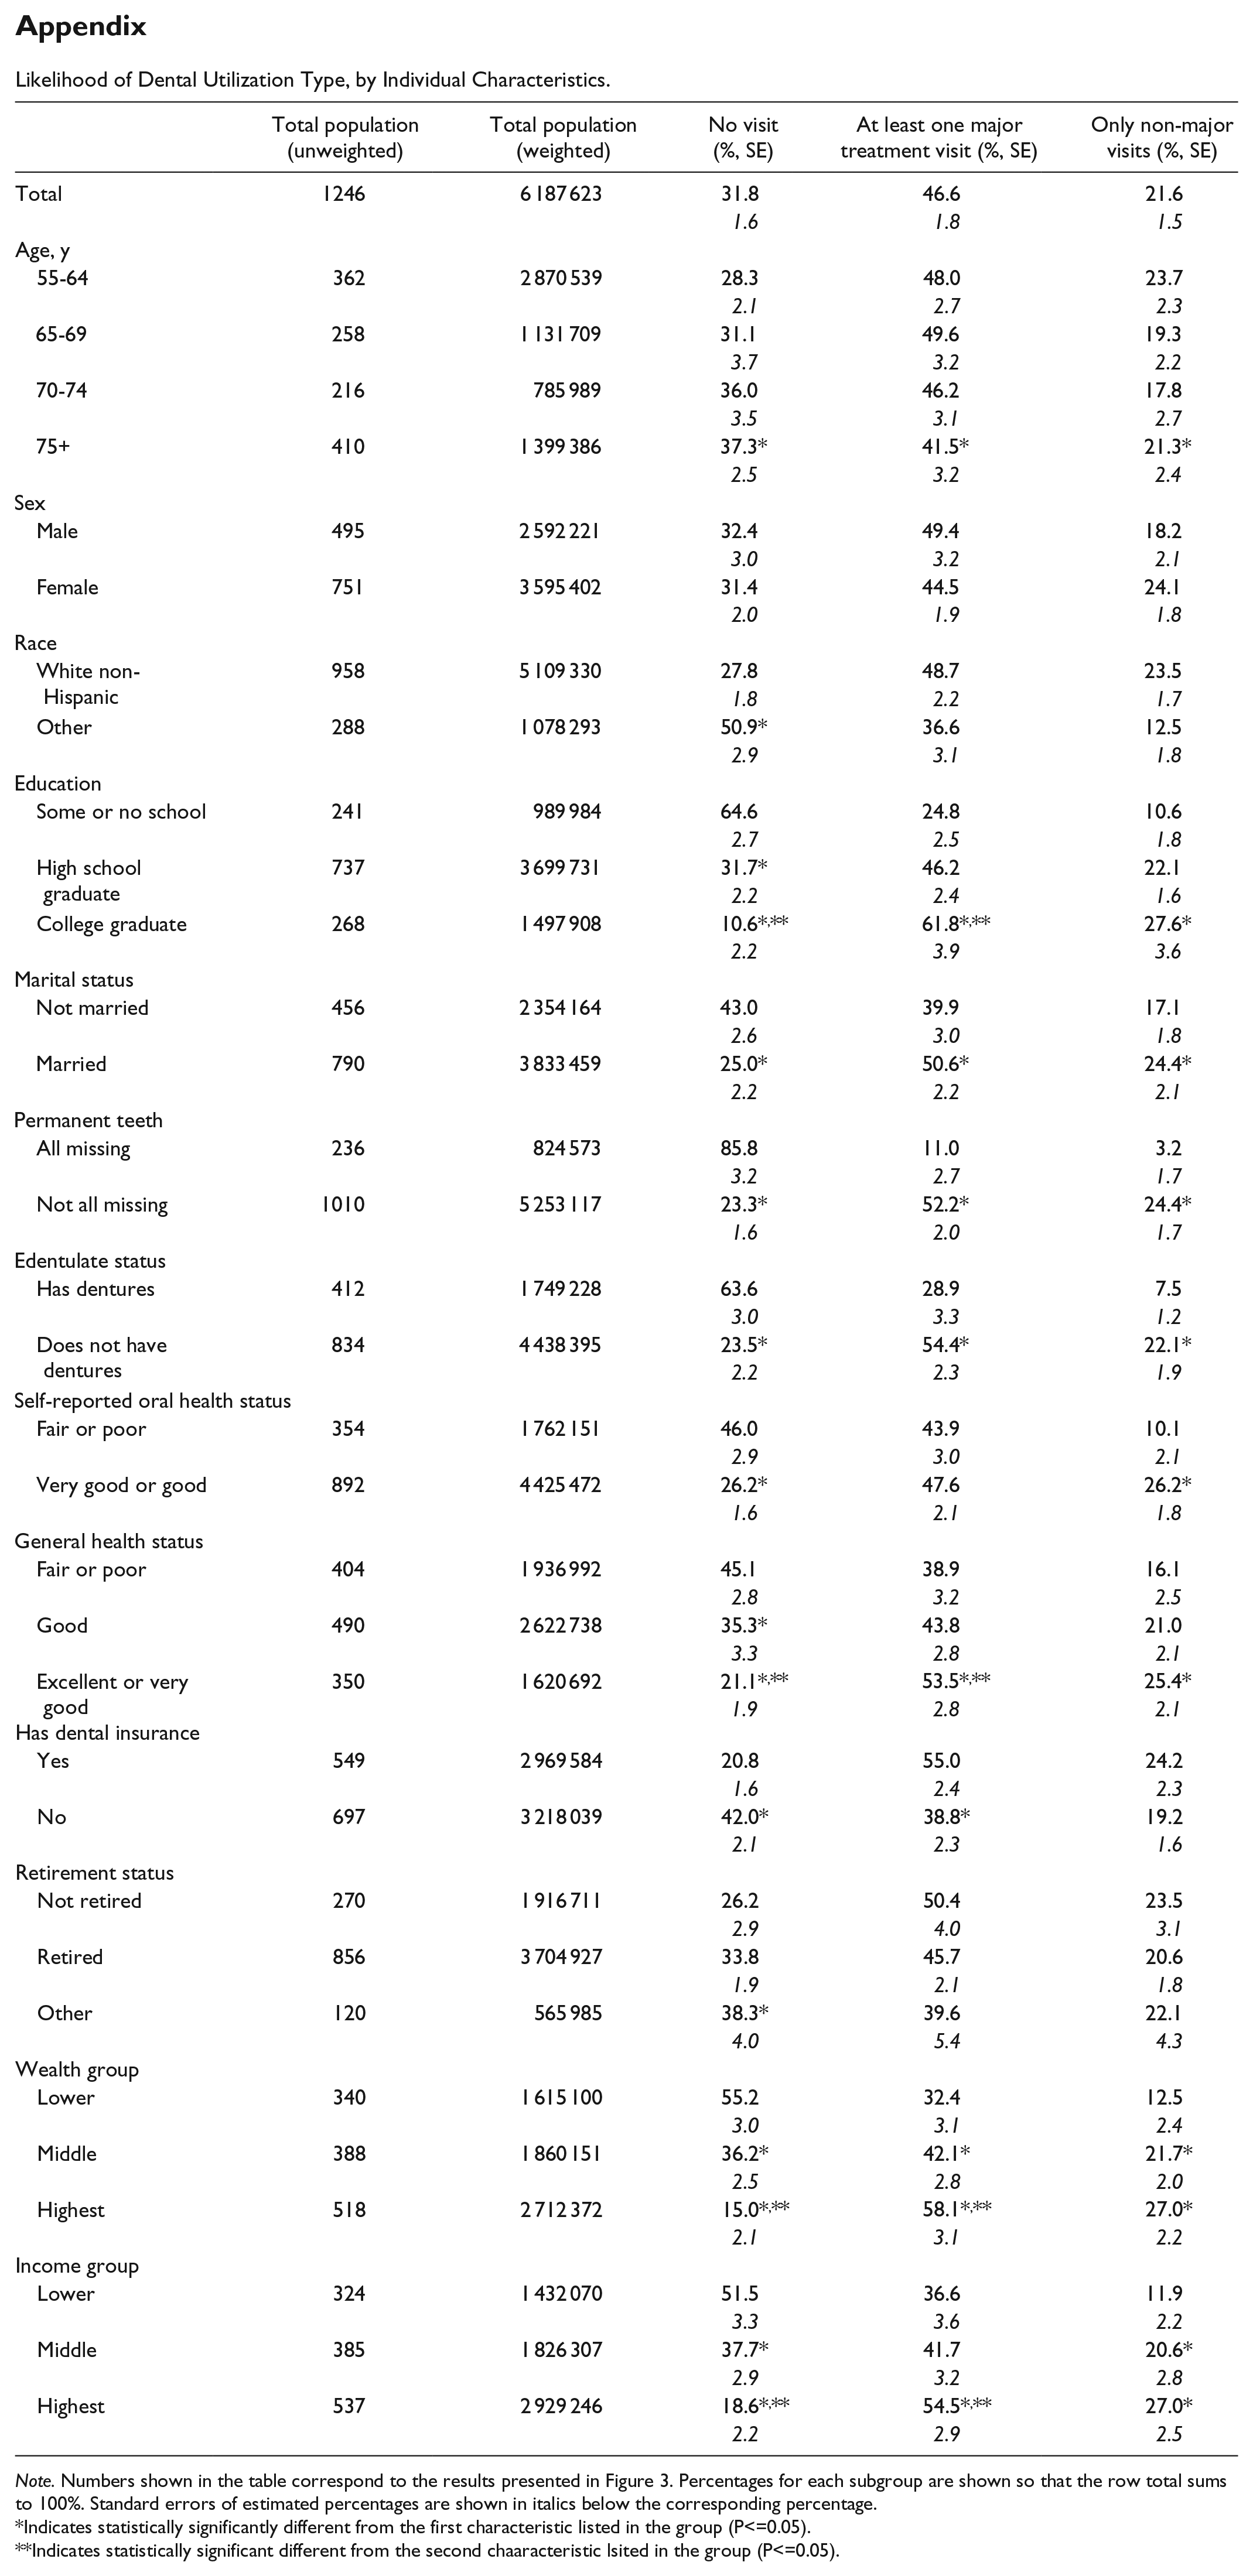
Overall, 31.8% of weighted module respondents reported no dental utilization in the previous 2 years, whereas 46.6% reported having at least 1 major service and an additional 21.6% reported utilization but not any of the major service types. These proportions varied widely based on the subgroup of respondents considered, as reported in Figure 3.

Distribution of dental utilization from 2006 to 2008, by selected individual characteristics.
Relative to the overall distribution of utilization in the population, individuals who were non-white (black, Hispanic, or other) were significantly more likely to report no use at all with relatively few with utilization in the non-major category only. There was a large gradient in education, with those who had less than a high school education having a much higher likelihood of no use and lower likelihood of non-major use. Those with a college degree were significantly less likely to have no use with a much higher proportion reporting at least 1 major dental procedure.
Both general and oral health status were strongly related to utilization patterns, with those missing all teeth and those with dentures much less likely to report use and less likely to report only use in the non-major category. There was also a gradient in both oral and general health status, with those reporting better health much more likely to report any use at all.
Socioeconomic status was associated with utilization patterns. Having dental insurance and being continuously covered made individuals more likely to have any use at all, and also increased the likelihood of reporting use of a major type. Retirement status and one’s change in retirement seemed to have relatively little influence on utilization patterns. Finally, those with higher wealth and those with higher income relative to others in the module were less likely to report no use. In addition, individuals in these groups were more likely to report use of at least 1 major service relative to only non-major ones, compared with those having lower wealth or income.
Of course, the results shown in Figure 3 are bivariate and many factors are correlated with each other (eg, those with the highest income and wealth are often those with the highest education levels). To account for this, we considered a multinomial logistic model that explored the predictors of utilization type, holding constant all other factors. The results from this model are presented in Table 1; each column compares the likelihood of a certain category of use relative with another. For example, the first column shows the relationship between individual predictors and the likelihood of having at least 1 major treatment visit relative to no visit at all. The second column compares the likelihood of having only non-major visits to no visits, whereas the third column considers only the likelihood of having only non-major treatment visits relative to having at least 1 major treatment visit, or the likelihood of use type among those reporting use.
Adjusted ORs From Multinomial Logistic Regressions Comparing Participant Variables of Interest, by Dental Utilization Category.

Note. Several other estimates were significant at the 10% level but did not attain significance at these levels. All characteristics were measured during wave 9 of the Health and Retirement Study, which was primarily collected in 2008. OR = odds ratio; CI = confidence interval.
P < .05. **P < .01. ***P < .001.
Taking the results across these models together, what emerges is that the strongest consistent predictors of the categories of use type are missing teeth, dentate status, and oral health status along with dental insurance coverage and wealth category. That these measures of oral health are correlated with category of use type is not surprising, as individuals lacking teeth or with dentures will have a quite different motivation for seeking dental care at all and a service profile on use.
The findings for oral health suggest those in worse oral health are less likely to have only non-major dental visits than no visits at all, relative to those in better oral health. They are also less likely to have only non-major visits relative to those with at least 1 major visit. Together, these findings may imply that those in worse oral health are less likely to seek regular care solely for prevention and diagnosis, and when they do seek care, require more than preventive services.
Having dental insurance significantly increases the likelihood of either at least 1 dental visit regardless of type category, relative to no visit at all, compared with those without dental insurance. Higher wealth is also strongly predictive of also having at least 1 dental visit regardless of type relative to no visit at all. Neither dental insurance nor wealth status has an important relationship with having at least 1 major dental visit versus having only non-major dental care.
In fact, other than being in fair or poor oral health, nothing emerges as a strong predictor of using major dental treatments versus using only non-major dental care. Being in fair or poor oral health makes it less likely that individuals will have only non-major visits relative to receiving at least 1 major dental procedure.
Discussion
About 1 in 3 (31.8%) adults aged 55 and older did not see a dentist in the previous 2 years, but the majority of those reported that they did not need to see a dentist. Yet, about two thirds of those who said they would have liked to see a dentist reported that cost was a factor for not seeking care.
Among the majority who did see a dentist in the previous 2 years, there was wide variation by subgroup in the likelihood of seeking care and in the distribution of use by receiving at least 1 major dental treatment and by receiving only non-major preventive and diagnostic services. Financial-type predictors such as wealth status and having dental insurance affected the decision to have a visit at all, but mattered little in the category of service used. In fact, in a multiple variable framework, relatively few predictors were associated with a higher likelihood of having at least one major treatment visit versus only non-major treatment visits. One exception to that is being in fair or poor oral health, which was associated with a higher likelihood of using at least 1 major service relative to only non-major ones. So it appears that once a person in poor oral health gains the coverage or has the income or wealth required to make an initial dental appointment, there no longer appear to be any barriers to acquiring more expensive non-preventive care that may be needed.
The visits accounted for in the “only non-major” category presumably contain far less expensive preventive and diagnostic dental services than many or all of what we classify as types of major dental visits. Hence, these results may provide us with some comfort because they suggest that after making the decision to seek care, it does not appear that individual characteristics—including insurance status or ability to pay out-of-pocket (through wealth)—are influencing the type of treatment pursued. It would appear instead that dental professionals are determining the proper course of treatment and individuals are following the recommendation.
Taken together, these findings suggest that financial considerations are most important for older adults in deciding whether to seek care, but may be less important in deciding the proper course of treatment. This would suggest that practitioners could potentially best serve their older patients by reaching out and encouraging appropriate and regular use of preventive care and may be able to worry less about “scaring off” patients with the suggestion of costly procedures. This also suggests that in addition, there may be a need for subsidized public coverage for low-income, less wealthy elderly to give them the incentive to make that initial appointment.
It is important to note, though, that our findings can only be taken as suggestive, for a couple of reasons. First, we are only able to measure associations and cannot infer causality from any of our findings. That is, we do not know that wealth is causing differential use, but rather that those who are wealthy have different patterns of use than those who are not, potentially for reasons not directly related to wealth (eg, patience or the ability to plan ahead). Second, we were unable to identify how many older persons receiving major dental services also had preventive care because of the limited way the type of service data were collected in the dental module. Knowing this would have allowed us to more closely examine the substitution and complementarity between prevention and other types of dental use.
Conclusion
We had expected financial factors to limit access to major and preventive dental services among an older American population. Our results instead show that lack of dental insurance and low income and wealth only tend to discourage these individuals from making an initial visit to the dentist. These factors do not appear to play a role in keeping patients from following their dentist’s recommendation for necessary restorative, oral surgery, or other specialty services. Our results provide insights into the need for public policies to address inequalities in initial access to dental services among an older US population. The findings that uncovered, lower income, less wealthy elderly with poor oral health are more likely to not use dental services rather than have only non-major dental care, and that cost prevents most non-users who say they need dental care from going to the dentist, suggest a serious access problem and one that portends even worse oral health and potentially expensive major dental procedures for this population in the future. Our findings should at least contribute to a needed debate considering, at a minimum, mandating and subsidizing coverage for cleanings, X-rays, and exams for the low-income elderly as a potentially cost-effective public policy.
Footnotes
Appendix
Likelihood of Dental Utilization Type, by Individual Characteristics.
| Total population |
Total population |
No visit |
At least one major treatment visit (%, SE) | Only non-major visits (%, SE) | |
|---|---|---|---|---|---|
| Total | 1246 | 6 187 623 | 31.8 | 46.6 | 21.6 |
| 1.6 | 1.8 | 1.5 | |||
| Age, y | |||||
| 55-64 | 362 | 2 870 539 | 28.3 | 48.0 | 23.7 |
| 2.1 | 2.7 | 2.3 | |||
| 65-69 | 258 | 1 131 709 | 31.1 | 49.6 | 19.3 |
| 3.7 | 3.2 | 2.2 | |||
| 70-74 | 216 | 785 989 | 36.0 | 46.2 | 17.8 |
| 3.5 | 3.1 | 2.7 | |||
| 75+ | 410 | 1 399 386 | 37.3* | 41.5* | 21.3* |
| 2.5 | 3.2 | 2.4 | |||
| Sex | |||||
| Male | 495 | 2 592 221 | 32.4 | 49.4 | 18.2 |
| 3.0 | 3.2 | 2.1 | |||
| Female | 751 | 3 595 402 | 31.4 | 44.5 | 24.1 |
| 2.0 | 1.9 | 1.8 | |||
| Race | |||||
| White non-Hispanic | 958 | 5 109 330 | 27.8 | 48.7 | 23.5 |
| 1.8 | 2.2 | 1.7 | |||
| Other | 288 | 1 078 293 | 50.9* | 36.6 | 12.5 |
| 2.9 | 3.1 | 1.8 | |||
| Education | |||||
| Some or no school | 241 | 989 984 | 64.6 | 24.8 | 10.6 |
| 2.7 | 2.5 | 1.8 | |||
| High school graduate | 737 | 3 699 731 | 31.7* | 46.2 | 22.1 |
| 2.2 | 2.4 | 1.6 | |||
| College graduate | 268 | 1 497 908 | 10.6*,** | 61.8*,** | 27.6* |
| 2.2 | 3.9 | 3.6 | |||
| Marital status | |||||
| Not married | 456 | 2 354 164 | 43.0 | 39.9 | 17.1 |
| 2.6 | 3.0 | 1.8 | |||
| Married | 790 | 3 833 459 | 25.0* | 50.6* | 24.4* |
| 2.2 | 2.2 | 2.1 | |||
| Permanent teeth | |||||
| All missing | 236 | 824 573 | 85.8 | 11.0 | 3.2 |
| 3.2 | 2.7 | 1.7 | |||
| Not all missing | 1010 | 5 253 117 | 23.3* | 52.2* | 24.4* |
| 1.6 | 2.0 | 1.7 | |||
| Edentulate status | |||||
| Has dentures | 412 | 1 749 228 | 63.6 | 28.9 | 7.5 |
| 3.0 | 3.3 | 1.2 | |||
| Does not have dentures | 834 | 4 438 395 | 23.5* | 54.4* | 22.1* |
| 2.2 | 2.3 | 1.9 | |||
| Self-reported oral health status | |||||
| Fair or poor | 354 | 1 762 151 | 46.0 | 43.9 | 10.1 |
| 2.9 | 3.0 | 2.1 | |||
| Very good or good | 892 | 4 425 472 | 26.2* | 47.6 | 26.2* |
| 1.6 | 2.1 | 1.8 | |||
| General health status | |||||
| Fair or poor | 404 | 1 936 992 | 45.1 | 38.9 | 16.1 |
| 2.8 | 3.2 | 2.5 | |||
| Good | 490 | 2 622 738 | 35.3* | 43.8 | 21.0 |
| 3.3 | 2.8 | 2.1 | |||
| Excellent or very good | 350 | 1 620 692 | 21.1*,** | 53.5*,** | 25.4* |
| 1.9 | 2.8 | 2.1 | |||
| Has dental insurance | |||||
| Yes | 549 | 2 969 584 | 20.8 | 55.0 | 24.2 |
| 1.6 | 2.4 | 2.3 | |||
| No | 697 | 3 218 039 | 42.0* | 38.8* | 19.2 |
| 2.1 | 2.3 | 1.6 | |||
| Retirement status | |||||
| Not retired | 270 | 1 916 711 | 26.2 | 50.4 | 23.5 |
| 2.9 | 4.0 | 3.1 | |||
| Retired | 856 | 3 704 927 | 33.8 | 45.7 | 20.6 |
| 1.9 | 2.1 | 1.8 | |||
| Other | 120 | 565 985 | 38.3* | 39.6 | 22.1 |
| 4.0 | 5.4 | 4.3 | |||
| Wealth group | |||||
| Lower | 340 | 1 615 100 | 55.2 | 32.4 | 12.5 |
| 3.0 | 3.1 | 2.4 | |||
| Middle | 388 | 1 860 151 | 36.2* | 42.1* | 21.7* |
| 2.5 | 2.8 | 2.0 | |||
| Highest | 518 | 2 712 372 | 15.0*,** | 58.1*,** | 27.0* |
| 2.1 | 3.1 | 2.2 | |||
| Income group | |||||
| Lower | 324 | 1 432 070 | 51.5 | 36.6 | 11.9 |
| 3.3 | 3.6 | 2.2 | |||
| Middle | 385 | 1 826 307 | 37.7* | 41.7 | 20.6* |
| 2.9 | 3.2 | 2.8 | |||
| Highest | 537 | 2 929 246 | 18.6*,** | 54.5*,** | 27.0* |
| 2.2 | 2.9 | 2.5 | |||
Note. Numbers shown in the table correspond to the results presented in Figure 3. Percentages for each subgroup are shown so that the row total sums to 100%. Standard errors of estimated percentages are shown in italics below the corresponding percentage.
Indicates statistically significantly different from the first characteristic listed in the group (P<=0.05).
Indicates statistically significant different from the second chaaracteristic lsited in the group (P<=0.05).
Declaration of Conflicting Interests
The author(s) declared no potential conflicts of interest with respect to the research, authorship, and/or publication of this article.
Funding
The author(s) disclosed receipt of the following financial support for the research, authorship, and/or publication of this article: This investigation (Dental Coverage Transitions, Utilization and Retirement) was supported by the National Institute of Dental & Craniofacial Research (R01DE021678) of the National Institutes of Health. The Health and Retirement Study is sponsored by the National Institute of Aging (grant NIA U01AG009740) and is conducted by the University of Michigan.