
Abstract
This study examines the patterns of length of stay (LOS) and inpatient costs for both Medicaid managed care and nonmanaged care patients using data from Medicaid patients aged 18 to 64 years who were discharged from hospitals in Florida between 2006 and 2012. This study used pooled cross-sectional multilevel modeling. The results show that the type of Medicaid program in which patients were enrolled was significantly related to the hospital LOS and inpatient costs. Medicaid managed care patients had 7% shorter LOSs and a 1.9% lower inpatient cost than did Medicaid fee-for-service (FFS) patients. Medicaid managed care patients had shorter LOSs in the Medicaid managed care market with high competition. High managed care penetration generates a cost-decreasing spillover to Medicaid FFS patients.
Introduction
Several scholars have paid attention to the differences in lengths of stay (LOSs) and inpatient costs of patients who are insured under managed care or nonmanaged care plans. However, the results of previous studies were inconsistent.1-5
Despite the growing interest in Medicaid managed care in Florida, only a few studies have examined the impact of the managed care program on LOS and inpatient costs for Florida’s Medicaid enrollees.6,7 Furthermore, the literature on the impact of Medicaid managed care in the context of different market structures is scarce. 8 It is still unclear whether and how market-level factors affect LOS and inpatient costs for Medicaid beneficiaries. Furthermore, to my understanding, multilevel modeling has not been applied much in health care studies.
Therefore, this study attempts to fill the gap in the previous literature in 3 ways: First, this study analyzes Medicaid managed care program in Florida. Second, this study analyzes how the market competition and competitive influence of Medicaid managed care penetration differently affect LOS and inpatient costs between Medicaid managed care and Medicaid fee-for-service (FFS) patients. Third, using hierarchical linear modeling (HLM), this study provides more precision in estimating the effects of Medicaid managed care plans and market structure variables on LOS and inpatient costs.
Methods
This study addresses the following research questions:
The databases consisted of the following files: (1) the Florida Agency for Health Care Administration (AHCA) hospital inpatient discharge data file, (2) the Florida Medicaid managed care enrollment report, (3) the hospital Medicare cost report from the Center for Medicare and Medicaid Services (CMS), (4) the CMS inpatient prospective payment system impact file, (5) the Florida Statistical Abstract, and (6) the Urban Influence Code from the US Department of Agriculture.
The study population was comprised of all Medicaid patients aged 18 to 64 years who were discharged from short-term general hospitals in Florida from January 1, 2006, to December 31, 2012. The total study population at the patient level was 1 957 072 over all periods. The number of patients observed in the population varied across analysis models because of different missing patterns and sample extraction strategies. Then, the size of the sample was 684 267 patients in the LOS model and 1 368 146 patients in the inpatient costs model. This study examined 902 short-term general hospitals between 2006 and 2012. The panel data of the hospitals were unbalanced. For example, this study included 148 hospitals in 2006, but 137 hospitals were included in the analyses in 2012. This was because of missing data from Medicare Cost Reports, hospital closings, and mergers over the study period.
The 2 dependent variables used were LOS and total inpatient costs. A hospital-specific cost-to-charge ratio was used to convert total inpatient charges to costs by multiplying the ratio by each patient charge. Total inpatient costs were adjusted for inflation to 2010 dollars. This study included the insurance type of the Medicaid patients as a main independent variable. The insurance type of the Medicaid patients was a dichotomous variable (1 = Medicaid managed care, 0 = Medicaid FFS). At the patient level, the study controlled patients’ demographic characteristics, such as gender, race, and age. Also, the total number of secondary diagnosis (TOD) and diagnosis-related group (DRG) weight were controlled.
At the hospital level, this study included the level of hospital competition. After the mid-1980s, empirical studies reported that increased hospital competition leads to lowered hospital costs and prices.9-12 Unlike previous studies that adopted a largely arbitrary definition of the hospital market based on geopolitical units or fixed distance, this study identified a service-specific market for each hospital. 11 To calculate hospital competition, this study followed the two-step calculation by Zwanziger and Melnick 11 and provided the Herfindahl-Hirschman Index (HHI) for individual hospitals. To measure HHI for each hospital, the first step was to calculate HHI for each ZIP code area in the state during each year period. Then this study determined the weighted average of the HHIs of each ZIP code from which a hospital received patients. A higher HHI value indicated a highly concentrated market.
This study also controlled hospitals’ organizational characteristics, such as ownership, teaching status, total number of beds, and average bed occupancy rates. In addition, this study adjusted analytical models for a labor market’s area wage index value, hospitals’ Medicaid patient volumes, and case-mix indices (CMIs). Different CMIs by payer indicated different reimbursement levels among payers. For example, a higher reimbursement rate (ie, high CMI) from private insurers makes Medicaid patients less attractive to hospitals. To capture the different reimbursement rates between commercial insurers and Medicaid, we calculated the difference in payer-specific CMIs between 2 payers by subtracting Medicaid CMI from private insurer CMI.
At the county level, the study used 2 measures of Medicaid managed care market structure: Medicaid managed care penetration rates and the HHI of Medicaid MCOs. The HHI of Medicaid MCOs took into account the different market shares of each firm competing in the county. The HHI was calculated by summing the square of each Medicaid MCO’s market share. Other county-level control variables included rurality, total number of Medicaid recipients, and total number of Medicaid admissions.
All models involved hierarchical data structures, and study data were pooled cross-sectional data over time. To find appropriate estimation approaches for each dependent variable, dependent variables were examined as a first step. First, hospital LOS was measured in days, and it was positively skewed, so linear modeling was not appropriate because the residual errors did not follow a normal distribution. This study used Poisson regression to analyze LOS. Second, as inpatient cost was a nonnegative dependent variable skewed by rare but extreme high-cost cases, the HLM model for inpatient costs in raw scale violated the assumption of normality. Thus, this study transformed the total inpatient costs by the logarithm function.
This study applied 2-level (ie, patient-hospital) hierarchical models to estimate dependent variables. Due to low average cluster size at level 3 (ie, county) and small variance between level 3 units, this study used 2-level hierarchical models. Therefore, the county-level variables were disaggregated to the hospital level. All statistical analyses were conducted at a set a priori level of significance (.05).
Results
Table 1 provides the descriptive statistics for the variables used in the analyses over all cross-sections and periods. The average LOS for Medicaid patients was 4.7 days. The average cost of inpatient care was US$7036.
Descriptive Statistics.
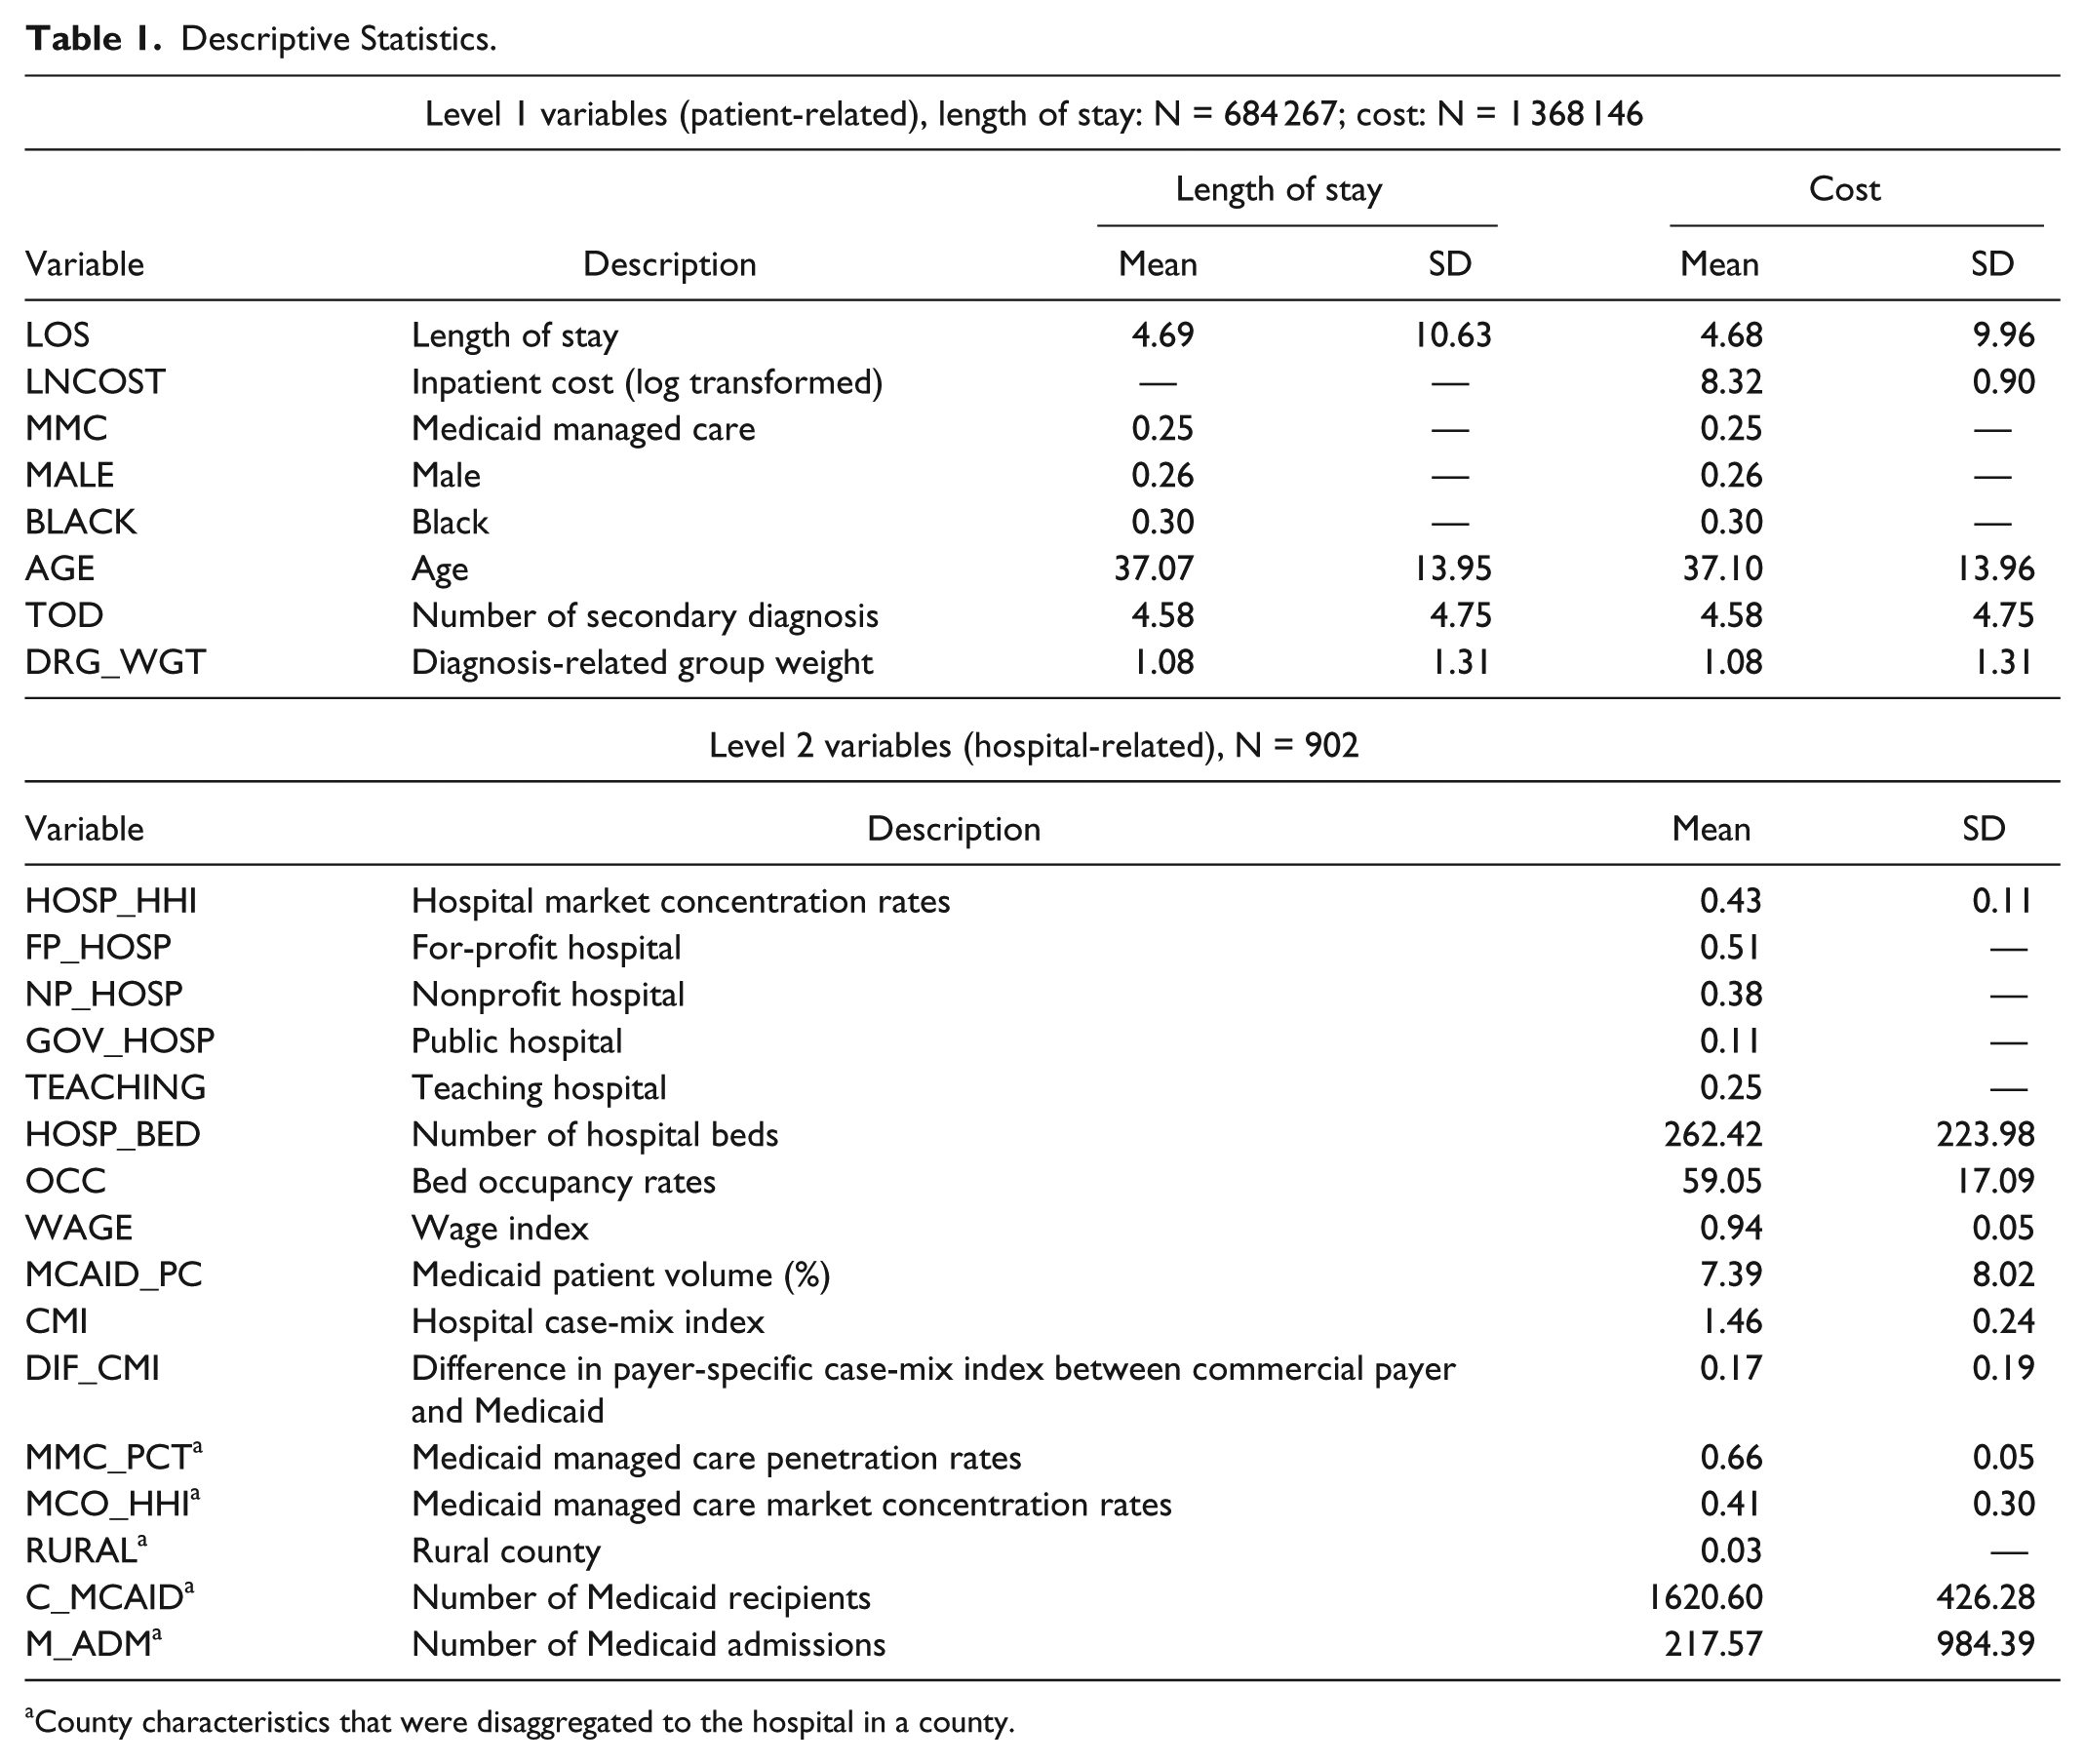
County characteristics that were disaggregated to the hospital in a county.
Medicaid patients in the sample had a mean age of 37. There was unbalanced gender distribution in the sample. The largest proportion of patients were in traditional Medicaid FFS, and black patients accounted for 30% of all Medicaid inpatient discharges. The average Medicaid patients had 4.6 secondary diagnoses. On average, Medicaid patients were hospitalized with a DRG weight of 1.08.
At level 2, there were 902 hospital-year observations from 2006 to 2012. The HHI ranged between 0.20 and 0.76 for hospitals. Of the 902 observations, the most common form of ownership was private for-profit hospitals, followed by private nonprofit hospitals and public hospitals. One fourth of the hospitals were teaching hospitals. Hospitals had an average of 262 beds and an average bed occupancy rate of 59%. On average, Medicaid patients accounted for 7.4% of total hospital discharges. The average hospital’s CMI was equal to 1.46. The mean difference in payer-specific CMI between commercial payers and Medicaid was 0.17, indicating that hospitals received more reimbursement from commercial insurers than from Medicaid. For characteristics of the counties where the hospitals were located, Medicaid managed care penetration rates ranged from a low of 36% to a high of 76%, with an average of 66%. The HHI of counties ranged between 0.14 and 1.00 for Medicaid MCOs. Only 3% of hospitals were located in rural areas.
Table 2 shows statistically significant fixed effects of level 1 predictors on the expected log of LOS. On average, each predictor was significantly related to the expected LOS across hospitals. The results show that Medicaid managed care was associated with shorter LOS. In Model 1, the incidence rate ratio (IRR) value for Medicaid MCO patients was about 0.93, which means Medicaid MCO patients had nearly 7% shorter LOS than did Medicaid FFS patients.
Estimates for the Expected Log of Length of Stay in Hospital.

Note. The results with time fixed effects are not reported; the variables at levels 1 and 2 are grand mean centering variables. IRR = incidence rate ratio.
Private for-profit hospital (FP_HOSP) was used as a reference group.
There was a strong association between hospital competition and LOS. As HHI is a measure of concentration, Medicaid patients had longer LOS in hospitals with large market shares. However, the study found neither a significant effect of Medicaid managed care penetration nor a significant effect of the HHI of Medicaid MCO patients on hospital LOS.
With regard to other characteristics of hospitals, the study found that government hospital status, number of hospital beds, inpatient bed occupancy rates in hospital, wage index, and CMI difference were statistically significant at the .05 level. In sum, level 2 predictors explained 40.7% of the parameter variation in intercept.
Model 2 in Table 1 presents cross-level interactions effects in multilevel modeling. The effect of Medicaid managed care on hospital LOS was moderated by market structure variables. Figure 1 shows that the LOS of Medicaid MCO patients was significantly associated with the level of Medicaid managed penetration, whereas the LOS of Medicaid FFS patients remained unaffected by managed care penetration. Thus, high Medicaid managed care penetration was not associated with shorter LOS in hospitals for Medicaid FFS patients. Regarding the HHI of Medicaid MCOs, there was an interaction between payer groups and MCO_HHI. Under a competitive market, Medicaid MCO patients had much shorter LOS than did Medicaid FFS patients, but the difference became smaller under a concentrated market (see Figure 1b). Last, hospital competition did not affect Medicaid MCO patients differently than it did for Medicaid FFS patients.

Predicted LOS by (a) Medicaid insurance status and MMC penetration rate and (b) Medicaid insurance status and HHI of Medicaid MCOs.
Table 3 presents the models of hospital inpatient costs. The study found statistically significant fixed effects of level 1 variables, except for BLACK, on hospital inpatient costs. The results show that Medicaid managed care is associated with lower inpatient costs of care. In Model 3, the coefficient for Medicaid managed care patients was −0.019. As the dependent variable was log transformed, being a Medicaid managed care patient changed inpatient costs by −1.88 while all other variables were held constant. 13
Estimates for the Log-Transformed Inpatient Cost.

Note. The results with time fixed effects are not reported; the variables at levels 1 and 2 are grand mean centering variables.
Private for-profit hospital (FP_HOSP) was used as a reference group.
In Table 3, the Medicaid managed care penetration rate was not significantly associated with hospital inpatient costs for Medicaid patients. Also, the HHI of Medicaid MCO had an insignificant effect on the costs of inpatient care. With regard to hospital concentration, there was a significant negative association between hospital concentration and hospital inpatient costs. Thus, increasing competition in the hospital markets increased the hospital inpatient costs for Medicaid patients.
For other hospital-level variables in Model 3, the researcher found that all level 2 predictors except for MMC_PCT, MCO_HHI, and RURAL were significant. The results show that both nonprofit and government hospitals were positively correlated with higher Medicaid inpatient costs, compared with for-profit hospitals. Also, the number of hospital beds, wage index, CMI, and percentages of Medicaid discharges were positively associated with average inpatient costs. However, teaching hospital status, high levels of bed occupancy, and a relatively commercial insurer-specific CMI (than Medicaid-specific CMI) were associated with decreased Medicaid inpatient costs. In sum, level 2 predictors explained 26.2% of the parameter variation in the intercept.
Model 4 shows that only 1 cross-level interaction (ie, MMC × MMC_PCT) was statistically significant. In Figure 2, Medicaid MCO and Medicaid FFS patients had slopes of opposing directions, and 2 slope lines intersected. Figure 2 shows that Medicaid inpatient costs for FFS patients significantly decreased as Medicaid managed care penetration increased. This result demonstrated the spillover effects of Medicaid managed care on other patients enrolled in Medicaid FFS.
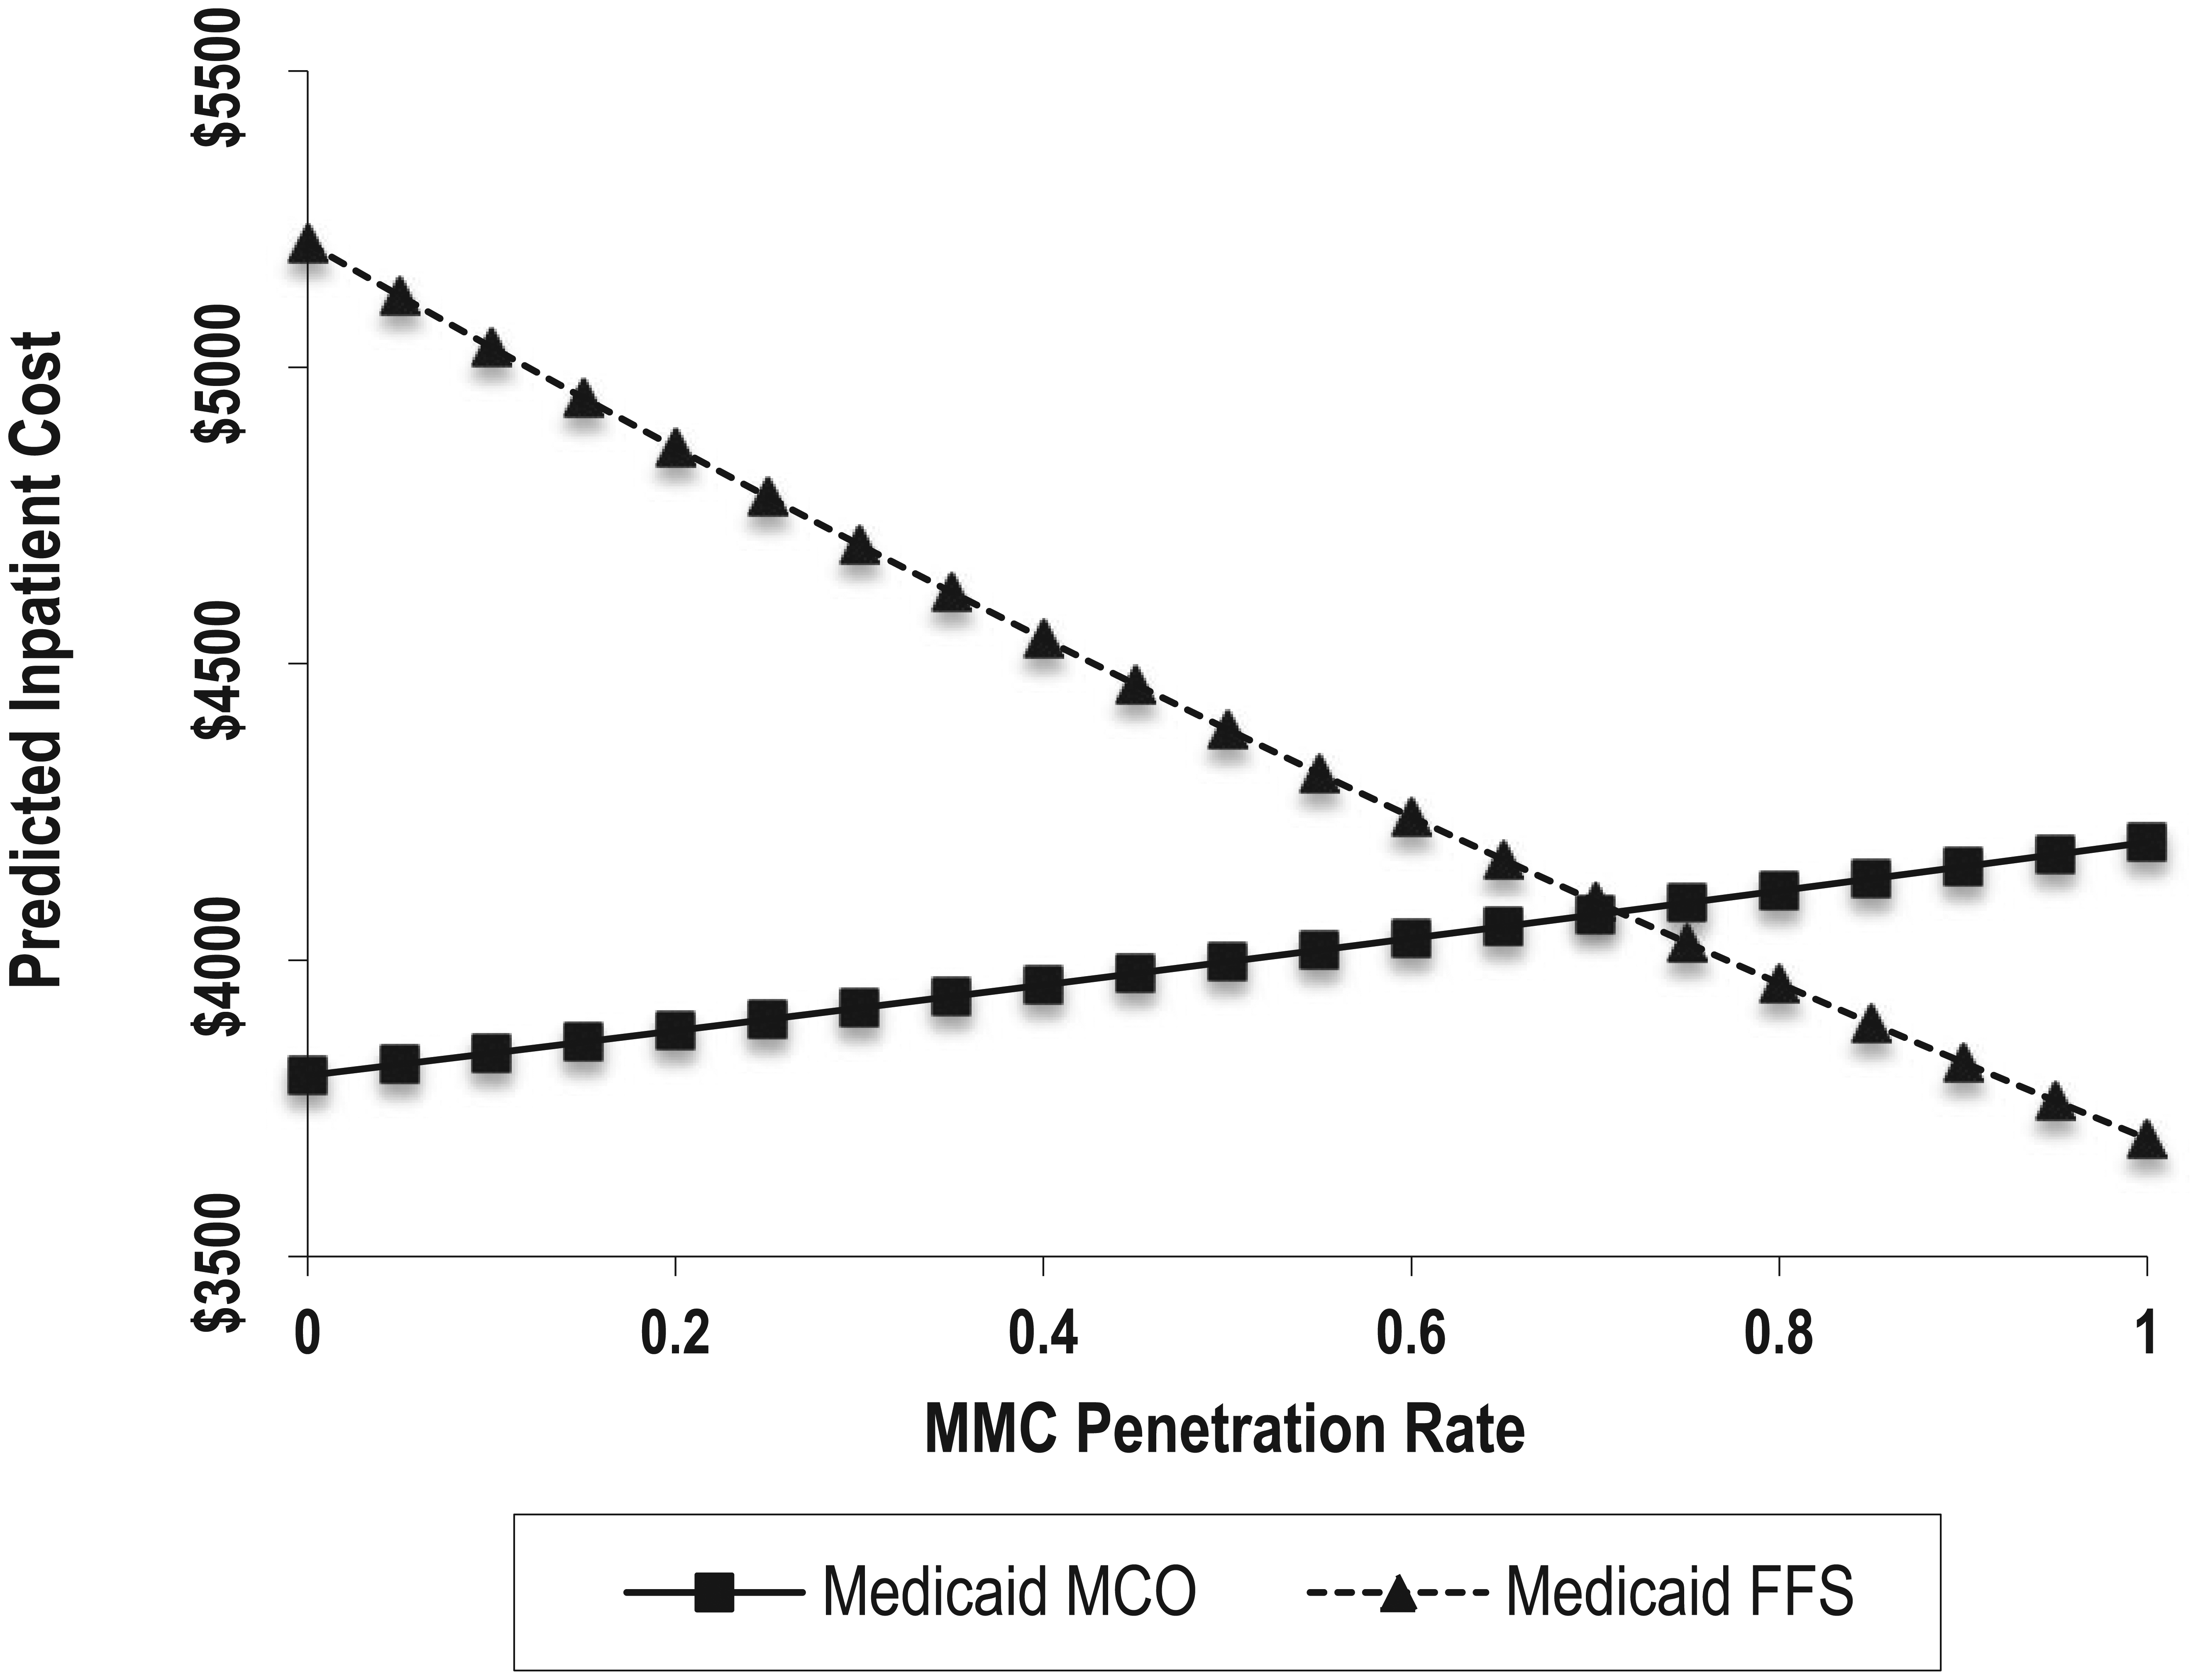
Predicted inpatient cost by Medicaid insurance status and MMC penetration rate.
Discussion
This study attempted to examine how Medicaid managed care enrollment was related to hospital LOS and inpatient costs. There was a fairly large variation in LOS and inpatient costs across hospitals. The presence of these large variations between groups justified the use of HLM to improve precision (ie, unbiased stand errors) by estimating shared variance.
The type of Medicaid program in which patients were enrolled was significantly related to hospital LOS and inpatient costs. The study found that Medicaid managed care patients were more likely to have shorter LOS and lower inpatient costs compared with FFS Medicaid patients. Specifically, Medicaid managed care patients had 7% shorter LOS and a 1.9% lower inpatient cost than did their FFS counterparts. A Medicaid managed care program appears to have had a negligible effect on hospitalization costs for each individual patient, but we need to look at the aggregate effects of cost saving. In 2014, Florida spent a total of US$23 billion to cover its Medicaid program; thus, the aggregate amount of cost reduction is not negligible. The result is consistent with findings from previous studies.14,15 De Jong et al 15 explained that health maintenance organizations’ (HMOs) utilization management strategies and financial incentives for physicians significantly influences physicians’ LOS decisions. In addition, there is less variation in LOS for managed care patients because physicians face similar constraints and incentives from HMO insurance. 15 Following the methodology of De Jong et al, 15 this study examined some DRGs that were frequent among Medicaid patients in terms of mean and variation differences between Medicaid managed care and Medicaid FFS patients (see Supporting Information). For most DRGs, Medicaid managed care patients had shorter LOS and more similar LOS than did FFS Medicaid patients. Medicaid managed care patients also had lower inpatient costs for two obstetrics DRGs (ie, cesarean section with complication and without complication), and their variances in costs were smaller than those of Medicaid FFS patients. In sum, this study demonstrates that Medicaid managed care constrains physicians’ behavior, which in turn reduces LOS and inpatient costs.
Examining the Medicaid managed care and interaction term market structure (ie, MCO_HHI and MMC_PCT) and Medicaid managed care, it can be seen that Medicaid managed care patients had shorter LOS in high Medicaid MCO competition markets than in low Medicaid MCO competition markets. When competing for Medicaid managed care contracts, Medicaid MCOs have financial incentives and use management strategies to lower costs by reducing utilization levels of hospital inpatient care. MCOs reduce inpatient utilization by “using fewer resources once a customer is admitted.” 16 Furthermore, hospitals can lower costs and increase profit margins by reducing LOS after the adoption of prospective payment systems. 11 Medicaid managed care penetration also moderated the relationship between Medicaid managed care and LOS. Medicaid MCO patients admitted in hospitals with high Medicaid managed care penetration had shorter LOS than did patients in low penetration markets. The results demonstrate that Medicaid MCOs had more market power on utilization of hospital service in an area with high penetration. Greater market power can lead to an enhanced bargaining position of MCOs over hospitals, allowing them to extract steep price discounts from hospitals and physicians. 17 As a result, health care providers change their practice patterns and decrease LOS for Medicaid managed care patients
The findings from this study supported the existence of a spillover effect of Medicaid managed care on the hospital inpatient costs for Medicaid FFS patients. Greater Medicaid managed care penetration was associated with lower inpatient costs for Medicaid FFS patients, as shown in Figure 2. The spillover effects of managed care penetration may be due to changing physician behavior and practice patterns through increased activity of managed care. 18 A previous study suggests that health care providers are more likely to pay attention to cost-effective procedures in a highly managed care penetration area. 17 Physicians may decide to forgo costly procedures and tests under the contracts with managed care plans, and these changes in physician behavior and practice patterns may influence the care of patients in nonmanaged care plans. As a result, highly managed care penetration generates a cost-decreasing spillover to FFS patients. However, the results should be interpreted with caution, as they may be attributable to the fact that more high-cost/high-risk FFS patients move into managed care programs. This selection bias can be associated with changes in inpatient costs of Medicaid FFS patients when Medicaid managed care penetration increases. Likewise, increasing costs for patients covered by managed care Medicaid can be attributed to selection effects.
This study has some limitations that have to be pointed out. First, we cannot generalize the results of study to other states, which have different market conditions and managed care policies. Second, the study used hospital inpatient discharge data as its primary source of patient data. The use of administrative data for research has limitations because those data are restricted in scope and do not include broader information on patients. Hospital inpatient discharge data do not include patients’ socioeconomic statuses, detailed patient health information, or patterns of health service use that could influence dependent variables. Future studies might consider including these control variables at the patient level.
Footnotes
Supporting Information
Acknowledgements
The author thanks Dr. Keon-Hyung Lee for his helpful comments and suggestions. Also, comments by two anonymous reviewers helped to improve an earlier version of this article.
Declaration of Conflicting Interests
The author(s) declared no potential conflicts of interest with respect to the research, authorship, and/or publication of this article.
Funding
The author(s) disclosed receipt of the following financial support for the research, authorship, and/or publication of this article: The open access fee for this work was funded through the Florida State University Open Access Publishing Fund.