
Abstract
This study establishes economic growth needed for supply-side mobile money drivers in developing countries to be positively related to mobile money innovations in the perspectives of mobile money accounts, the mobile phone used to send money, and the mobile phone used to receive money. The empirical evidence is based on Tobit regressions. For the negative net relationships that are computed, minimum economic growth thresholds are established above which the net negative relationships become net positive relationships. The following minimum economic growth rates are required for nexuses between supply-side mobile money drivers and mobile money innovations to be positive: (i) 6.109 percent (6.193%) of Gross Domestic Product (GDP) growth for mobile connectivity performance to be positively associated with the mobile phone used to send (receive) money and (ii) 4.590 percent (4.259%) of GDP growth for mobile connectivity coverage to be positively associated with the mobile phone used to send (receive) money.
There are three motivational elements that underpin an inquiry into how economic growth modulates mobile connectivity dynamics for financial inclusion in developing countries, notably: (i) the importance of mobile phones and corresponding connectivity dynamics in sustainable development goals (SDGs); (ii) the relevance of mobile phones in financial inclusion; and (iii) an apparent gap in the literature. Indeed, the extant literature is sparse on how economic growth influences the importance of mobile phones and associated mobile connectivity dynamics in mobile money innovations by means of mobile money accounts, the mobile phone used to send money, and the mobile phone used to receive money. 1 The attendant three motivational elements are expanded in the same chronology in the subsequent passages.
First, the importance of the mobile phone in SDGs can be articulated from the fact that the mobile phone is a fundamental enabler of sustainable development growth as well as a key contributor to the achievement of the United Nations (UN) post-2015 sustainable development agenda, which consists of 17 poverty and inequality related goals targeted to be achieved by 2030 (Granryd 2018). It is also worthwhile to articulate that as early as 2016 in the post-2015 global development agenda, the mobile industry was the first world sector to commit to SDGs by pledging to considerably leverage on the underlying networks that operators in this mobile industry had already built and which were being used to deliver inclusive services to developing countries. According to the narrative, over the years, there has been ample real-world evidence showing the importance of mobile technologies in the achievement of all 17 SDGs, especially by means of enhanced financial access to the previously unbanked poor fractions of society.
Second, the importance of mobile phones in financial inclusion is apparent from a plethora of perspectives, with the lives of many in emerging countries changing owing to reducing poverty and inequalities (Jensen 2007; Goyal 2010; Granryd 2018; Gosavi 2018; Tchamyou, Asongu and Odhiambo 2019a; Asongu, Nnanna and Acha-Anyi 2020a, Asongu, Nnanna and Acha-Anyi 2020b; Morsy 2020; Anarfo, Abor and Osei 2020). A means of such inclusion is the growing use of mobile money accounts because, as substantiated by Granryd (2018), toward the end of 2017, about 700 million registered mobile accounts were apparent. This constituted a rise of 62 percent from the previous two years. Mobile money progressed as the principal platform of payment in the digital economy of many developing countries. It follows that mobile money innovations such as mobile money accounts, the mobile phone used to send money, and the mobile phone used to receive money are the main mobile money financial inclusion dynamics that are substantially contributing toward mitigating poverty and inequality in the light of SDGs. The present study aims to contribute to the understanding of this phenomenon by assessing how economic growth modulates supply-side mobile money drivers to affect mobile money innovations, owing to an apparent gap in the extant literature.
Third, despite the growing bulk of literature on the relevance of mobile phones and associated externalities in financial inclusion (Ondiege 2010; Asongu 2013; Uduji and Okolo-Obasi 2018a, 2018b; Lashitew, van Tulder and Liasse 2019; Tchamyou, Erreygers and Cassimon 2019b; Asongu, Biekpe and Cassimon 2020, 2021a), most studies have built on the role of mobile money innovations in promoting economic prosperity. However, this study is concerned with the opposite direction (i.e., how growth affects mobile money innovations through supply-side mobile money drivers). Some of the contemporary studies which have focused on innovation stimulating economic growth include innovation that is driven by knowledge for the ultimate purpose of promoting economic growth (Asongu and Kuada 2020; Oluwatobi et al. 2020); country-specific innovations within the framework of environmental policy for economic prosperity (Azimi, Feng and Zhou 2020); innovations in small and medium-sized corporations as a means to economic growth (Gherghina et al. 2020); the relevance of innovations in promoting the economic prosperity of family corporations (Teixeira and Correia 2020); and scientific research innovations for economic performance (Motlagh et al. 2020).
A study by Lashitew, van Tulder and Liasse (2019), which focused on the correlates of mobile money innovations in developing countries, is closest to the present research in the extant literature. That study was concerned with how macro-level demand factors and supply features affect financial inclusion through mobile money innovations in terms of mobile money accounts, the mobile used to send money, and the mobile used to receive money. The present study departs from the underlying literature by arguing that it is not enough to provide linkages between determinants of mobile money innovations and financial inclusion. We instead argue that policy makers are better engaged when the nexuses are conceived within the framework of interactive regressions such that specific policy thresholds at which a policy variable modulates the mobile money drivers to influence mobile money innovations are established. Hence, the present study is tailored to provide policy makers with an idea of the minimum levels of economic growth that are required in order for supply-side mobile money drivers to positively influence mobile money innovations. Therefore, instead of disclosing correlates between the predictors and outcomes, as apparent in Lashitew, van Tulder and Liasse (2019), this study provides minimum economic growth thresholds that are relevant for the investigated nexuses. For this purpose, like in Lashitew, van Tulder and Liasse (2019), the Tobit regressions approach is employed. The following minimum economic growth rates are required for nexuses between supply-side mobile money drivers and mobile money innovations to be positive: (i) 6.109 percent (6.193%) of Gross Domestic Product (GDP) growth for mobile connectivity performance to be positively associated with the mobile phone used to send (receive) money and (ii) 4.590 percent (4.259%) of GDP growth for mobile connectivity coverage to be positively associated with the mobile phone used to send (receive) money.
The study is also framed as an applied economics research. This is essential because, while the theoretical underpinnings of the extant literature from which this study departs have built on innovation as a determinant of economic prosperity, the present study focuses in the opposite direction. In other words, we assess how economic growth moderates the incidence of mobile money drivers on mobile money innovations. Hence, the present research is consistent with the contemporary applied economics literature in arguing that a study based on sound intuition is also a useful scientific activity. Accordingly, it is logical to expect that the degree by which supply-side mobile money drivers affect mobile money innovations is contingent on economic growth. This intuition essentially builds on the logic that higher economic growth levels offer more opportunities for investment and consumption activities as well as enhanced mobile phone supply-side dynamics (inter alia, mobile subscription, mobile connectivity coverage, and mobile connectivity performance) that ultimately influence mobile money innovations. In the same vein of intuition, a country experiencing lower economic growth levels or negative economic growth is unlikely to be associated with comparatively higher levels of supply-side mobile money drivers and, by extension, mobile money innovations.
With the above intuition for the investigated nexuses discussed, this study is consistent with the growing strand of literature on the relevance of applied economics for theory-building, especially when such is based on strong intuition (Narayan, Mishra and Narayan 2011; Costantini and Lupi 2005; Asongu et al. 2019). According to the attendant literature, the sole aim of applied economics is not to exclusively accept or reject existing theoretical underpinnings, given that a study based on sound intuition could also provide the basis for theory-building, especially if it pertains to concerns surrounding a phenomenon such as mobile money innovations that is relevant for the achievement of SDGs.
The rest of the study is structured as follows. We first outline the data and methodology before disclosing the empirical results and engaging in the corresponding discussion. The final section concludes with future research directions.
Data and Methodology
Data
This study uses the same dataset as Lashitew, van Tulder and Liasse (2019), following the motivation in the previous section. This dataset entails 2010 to 2014 averages from developing countries for which data were available at the time of the study. The multitude of sources from which the data are obtained includes (i) World Governance Indicators (WGI) and World Development Indicators (WDI) of the World Bank; (ii) the Financial Inclusion Indices (Findex) database; (iii) the Global Financial Structure Database (GFSD); (iv) Waverman and Koutroumpis (2011); and (v) the Global System for Mobile Communications Association (GSMA).
In accordance with Lashitew, van Tulder and Liasse (2019) and Asongu, Agyemang-Mintah and Nting (2021b), three main outcome variables are used for the study. These are mobile money accounts, the mobile used to send money, and the mobile used to receive money. These dependent variables are obtained from the Findex database. As opposed to Lashitew, van Tulder and Liasse (2019), which focused on assessing correlates of mobile money innovations by leveraging on demand, supply, and macro-level factors, the present study: (i) uses supply-level factors as the independent predictors of interest; (ii) employs a macro-level factor (i.e., economic growth) as the moderating variable; and (iii) uses both demand and macro-level factors as control variables. The motivation for such a departure in focus relative to Lashitew, van Tulder and Liasse (2019) was noted in the introduction. It is also important to mention that, because of concerns pertaining to multicollinearity that are robustly identified in corresponding replication studies (see Asongu, Biekpe and Cassimon 2020, 2021a), not all variables documented in Lashitew, van Tulder and Liasse (2019) are taken on board in the empirical exercise. However, the appendices disclose all these variables in order to further clarify the departure of the present study from Lashitew, van Tulder and Liasse (2019). In what follows, the corresponding macro-level, demand-side, and supply-side mobile money drivers are discussed.
First, the attendant supply factors are fourfold: (i) regulation of the telecommunications sector from Waverman and Koutroumpis (2011); (ii) “gross and unique subscription rate” obtained from the GSMA; (iii) mobile subscription rate from WDI; and (iv) mobile phone connectivity dynamics of coverage and performance from the GSMA. Second, the corresponding demand factors which are sourced from the GFSD are the number of automated teller machines (ATMs), bank sector concentration, and the “percentage of adults with a bank account in a formal banking institution.” Third, the macro-level features are: (i) the rule of law from the WGI of the World Bank; and (ii) GDP growth, the GDP per capita, and urbanization rate from the WDI of the World Bank. The selection of these variables is motivated by the attendant literature on financial inclusion (Mas and Morawczynski 2009; Muwanguzi and Musambira 2009; Waverman and Koutroumpis 2011; Demirgüc-Kunt and Klapper 2012, 2013; Van der Boor, Oliveira and Veloso 2014; Gruber and Koutroumpis 2013; Demirgüc-Kunt, Klapper and Van Oudheusden 2015; Asongu and Odhiambo 2018b; GSMA 2018; Murendo et al. 2018; Asongu and Asongu 2018). With the exceptions of bank concentration and the rule of law, the documented demand, supply, and macro-level factors are broadly anticipated to promote mobile money innovations. It is worth clarifying the potential negative signs from bank sector concentration and the rule of law.
First, the incidence of the rule of law on mobile money innovations may either be positive or negative, contingent on the skewedness of the variable to reflect either good governance or bad governance. Accordingly, good governance indicators of the World Bank can either take positive or negative values. Hence, they can reflect both positive and negative signals as they can either be positively or negatively skewed. Positive skewedness, therefore, translates into good governance, while negative skewedness reflects bad governance. A variable is negatively skewed when: (i) it has a negative mean value; and (ii) its maximum positive value is lower in terms of magnitude than its corresponding maximum negative value. This is the case with the rule of variable, as apparent in Appendix 2.
Second, bank concentration is a proxy for market power (see De Guevara, Maudos and Pérez 2005; Ryan, O’Toole and McCann 2014), which has been established to limit financial access because banks with high market power tend to leverage on the existence of such market power to price loans in excess of associated marginal costs, in order to enjoy a quiet life (Asongu, Nwachukwu and Tchamyou 2016; Asongu and Biekpe 2018; Boateng et al. 2018). This is the reason that, inter alia, over the past decades, information sharing offices have been introduced in developing countries to mitigate information asymmetry and increase inter-bank competition that ultimately engenders more financial access (Tchamyou and Asongu 2017; Kusi et al. 2017; Asongu and Odhiambo 2018a; Kusi and Opoku-Mensah 2018; Tchamyou 2019).
The summary statistics provide complementary information to the discourses in this section, especially in light of the definitions and sources of the variables (see Appendix 1), the summary statistics (see Appendix 2), and the correlation matrix (see Appendix 3). The correlation matrix informs the study on how to avoid entering variables with a high degree of substitution into the same specification. The choice of a correlation level of 0.600, which is the threshold criterion for the presence of multicollinearity, is discussed in the next section.
Methodology
As discussed in the previous section, not all variables are taken on board because of the concerns surrounding multicollinearity, which are not considered by Lashitew, van Tulder and Liasse (2019) are avoided, in accordance with subsequent replication studies (Asongu, Biekpe and Cassimon 2020, 2021a) that are guided by the need to avoid multicollinearity. Along the same analytical lines, a threshold of 0.600 is adopted to acknowledge variables that are highly correlated because it is the average of two values (i.e., 0.700 and 0.500) posited by two conflicting strands in the literature on multicollinearity. Accordingly, while Kennedy (2008) argues for a 0.700 threshold, Wichers (1975) and O’Brien (2007) argue for a threshold of 0.500.
The adopted empirical strategy is in line with Lashitew, van Tulder and Liasse (2019). Moreover, the choice of the empirical strategy (i.e., Tobit regressions) is also consistent with the data behavior of outcome variables. Accordingly, as documented in the attendant Tobit-centric regressions literature (Kumbhakar and Lovell 2000; Koetter and Vins 2008; Ariss 2010; Coccorese and Pellecchia 2010; Asongu and Nwachukwu 2016; Ajide, Raheem and Asongu 2019), the choice of the empirical approach is worthwhile when the outcome variables are defined within specified limits, such that minimum and maximum values are clearly apparent. This is the case of the mobile money innovation adoption rates used as outcome variables in the study because they are theoretically defined between the range of 0.00 percent and 100.00 percent adoption rates. On the practical front, as apparent in Appendix 2, the corresponding adoption ranges for mobile money accounts, the mobile phone used to send money, and mobile phone used to receive money are, respectively, 0.00 percent to 58.39 percent, 0.00 percent to 60.48 percent, and 0.00 percent to 66.65 percent.
In light of the above, a double censored Tobit regressions model is consistent with the data behavior because the regression approach is censored on both sides of the distribution of the outcome variables. It is worth noting that, when there are broad differences in the conditional probabilities of limited observations, an Ordinary Least Squares (OLS) approach is inappropriate for examining the underlying linkages between the predictors and the outcome variables (Amemiya 1984).
Building on the mainstream Tobit regression studies (Tobin 1958; Carson and Sun 2007), Equations (1) and (2) below reflect the main Tobit estimation process.

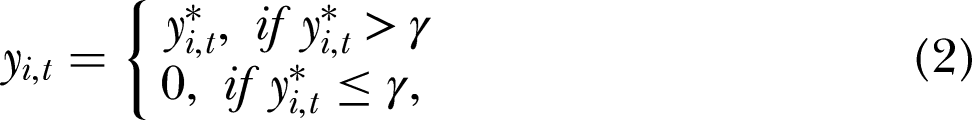
The following assumptions are considered by the Tobit regressions model: (i) it is acknowledged that residuals are distributed normally and (ii) the latent dependent variables that are also unbounded represent a linear function of the predictors (Amemiya 1984). Moreover, two main marginal relationships are apparent that connect the main predictors (supply-side mobile money drivers and economic growth) with the mobile money innovation outcome variables. The first translates marginal nexuses of the principal predictors of the unobserved latent rate of mobile money adoption, whereas the second pertains to the censored, observed rate of mobile money innovation in terms of adoption rate. In line with the corresponding literature employing the same dataset (Lashitew, van Tulder and Liasse 2019; Asongu, Biekpe and Cassimon 2020, 2021a), only marginal nexuses that are connected to the observed and censored rates of adoption of the attendant mobile money innovations are provided in the empirical section because they are consistent with a more obvious analytical interpretation.
Empirical Results
Presentation of Results
The empirical findings are provided in this section in Tables 1–2. Table 1 shows findings on nexuses between economic growth, the mobile subscription rate, and mobile connectivity performance. Table 2 discloses results on linkages between economic growth, mobile connectivity coverage, and telecommunications (or telecom) sector regulation. Each table is characterized by six main specifications with every supply-side mobile money driver linked to three specifications corresponding to each of the mobile money innovation drivers, namely: mobile money accounts, the mobile phone used to send money, and the mobile phone used to receive money. To put this clarification into more perspective, the left-hand side of Table 1 (consisting of three main specifications), which shows regressions related to interactions between the economic growth rate and the unique mobile subscription rate, entails specifications targeting the following outcomes: (i) mobile money accounts (in the first specification or second column); (ii) the mobile phone used to send money (in the second specification or third column); and (iii) the mobile phone used to receive money (in the third specification or fourth column).
GDP Growth, Supply-Side Mobile Innovations, and Financial Inclusion (1).
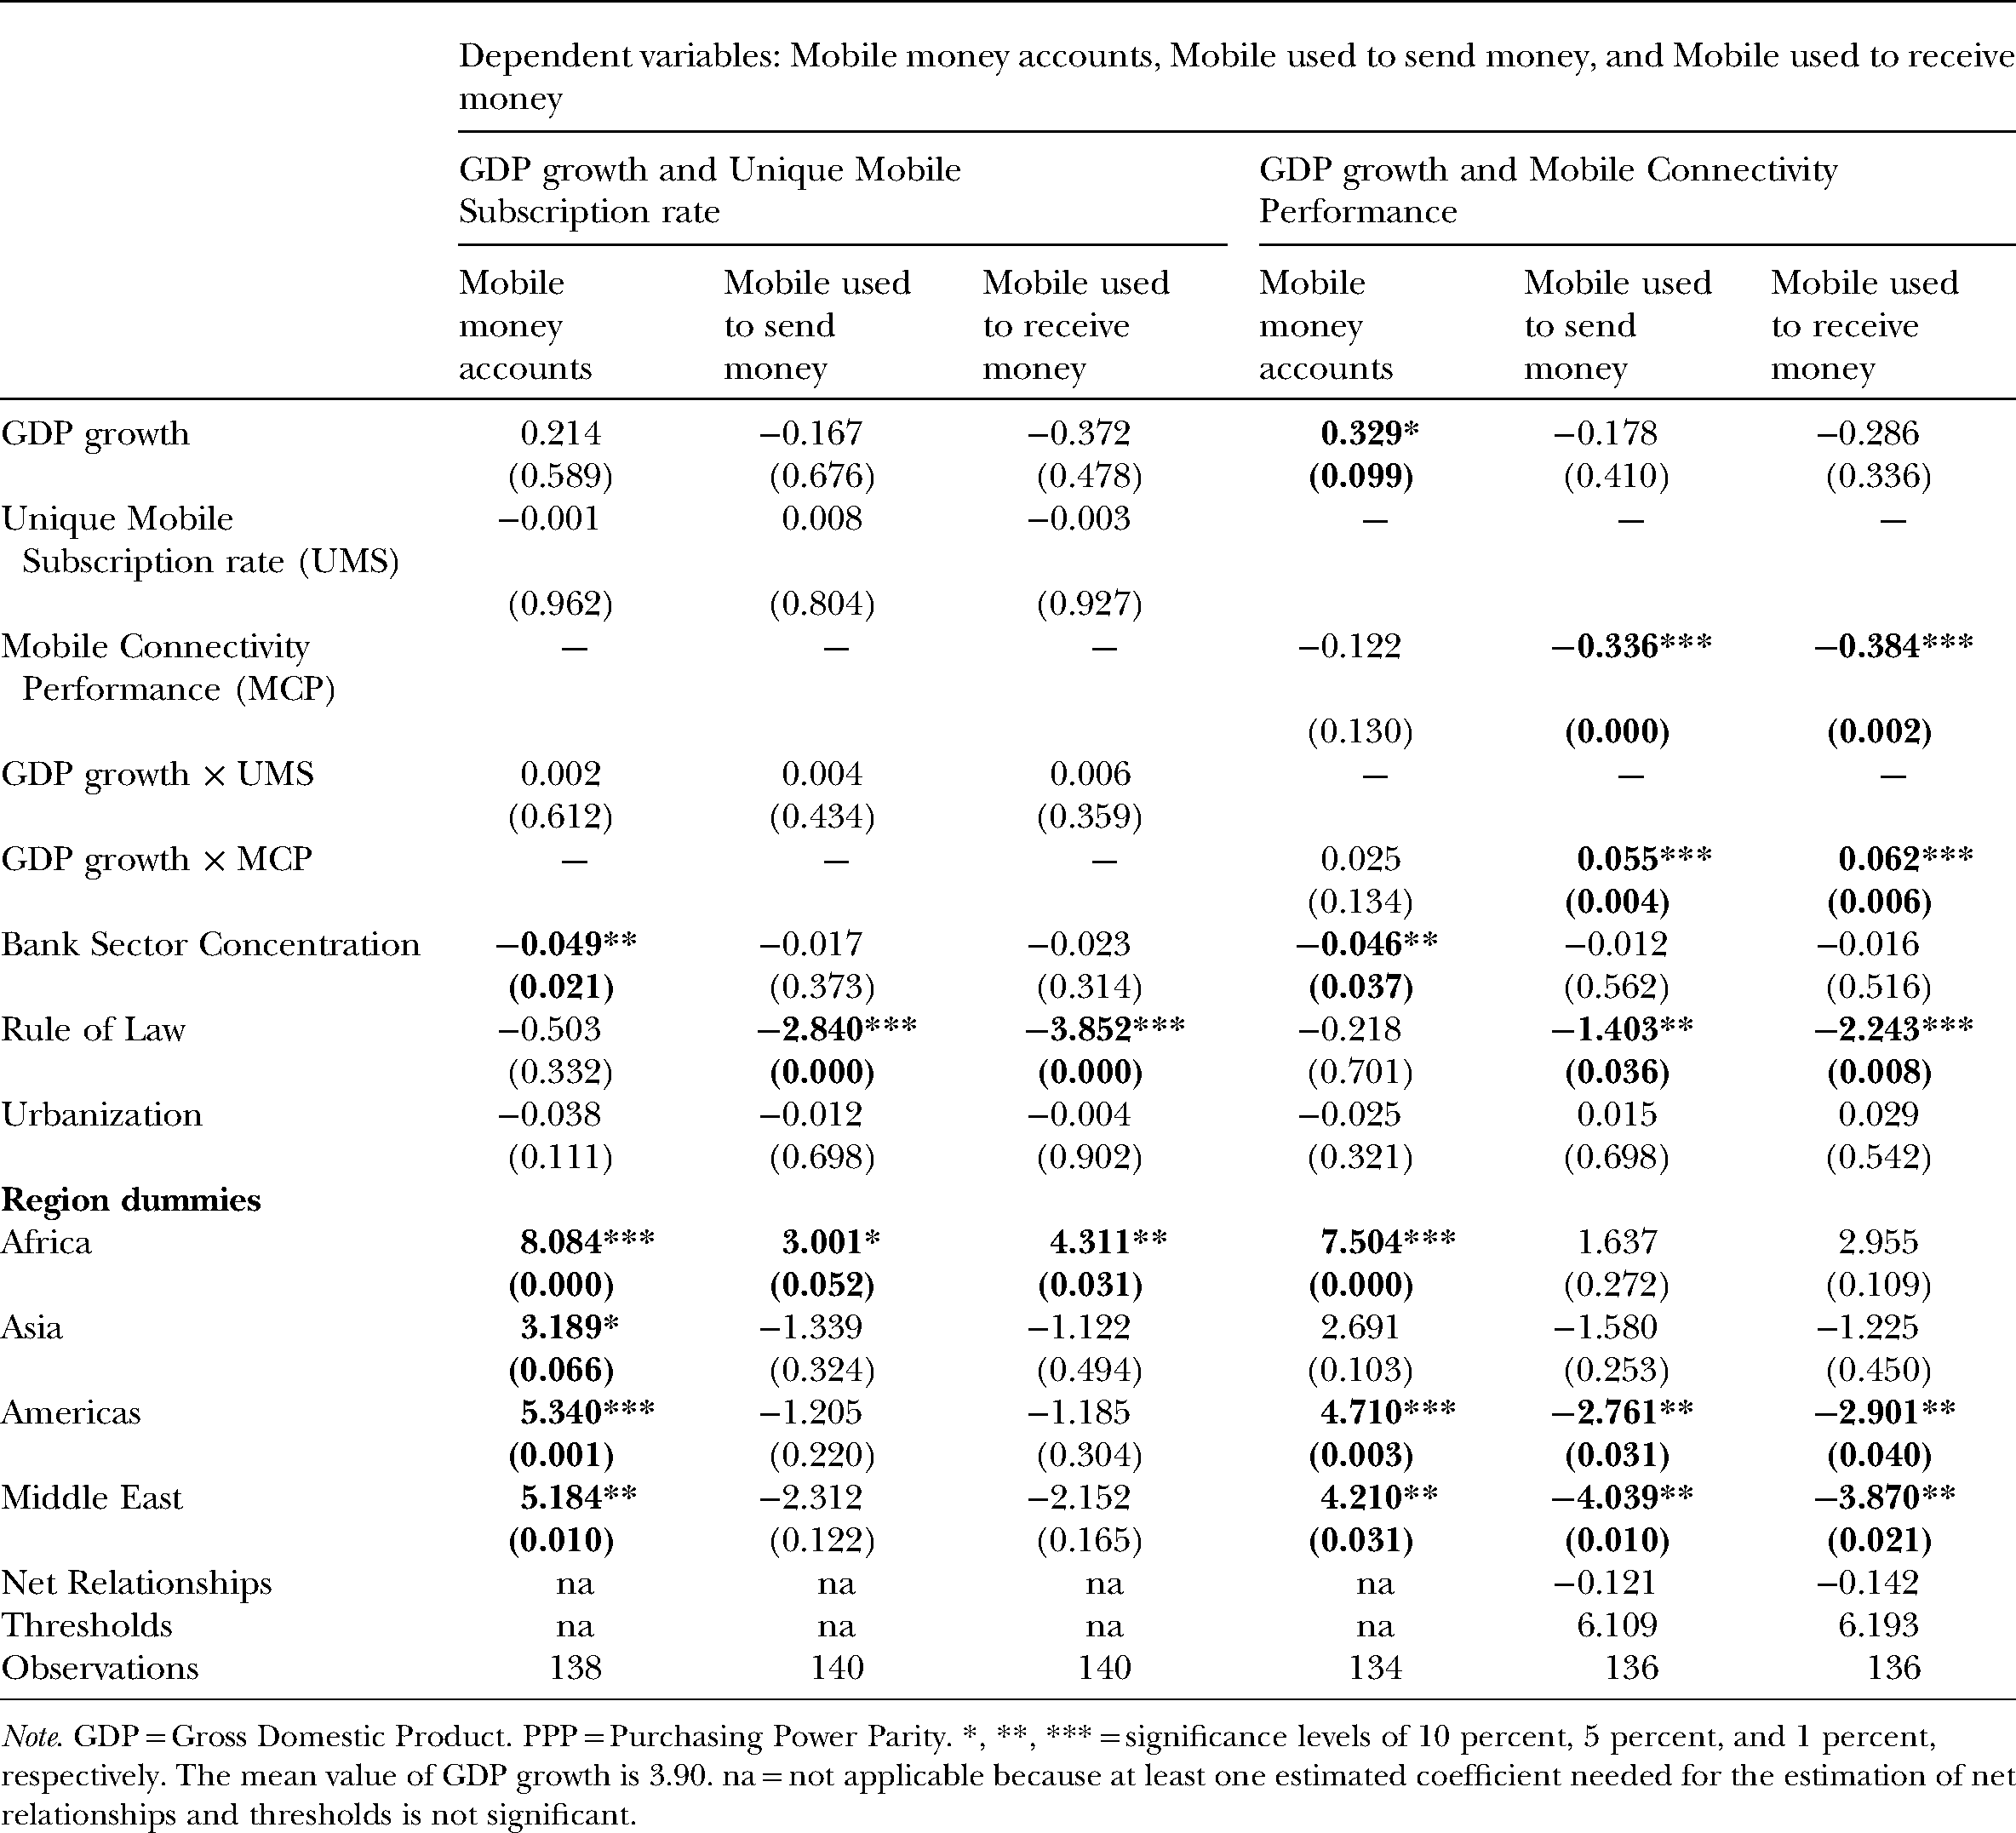
Note. GDP = Gross Domestic Product. PPP = Purchasing Power Parity. *, **, *** = significance levels of 10 percent, 5 percent, and 1 percent, respectively. The mean value of GDP growth is 3.90. na = not applicable because at least one estimated coefficient needed for the estimation of net relationships and thresholds is not significant.
GDP Growth, Supply-Side Mobile Innovations, and Financial Inclusion (2).
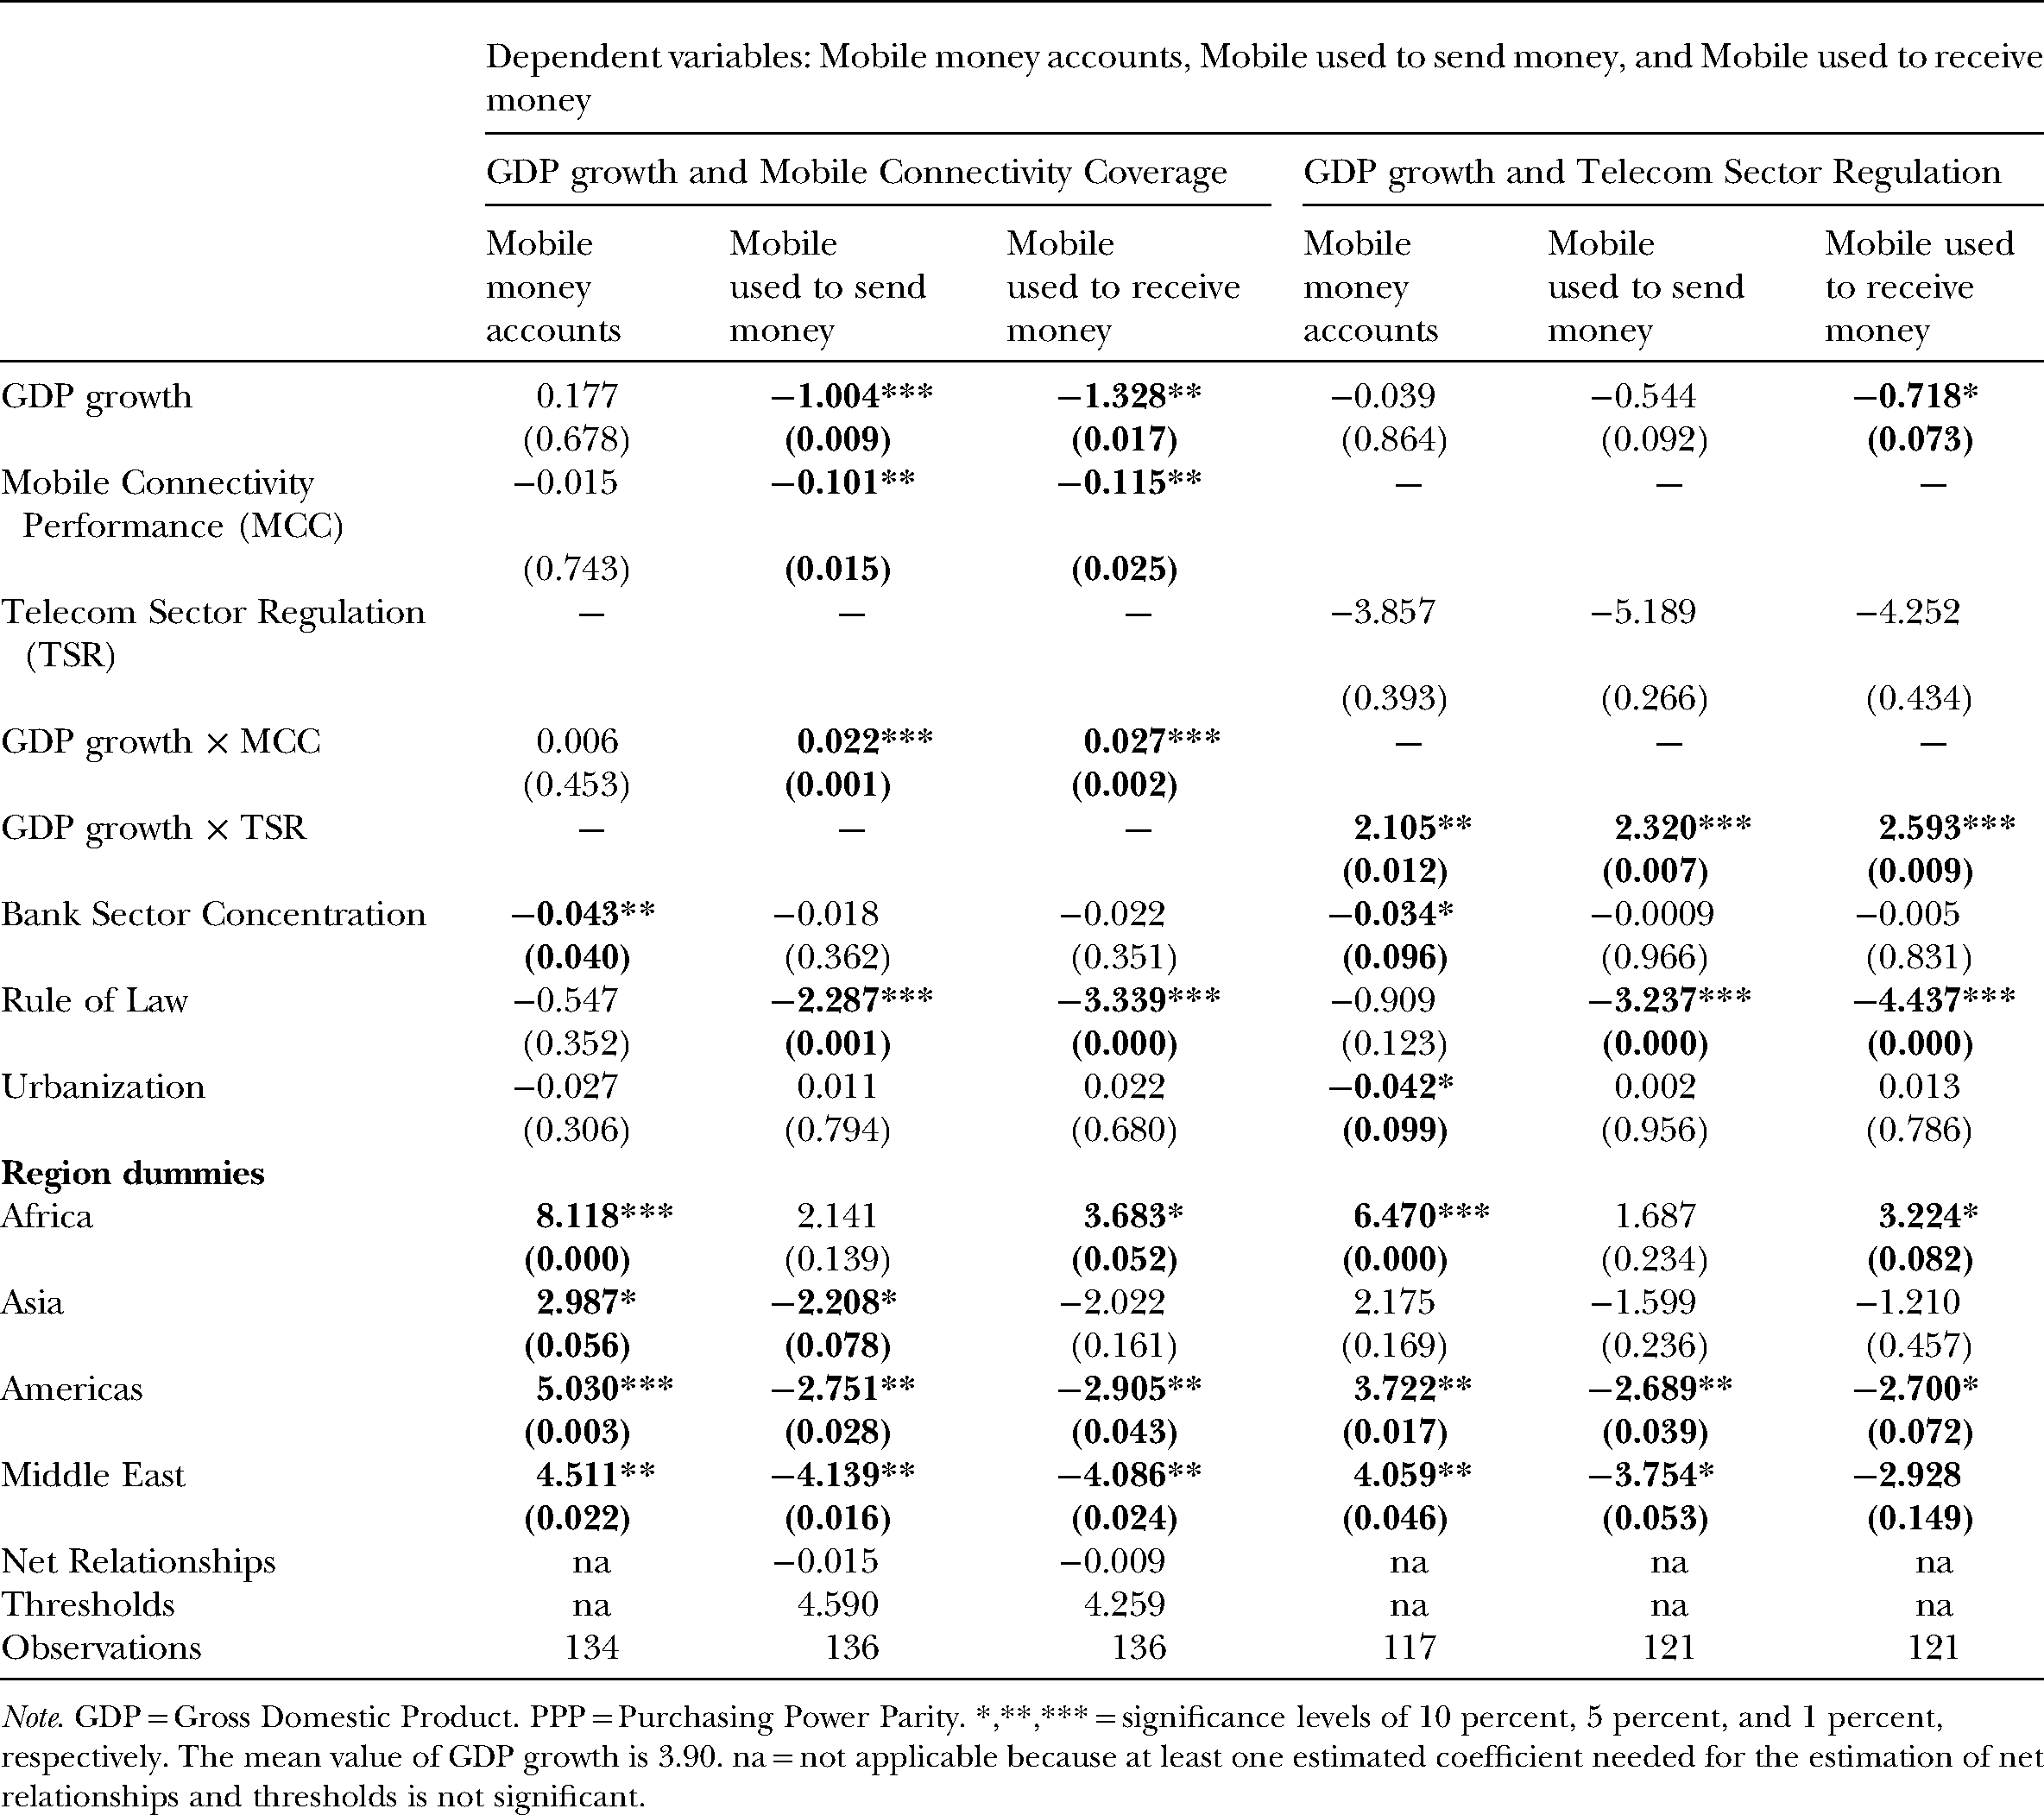
Note. GDP = Gross Domestic Product. PPP = Purchasing Power Parity. *,**,*** = significance levels of 10 percent, 5 percent, and 1 percent, respectively. The mean value of GDP growth is 3.90. na = not applicable because at least one estimated coefficient needed for the estimation of net relationships and thresholds is not significant.
To assess the overall incidence of economic growth in modulating the supply-side mobile money drivers on mobile money innovations, net relationships are computed in accordance with contemporary studies on interactive regressions (Agoba et al. 2019). Accordingly, for the computation of the net relationships to be worthwhile, both the unconditional and conditional nexuses should be significant. Hence, when at least one of the underlying nexuses is not significant, the net relationships are not computed and “not applicable” (or “na”) is assigned to the corresponding spaces.
The computation of net relationships can be further illuminated with an example from Table 1. In the penultimate column of Table 1, the net relationship from the role of economic growth in modulating mobile connectivity performance to influence the mobile used to send money is −0.121([0.055 × 3.90] + [ − 0.336]) 2 . In this computation, the average value of economic growth is 3.90 percent, the unconditional nexus of mobile connectivity performance on the mobile used to send money is −0.336, while the conditional relationship (from the interaction between economic growth and mobile connectivity performance) is 0.055. In the same vein, in the last column of Table 1, the net relationship from the role of economic growth in modulating mobile connectivity performance to influence the mobile used to send money is −0.142 ([0.062 × 3.90] + [ − 0.384]). In this computation, the average value of economic growth is 3.90 percent, the unconditional nexus of mobile connectivity performance on the mobile used to receive money is −0.384, while the conditional relationship (from the interaction between economic growth and mobile connectivity performance) is 0.062.
In light of the above clarifications, the following findings are apparent from Tables 1 and 2. First, net negative relationships are apparent from the role of economic growth in modulating mobile connectivity performance to influence the mobile phone used to send/receive money. Second, net negative nexuses are apparent from the role of economic growth in modulating mobile connectivity coverage to influence the mobile phone used to send/receive money. Third, net significant relationships cannot be established from the relationships between unique mobile subscription rate and economic growth. Fourth, while net relationships are not also apparent from the role of economic growth in moderating telecommunications sector regulation, corresponding positive conditional or interactive nexuses are consistently significant for all three mobile money innovation proxies. Fifth, the significant control variables largely reflect the expected signs.
Extended Analysis With Minimum Thresholds for Mobile Money Innovations
Consistent with the problem statement of this study, this research goes beyond the establishment of net relationships to establishing economic growth thresholds that modulate the corresponding supply-side mobile money drivers to favorably influence mobile money innovations. From the regressions for which net relationships are apparent, three main tendencies are useful to understand the establishment of these anticipated thresholds: (i) the unconditional incidences of supply-side mobile money factors on the attendant mobile money innovations are consistently negative; (ii) the conditional relationships pertaining to the interactions between economic growth and supply-side mobile money factors are consistently positive; and (iii) the attendant net relationships or nexuses are consistently negative. These tendencies imply that, at certain levels of economic growth, the computed net negative relationships can become positive. Within this framework, minimum levels of economic growth are required for the attendant supply-side mobile money drivers to positively influence the corresponding mobile money innovations. The narrative is substantiated in what follows with an example earlier used to clarify the computation of net relationships.
In the last column of Table 1, the corresponding economic growth threshold is 6.193 percent (0.384/0.062). It implies that an economic growth rate of 6.193 percent is the minimum growth rate required for mobile connectivity performance to have a positive relationship with the mobile phone used to receive money. To put this articulation into more perspective, when the economic growth rate is 6.193 percent, the net relationship becomes zero or 0 = ([0.062 × 6.193] + [ − 0.384]). Hence, when the economic growth rate is above the established threshold, a positive relationship between mobile connectivity performance and the mobile phone used to receive money becomes apparent. For instance, for an economic growth rate of 6.5 percent, the net relationship becomes 0.019 = ([0.062 × 6.500] + [ − 0.384]).
Given the above insights into the computation of thresholds, the following minimum economic growth rates are required for nexuses between supply-side mobile money drivers and mobile money innovations to be positive: (i) 6.109 percent (6.193%) of GDP growth for mobile connectivity performance to be positively associated with the mobile phone used to send (receive) money and (ii) 4.590 percent (4.259%) of GDP growth for mobile connectivity coverage to be positively associated with the mobile phone used to send (receive) money. These computed thresholds are policy worthy and make economic sense because they are situated within the established ranges in the summary statistics. In other words, in order for the established thresholds to make economic sense and be policy-relevant, they should be within the minimum and maximum values of, respectively, −4.92 percent and 11.10 percent GDP growth rates as apparent in Appendix 2 or the summary statistics.
Concluding Implications and Future Research Directions
This study complements the extant literature by establishing minimum levels of economic growth that are essential in order for supply-side mobile money drivers in developing countries to be positively related to mobile money innovations in the perspectives of mobile money accounts, the mobile phone used to send money and the mobile phone used to receive money. The present study departs from the extant literature by arguing that it is not enough to provide linkages between determinants of mobile money innovations and financial inclusion. Accordingly, the present study argues that policy makers are more taken on board when the nexuses are conceived within the framework of interactive regressions such that specific thresholds at which a policy variable modulates mobile money drivers to influence mobile money innovations are established.
The empirical evidence is based on Tobit regressions. The following net nexuses are established. First, the net negative relationships are apparent from the role of economic growth in modulating mobile connectivity performance to influence the mobile used to send/receive money. Second, net negative nexuses are apparent from the role of economic growth in modulating mobile connectivity coverage to influence the mobile used to send/receive money. Third, net significant relationships cannot be established from the relationships between unique mobile subscription rate and economic growth. Fourth, while net relationships are not also apparent from the role of economic growth in moderating telecommunications sector regulation, corresponding positive conditional or interactive nexuses are consistently significant for all three mobile money innovation proxies.
For the negative net relationships that are computed, minimum economic growth thresholds are established above which the net negative relationships become net positive relationships. The following minimum economic growth rates are required for nexuses between supply-side mobile money drivers and mobile money innovations to be positive: (i) 6.109 percent (6.193%) of GDP growth for mobile connectivity performance to be positively associated with the mobile phone used to send (receive) money and (ii) 4.590 percent (4.259) of GDP growth for mobile connectivity coverage to be positively associated with the mobile phone used to send (receive) money. The computed thresholds make economic sense and are policy relevant because they are situated within the statistical range disclosed in the summary statistics.
The findings above obviously leave avenues for further research, especially as it pertains to using panel data to assess if the established nexuses in the perspective of relationships can withstand empirical scrutiny in terms of causality. Moreover, with the passage of time, as the apparently sparse mobile banking data become more available, it would also be worthwhile to engage country-specific studies in order to establish findings that reflect more targeted country-specific implications. Moreover, while this study inherits and follows the model adopted by Lashitew, van Tulder and Liasse (2019), alternative models such as the fractional response technique and two-stage procedures as employed by Simar and Wilson (2007) should be considered in future studies. This suggestion is motivated by the fact that such Beta regression techniques are also appropriate when the outcome variable is bounded between 0 and 1. In the same vein, while we build on the data provided by Lashitew, van Tulder and Liasse (2019) and such data do not have alternative measurements of the outcome variables based on the volume of transactions, future studies should emphasize the volume of transactions as opposed to the number of transactions.
Footnotes
Acknowledgments
The authors are indebted to the editor and anonymous reviewers at World Affairs Journal for constructive comments. The authors are thankful to Addisu A. Lashitew, Rob van Tulder, and Yann Liasse for sharing their dataset.