
Abstract
Recent studies addressing the social polarisation debate have produced conflicting evidence. Some studies have produced evidence of professionalisation, showing that most employment growth was in high-income managerial and professional occupations. Another study has produced evidence of asymmetrical polarisation, with more employment growth in high-income occupations but also some employment growth in low-income occupations. This study contributes to this debate by producing evidence for a much longer period and by debating the relevance of different occupational schemes for testing the social polarisation theory. In doing so, we draw upon the broader debate about how to conceptualise, classify and measure the occupational class structure. We argue that our use of the Standard Occupational Classification, rather than the more commonly used National Statistics Socio-Economic Classification, produces evidence that is better suited to testing the social polarisation theory. Grounded in job descriptions and skill levels, the nine major groups of the Standard Occupational Classification were ranked based on average earnings using data from the Office for National Statistics. The results reveal that, over the past 40 years, London’s occupational structure has undergone a highly asymmetrical form of polarisation, with almost all employment growth taking place among high-income managerial, professional, associate professional and technical jobs and much less employment growth in low-income jobs and a decline in middle-income jobs.
Introduction
Recent contributions to the debate over London’s changing occupational class structure have produced contradictory interpretations. van Ham et al. (2020) argue that changes in London’s occupational class structure show that it is becoming increasingly ‘professionalised’, with more employment growth in high-income managerial and professional jobs and substantially less growth in middle- and low-income jobs. By contrast, Hamnett (2024) argues that recent employment trends in London’s occupational class structure are showing signs of ‘asymmetrical polarisation’, with employment growth in both high-income middle-class occupations and ‘routine’ low-income occupations. Hamnett argues that although most employment growth took place in high-income professional and managerial occupations, there was also substantial growth in ‘routine’ low-income occupations, hence the ‘asymmetric’ character of this social polarisation.
We argue that these contradictory statistical findings are due to the different methods that these authors have used to conceptualise, classify and measure their occupational groups. Studies that use official statistics to measure changes in the occupational distribution of employment in the United Kingdom have the choice of two different classification schemes. One of these is the National Statistics Socio-Economic Classification (NS-SEC) and the other is the Standard Occupational Classification (SOC). Hamnett (2024) relied on the former scheme, whereas van Ham et al. (2020) relied on the latter. We therefore believe that it is very important that this debate takes more seriously precisely how we conceptualise the occupational class structure in order to contribute to the debate about social polarisation.
Our argument is that the concepts described by the NS-SEC are not appropriate for measuring employment trends to test the social polarisation theory. This is because the concepts used in the NS-SEC describe (i) occupations, (ii) employment relationships (employer, self-employed and employee), and (iii) where individuals were employers, the size of the ‘establishment’ by number of employees (ONS, 2023: 7). By contrast, the SOC describes occupations in terms of the nature of the activity and the skills required to perform it (ONS, 2009: 83).
The theory of social polarisation is concerned specifically with numerical changes in economic activities defined in terms of their occupations and their earnings. It is not a theory about the changing numbers of employers, self-employed workers or employees. The NS-SEC is a conceptual scheme that combines descriptions of the ‘social class’ of individuals, which describes their employment relationship, with descriptions of ‘occupational class’, which describes their position in the division of labour (Sayer and Walker, 1992: 19; Wright, 1980: 177).
By contrast, the social polarisation theory describes employment trends solely in terms of occupations and their earnings and not in terms of their employment relationships. So, we argue that the SOC conceptual scheme, which describes the ‘occupational class’ of individuals that can then be allocated to earnings groups, is a more appropriate method of testing the social polarisation theory than the NS-SEC scheme. Furthermore, the occupational groups defined by the SOC are much more homogeneous in terms of their tasks and skills than the groups defined in the NS-SEC. This allows researchers to more meaningfully use these occupational groups to address the social polarisation theory.
Social polarisation and theories about class structure
Although the social polarisation debate is concerned largely with global cities, it nonetheless draws upon and has direct relevance for broader theoretical debates about the class structure of capitalist societies. Hamnett (2021: 1051) argued recently that the theory of social polarisation is one of three main theoretical positions in the debate about the changing class structure of Western societies. He identifies the other two positions as the ‘professionalisation’ and ‘proletarianisation’ theories.
The argument that the class structure has become more professionalised was made by many scholars who presented evidence for the substantial growth of employment in the high-income, middle-class occupations of managers, professionals and technicians (Bell, 1973; Goldthorpe et al., 1987; Hamnett, 1994; Wright and Martin, 1987). In direct opposition to the ‘professionalisation’ theory, Braverman (1974) argued that the main tendency in the class structure was one of ‘proletarianisation’, in which the mechanisation, automation and computerisation of workers’ tasks are fragmented into simple, routine tasks. This de-skilling of tasks therefore results in even lower wages for workers. Braverman’s main contribution to the debate on class structure was his argument that the non-manual occupations of clerical, sales and service workers and even certain middle-class professional and managerial occupations were subject to this de-skilling and reduced wages (Braverman, 1974: 407–408). Our study of the changing occupational class structure of London therefore contributes, not only to the social polarisation debate, but also to the broader debate about the class structure of Western societies.
One of our main arguments in this study is that scholars have so far tested the social polarisation theory using the concept of ‘social class’ rather than the more appropriate concept of ‘occupational class’. Our insight into this distinction comes from our engagement with the above theories of class structure. The NS-SEC, discussed above, is based on Goldthorpe’s social class scheme (Goldthorpe and Knight, 2006: 110). Goldthorpe’s social classes entail a mixture of employment relationships, occupational characteristics and career prospects. This approach of conceptualising class in terms of many different phenomena is also evident in a recent contribution to the social polarisation debate (Custers and Engbersen, 2022: 919). These scholars apply Bourdieu’s ideas by conceptualising class in terms of different kinds of ‘capital’. These are ‘economic capital’ (wealth and income), ‘social capital’ (social networks) and ‘cultural capital’ (the ability to understand and to use cultural goods, especially educational credentials; Bourdieu, 1987; Savage et al., 2015).
In contrast to Goldthorpe, neo-Marxist scholars have preferred to conceptualise ‘social class’ and ‘occupational class’ as distinct and contingently related phenomena rather than as a single phenomenon. They therefore conceptualise social classes solely in terms of employment relationships, namely as employers, self-employed workers and employees. By contrast, ‘occupational class’, is conceptualised solely in terms of the division of labour or work activities (Wright, 1980: 177). As discussed above, we argue that the latter conceptual abstraction is more appropriate for providing evidence to address the social polarisation debate. In making this argument, we are not denying the importance of employment relationships and culture in describing and explaining society. We simply argue that ‘occupational class’, ‘social class’ and ‘culture’ are different structures that are only contingently related to one another. Each of these structures has its own properties and causal powers that need to be understood individually. Once their individual properties are understood, only then can we study their contingent interactions with one another. However, because they entail different structures, we should not conceptualise them as a single structure, which is precisely how Goldthorpe and Bourdieu conceptualise ‘class’. Such an interpretation would be a ‘chaotic conception’ in the sense that it treats different structures as if they were part of a single, common structure (Sayer, 2010: 93–94).
Social polarisation versus professionalisation
Principally, social polarisation describes the absolute employment increases at the poles of the occupational and earnings distribution, namely in high-skilled and high-income jobs, and low-skilled and low-income jobs, while, on the other hand, employment in semi-skilled and middle-income jobs stagnates or even declines. The social polarisation hypothesis, which was initially outlined by Friedmann and Wolff (1982) and later developed by Sassen (2001), argues that this change in the occupational structure is a consequence of economic restructuring and the change from a predominantly manufacturing economy to one dominated by employment in the service sector. While the manufacturing sector is argued to consist of mostly middle-income jobs for skilled artisans and semi-skilled machine operatives, the service sector is believed to have a polarised occupational structure with greater numbers of high- and low-income jobs. As argued by Kloosterman (1996), the high-income occupations are found largely within the producer services, such as finance, real estate, and insurance. By contrast, low-income occupations are argued to be found predominantly in the consumer services sector, such as retail, catering, and other personal services.
The main challenge to the social polarisation theory is Hamnett’s, ‘professionalisation’ theory. Hamnett argues that employment trends in London were characterised by more growth in high-income middle-class occupations and substantially less growth, and even a decline, in both middle- and low-income jobs (Hamnett, 1994). Furthermore, the professionalisation theory also claims that the growth of high-income employment can, in societies with a strong welfare state, be accompanied by relatively high unemployment and economically inactive workers. Therefore, professionalisation entails a different kind of polarisation between a growing number of highly-skilled and high-income middle-class managers and professionals on the one hand, low-skilled, unemployed workers, on the other (Esping-Andersen, 1993: 28; Hamnett, 2003: 61).
Conceptualising and classifying occupations
How have scholars operationalised the social polarisation theory using official statistics? In other words, how have Sassen’s concepts of high-, middle- and low-income jobs been operationalised to measure changes in the occupational and earnings employment distribution? van Ham et al. (2020: Supplemental Information, 16) classified major groups of occupations into high-, middle- and low-income groups on the basis of each group’s average and median earnings. By contrast, Hamnett (2024) does not explicitly classify the social classes of the NS-SEC by earnings. Instead, he groups the seven social classes into three broad groups, namely the ‘middle class’, the ‘intermediate class’ and the ‘working class’ (Hamnett, 2024: 1671). This classification is implicitly related to an earnings hierarchy, since Hamnett argues that ‘higher social classes generally have higher incomes’, thereby implying that lower social classes must therefore earn relatively less (Hamnett, 2024: 1670).
Hamnett (2024: 1672) and van Ham et al. (2020: Supplemental Information, 16) both classify managers and professionals as high-income workers. Furthermore, although they use different occupational classification schemes, the NS-SEC and the ISCO both use concepts that accurately describe managers and professionals. Consequently, their studies both produce statistics showing that employment in these high-income occupations increased over the past few decades. Hamnett (2024: 1672) used the concept of ‘middle class’ 1 to describe these high-income occupations, in which he includes the NS-SEC concepts of ‘Higher Managerial, Administrative and Professional’ and ‘Lower Managerial, Administrative and Professio-nal’. van Ham et al. (2020: Supplemental Information, 16) use the ISCO concepts of ‘Managers and Administrators’ and ‘Professional Occupations’ to measure the growth of high-income jobs. 2 Based on their earnings estimates of these occupational groups, they classified ‘Associate Professio-nal and Technical Occupations’ as middle-income rather than high-income occupations. Hamnett (2024) also excludes lower technical occupations from his high-income ‘Middle Class’ by placing them in his ‘Lower Middle or Intermediate Class’. The only discrepancy between these two classification schemes with respect to high-income occupations is that the NS-SEC also includes employers in large organisations and self-employed higher professionals in the groups that Hamnett classifies as ‘middle class’ (Rose et al., 2005: 23). This should not produce statistical discrepancies because employers in large organisations would probably be classified as managers in the ISCO and self-employed higher professionals would be classified as professionals.
Whereas Hamnett (2024: 1674) produced statistics that show substantial employment growth in low-income ‘routine occupations’ and ‘small employers and self-employed workers’, the results produced by van Ham et al. (2020: 1125) show that employment in low-income jobs declined. In other words, Hamnett’s results show that there was an employment trend of extremely asymmetrical polarisation, whereas van Ham et al.’s results show a trend of professionalisation. We think that these different results are due to the different ways that these scholars have conceptualised and measured low-income occupations. Hamnett’s argument for employment growth in low-income jobs is based on his finding of substantial employment growth in ‘routine occupations’ and ‘small employers and own account workers’.
Hamnett classifies routine occupations, along with semi-routine occupations in his general category of ‘working class’, implying low-skilled and low-income jobs. This is a reasonable assumption insofar as this occupational group includes unskilled manual workers and personal service workers (Rose et al., 2005: 60), who earn low incomes (van Ham et al., 2020: Supplemental Information, 16). However, this ‘working class’ group of routine occupations also includes semi-skilled manual workers (machine operatives and drivers) and skilled manual workers (artisans), who are usually understood to earn middle incomes (Rose et al., 2005: 60; van Ham et al., 2020: Supplemental Information, 16). The allocation of employment in these middle-income occupations into the low-income occupational group will therefore increase estimates of low-income employment. We therefore argue that Hamnett’s use of the NS-SEC does not allow him to isolate employment growth among middle-income manual occupations and therefore cannot test Sassen’s theory of social polarisation.
Hamnett classifies ‘Small Employers and Own Account Workers’ in his general category of ‘Lower Middle or Intermediate Class’, which may imply that these are middle-income occupations. However, he justifies his argument that employment growth in this middle-income occupational group is evidence of growth in ‘working-class’ low-wage jobs, rather than in middle-income jobs. His evidence comes from Giupponi and Xu (2020), who argue that, although this group of self-employed workers includes professionals, they generally tend to earn low incomes rather than high incomes (Hamnett, 2024: 1671). Hamnett also suggests that the growth in self-employment may be due to the increase in the numbers of food and parcel delivery ‘gig’ workers (Hamnett, 2024: 1674). We disagree with Hamnett, at least insofar as the workforce of London is concerned and we shall present evidence for our argument.
By contrast, van Ham et al. (2020: Supplemental Information, 16) define low-income occupations as including the SOC major occupational groups of ‘Sales Occupations’, ‘Personal and Protective Services Occupations’, ‘Clerical and Secretarial Occupations’ and ‘Elementary (or unskilled manual) Occupations’.
In conclusion, we argue that Hamnett’s finding of substantial employment growth in low-income jobs is due to the inclusion of some middle-income occupations into his concept of low-income jobs. This classification is partly due to the use of the NS-SEC, which classifies jobs according to employment status rather than occupational activity. The result is that some of these social classes include very different kinds of occupations and are therefore less valid for testing the social polarisation theory.
Measuring employment trends
van Ham et al. (2020) and Hamnett (2024) both present their employment trends using the changing percentage composition that each occupational group contributes to total employment. Hamnett (2024) also uses percentage point change to show by how much employment growth in each occupational group changed in relative terms between two points in time. Using relative statistics such as these is a useful method for comparing employment trends across occupational groups with different absolute levels of employment. However, as Hamnett (1994: 405) has argued, this is not a legitimate statistical measure for testing Sassen’s social polarisation theory. Sassen argues explicitly that social polarisation is a process of absolute employment change and not relative change. Hamnett’s use of relative instead of absolute employment trends is therefore not a valid test of Sassen’s social polarisation theory. In fact, if we examine Hamnett’s own evidence of absolute employment trends, they show a clear pattern of professionalisation rather than one of asymmetrical polarisation. His statistics show that between 2001 and 2021, employment growth was greatest in ‘middle class’ occupations (890,360), somewhat less in ‘intermediate class’ occupations (615,545) and even less among ‘working class’ occupations (444,956). This is not a polarising pattern of employment growth since the least employment growth took place in the ‘working class’ occupations.
Method and statistical sources
Our results on employment trends rely on the Labour Force Survey (LFS) for all its statistical data over the period from 1981 to 2024. 3 The LFS is the largest regular social survey in the UK, conducted among households residing in private addresses across the UK. While the sample size for London decreased considerably between 1981 and 2024, from 11,312 to 1953, the results nonetheless remain sufficiently precise at the 95% level of probability. 4 When there was more than one survey per year, our data have been derived from the first quarterly Labour Force Survey of each year (between January and March). The cross-tabulations of the employment distributions by NS-SEC and SOC for 2023 are based on the average estimates calculated from all four of the quarterly Labour Force Surveys.
For the surveys from 2005 to 2024, we used the variables that measured employment in occupations defined by the Standard Occupational Classification. For surveys earlier than 2005, which did not use this classification, we recoded the values of variables that measured employment in specific occupations into major groups of occupations following the occupational groups in the Standard Occupational Classification.
Earnings data for the major occupational groups were obtained from the Office for National Statistics (ONS). To adjust for inflation, we utilised the national consumer price index, which calculates changes in the cost of a fixed basket of goods and services that are typical of household consumption. 5
Occupational class schemes and testing the social polarisation theory
Jobs, following the SOC classification, are classified in terms of their skill content. The concept of a job is defined as a series of tasks assigned to an individual. The skill levels are estimated based on the duration considered essential for an individual to achieve complete proficiency in executing the task associated with a job (ONS, 2021). This study is concerned only with the nine major groups, which are defined by the ‘general nature of the qualifications, training and experience associated with competent performance of tasks in the occupations classified within each major group’ (ONS, 2021).
The SOC’s nine major occupational groups are:
(1) Managers, Directors and Senior Officials
(2) Professional Occupations
(3) Associate Professional and Technical Occupations
(4) Administrative and Secretarial Occupations
(5) Skilled Trades Occupations
(6) Caring, Leisure and Other Service Occupations
(7) Sales and Customer Service Occupations
(8) Process, Plant and Machine Operatives
(9) Elementary Occupations (unskilled manual occupations)
The variation in classification of occupational classes remains one of the prominent reasons why there are disagreements among scholars regarding the changing occupational structure of the labour market. We will therefore justify our approach to the classification of occupations as follows. Following the early contributions to this debate (Friedmann and Wolff, 1982; Sassen-Koob, 1984), the social polarisation debate distinguishes between three occupational groups. These are the high-income, middle-income and low-income groups. Friedmann and Wolff (1982: 320–322) and Sassen-Koob (1984: 157, 162) argued that middle-income occupations are all manual jobs in the manufacturing sector, while low-income occupations were unskilled manual jobs in the service sector, such as cleaners, laundry workers and sales workers. High-income occupations were argued to be managers, professionals and technicians employed mostly in the growing service sector. We then tested this proposed earnings classification against the average annual earnings of each major occupational group from 1997 to 2025 (Figure 1). The results largely confirm the earnings hierarchy discussed above and show that the earnings differences between high, middle and low-income major groups of occupations have remained more of less constant over this period.
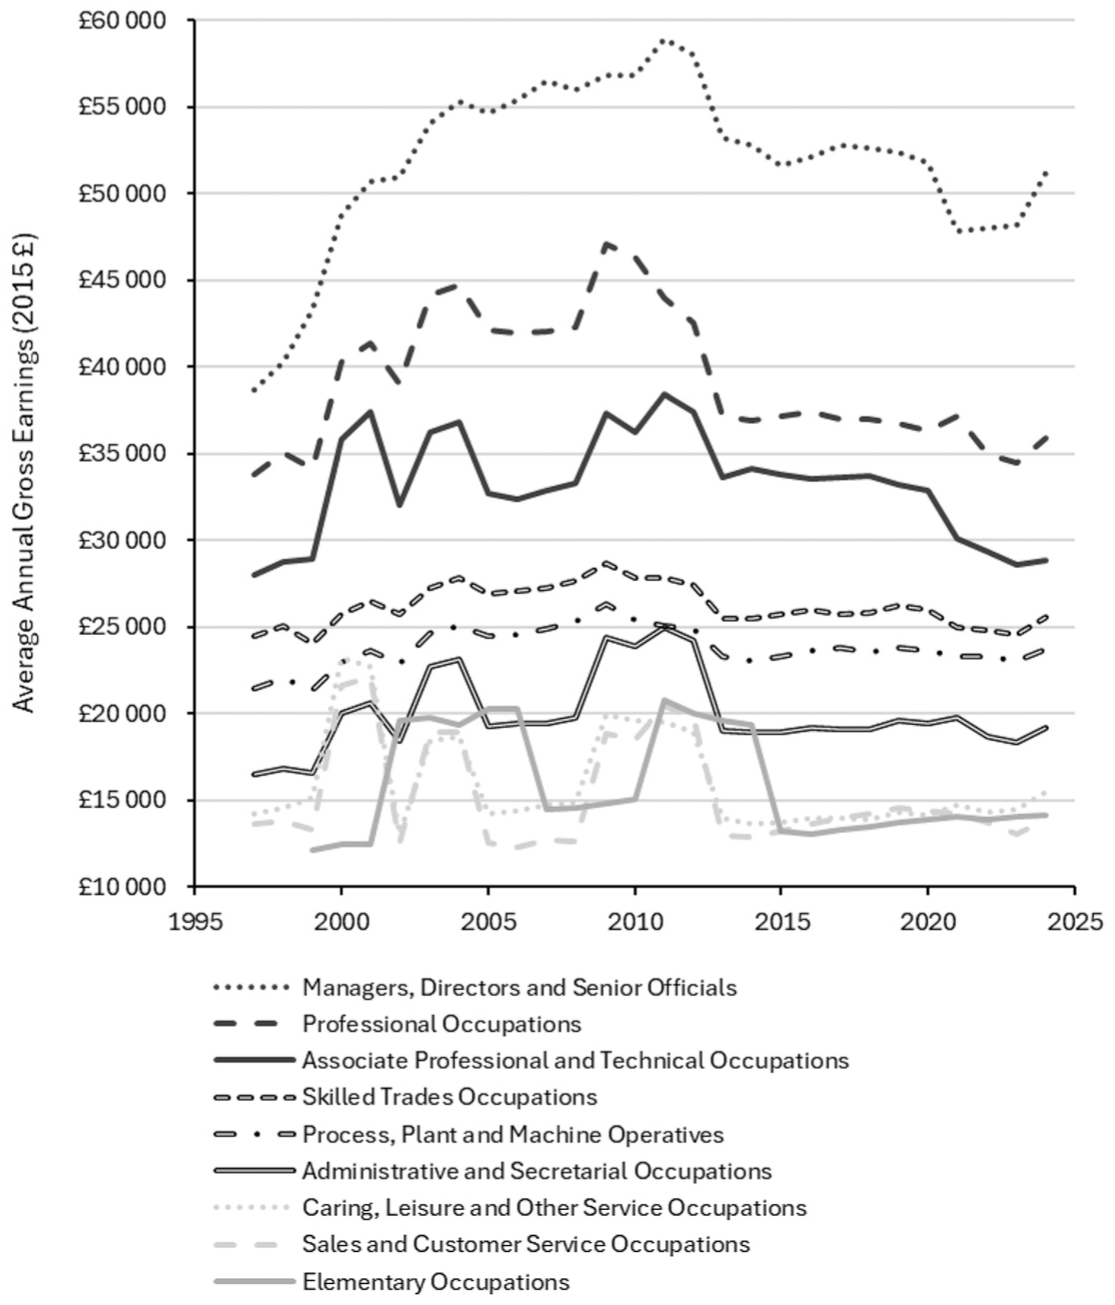
Average real annual gross earnings by major groups of occupations in London, 1997-2024 (2015 £).
Following the above reasoning and earnings evidence, we then aggregated the nine Major Occupational Groups into high-, middle- and low-income groups using the average earnings data from the ONS for each SOC major group of occupations over the period 1997–2024 (Figure 1 and Table 1).
The earnings distribution of occupational groups using the Standard Occupational Classification.
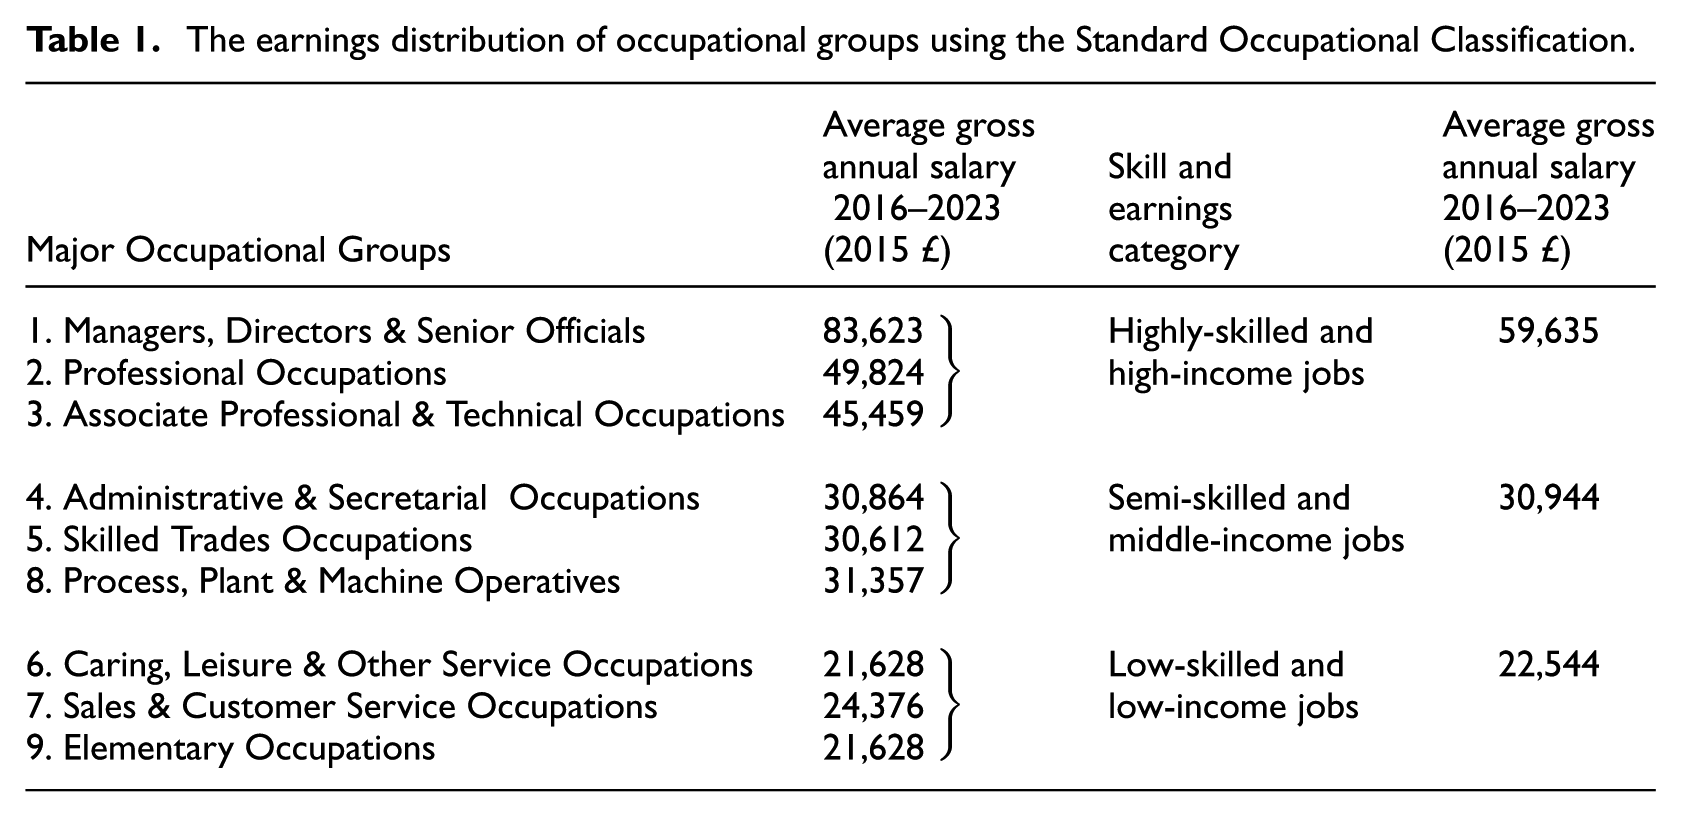
The first group, labelled as the high-income occupational group, comprises individuals in highly-skilled and high-income jobs. This group includes the major groups of:
(1) Managers, Directors and Senior Officials
(2) Professional Occupations
(3) Associate Professional and Technical Occupations
The second group, identified as the middle-income occupational group, consists of middle-income, semi-skilled workers. Members of this group are drawn from the major groups of:
(4) Administrative and Secretarial Occupations
(5) Skilled Trades Occupations
(8) Process, Plant and Machine Operatives
Sassen (2001: 9) defines manual factory work as middle-income occupations. These middle-income manual occupations typical of the manufacturing sector are: ‘Skilled Trades Occupations’ and ‘Process, Plant and Machine Operatives’. Our evidence clearly demonstrates the middle-income status of these two major groups. Although Sassen and other authors have often classified these administrative (clerical) and secretarial workers as low-income workers, evidence from a number of cities suggests that they should be classified as middle-income workers (Borel-Saladin and Crankshaw, 2009; Crankshaw, 2017, 2022). Our own evidence reflects the slightly ambiguous status of this major group of occupations. From 1999 to 2013, the earnings of ‘Administrative and Secretarial Occupations’ were sometimes even less than the earnings of low-income occupations. From 2013 onwards, however, the evidence shows that this major group earned substantially more than the low-income occupations (Figure 1). Furthermore, the average earnings of this major group over the whole period are also substantially more (£19,977) than the average for all the low-income major groups of occupations (£15,630; Table 1). We therefore decided to also include ‘Administrative and Secretarial Occupations’ in the middle-income group. We do, however acknowledge that there is an argument for including the ‘Administrative and Secretarial Occupations’ in the low-income group. As we will see later, employment in this major group declined over the period of study and placing it in the low-income group would therefore reduce the extent of employment growth in low-income occupations.
Lastly, the third group, termed the low-income occupational group, encompasses low-income, low-skilled workers. This group aligns with Sassen’s theory that these service sector jobs earn less than middle-income factory occupations. This group includes workers from the following Major Occupational Groups:
(6) Caring, Leisure and Other Service Occupations
(7) Sales and Customer Service Occupations
(9) Elementary Occupations
An important feature of the SOC major groups of occupations is that they correspond to the concepts that are used in the social polarisation theory. By contrast, some of the occupational groups in the NS-SEC join up occupational groups that are kept distinct in the social polarisation theory. Specifically, the NS-SEC social class of ‘Routine Occupations’ includes the middle-income manual occupations (‘Skilled Trades Occupations’ and ‘Process, Plant and Machine Operatives’) and low-income unskilled manual occupations (‘Elementary Occupations’). As such, the NS-SEC cannot measure the employment trends in these distinct major groups of occupations and therefore cannot be used to test the social polarisation theory.
Results
Comparing the Standard Occupational Classification compared with the National Statistics Socio-Economic Classification
The choice of occupational classification scheme for testing the social polarisation theory has important consequences for the kinds of statistical evidence that are produced. Examining Hamnett’s (2024) results, the most consequential result is that using the NS-SEC overestimates the numbers of low-income workers by classifying many middle-income manual workers as low-income workers. Specifically, 19% of all ‘Routine Occupations’, which Hamnett classifies as low-income jobs, would be classified as middle-income ‘Process, Plant and Machine Operatives’ (Table 2). Similarly, 5% of all ‘Routine Occupations’ would be classified as middle-income ‘Skilled Trades Occupations’.
The employment distributions of the Standard Occupational Classification compared with the National Statistics Socio-Economic Classification, London 2023.
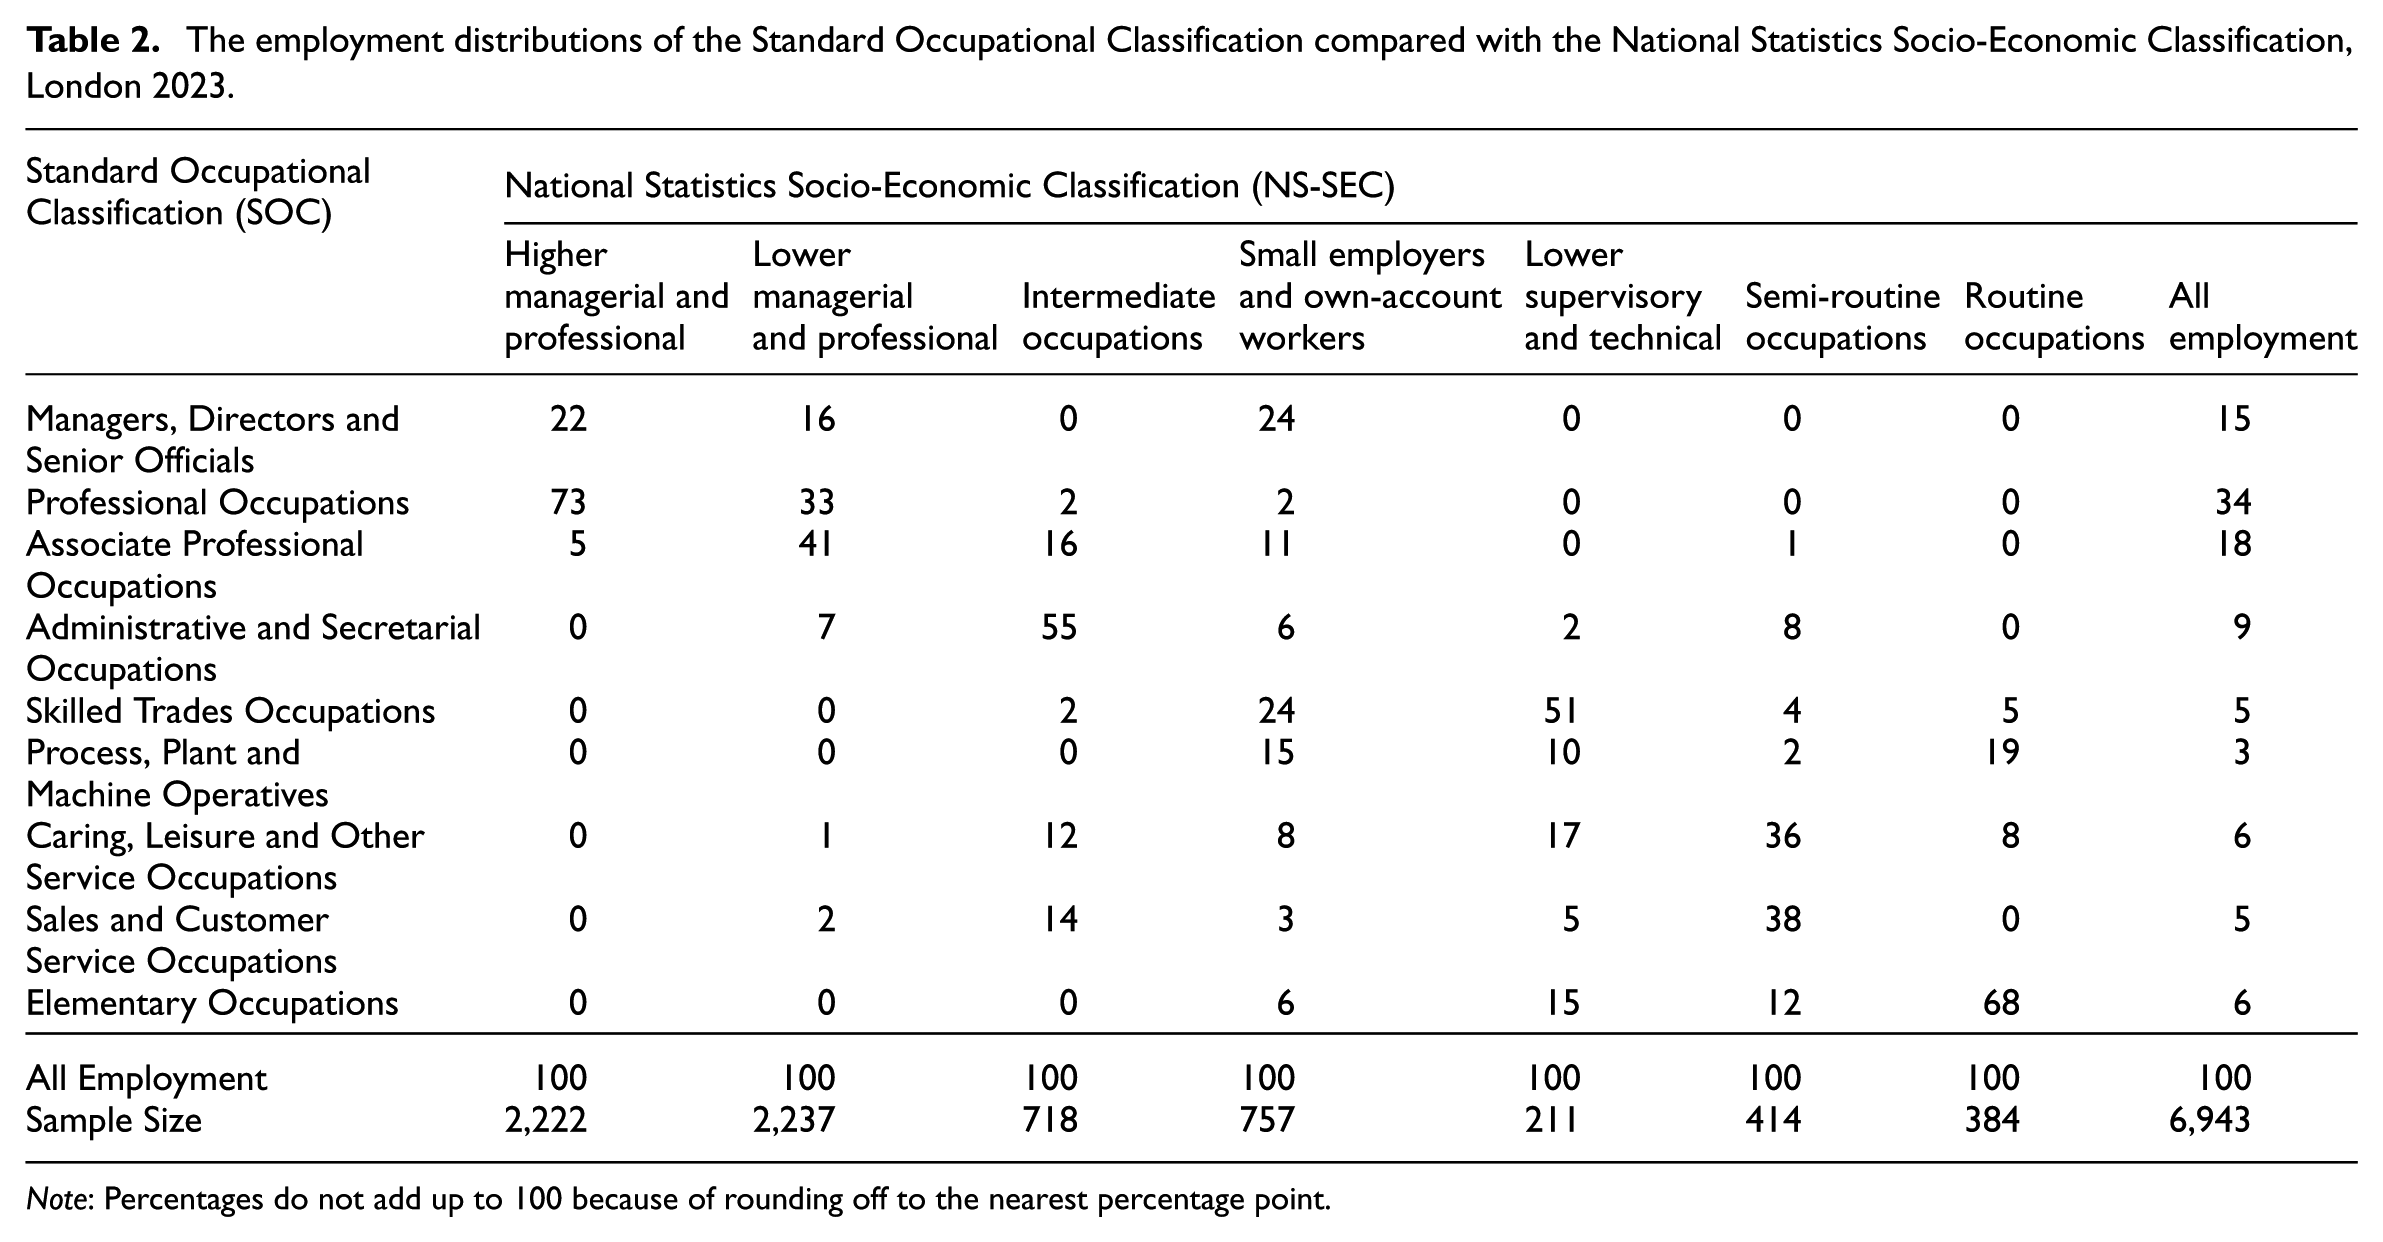
Note: Percentages do not add up to 100 because of rounding off to the nearest percentage point.
Conversely, Hamnett classifies the NS-SEC group of ‘Intermediate Occupations’ as middle-income workers, which would produce higher estimates of middle-income workers and lower estimates of low-income workers than the SOC. This is because 12% of ‘Intermediate Occupations’ correspond to the low-income SOC major group of ‘Caring Leisure and Other Service Occupations’ and 14% correspond to the low-income SOC major group of ‘Sales and Customer Service Occupations’ (Table 2).
Small employers and own account (self-employed) workers
We correlated the employment distributions of small employers and self-employed workers by occupation in the SOC scheme to estimate the extent to which employment growth in the NS-SEC class of Small Employers and Own Account (self-employed) Workers contributed to the growth of low-wage employment (Table 3). The average estimates based on the four quarterly surveys in 2023 show that self-employed workers were almost twice as likely to work in high- and middle-income occupations than in low-income occupations. The percentage of ‘Small Employers and Self-Employed Workers’ in high-income occupations was 38% and in middle-income occupations it was 44%. By contrast, the percentage of ‘Small Employers and Self-Employed Workers’ in low-income occupations was only 18%. These findings conclusively show that employment growth among ‘Small Employers and self-Employed Workers’ is not evidence for the growth of low-income jobs, as Hamnett (2024) argues. To the contrary, it is evidence of more growth in middle and high-income jobs. We therefore conclude from this evidence that it makes much more sense to use the SOC occupational classes rather than the NS-SEC social classes to test the social polarisation theory because it provides more homogenous groups of occupations for which average earnings are more valid. The NS-SEC category of ‘Small Employers and Own Account Workers’ contains a wide range of occupations with very different earnings and is therefore unsuitable for testing the social polarisation theory.
Occupational and earnings distribution of small employers and own account (self-employed) workers in London, 2023.
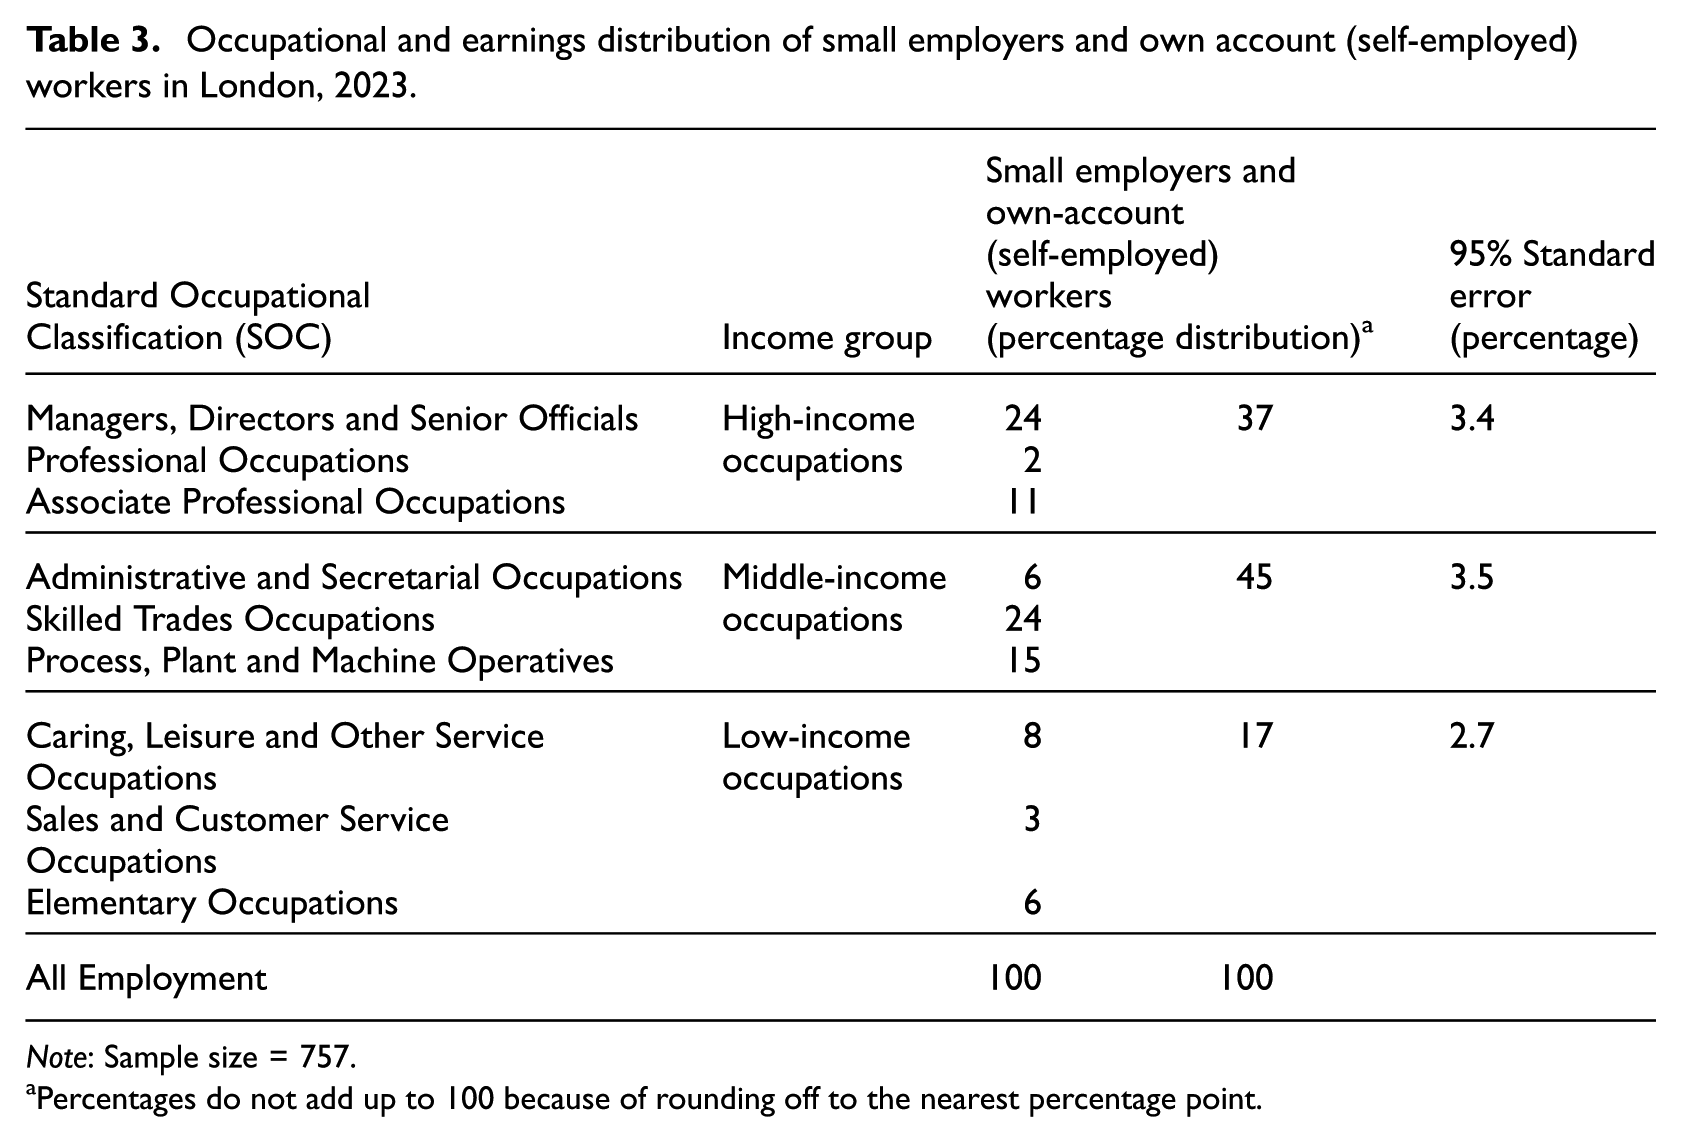
Note: Sample size = 757.
Percentages do not add up to 100 because of rounding off to the nearest percentage point.
Employment trends by occupational groups, 1981–2024
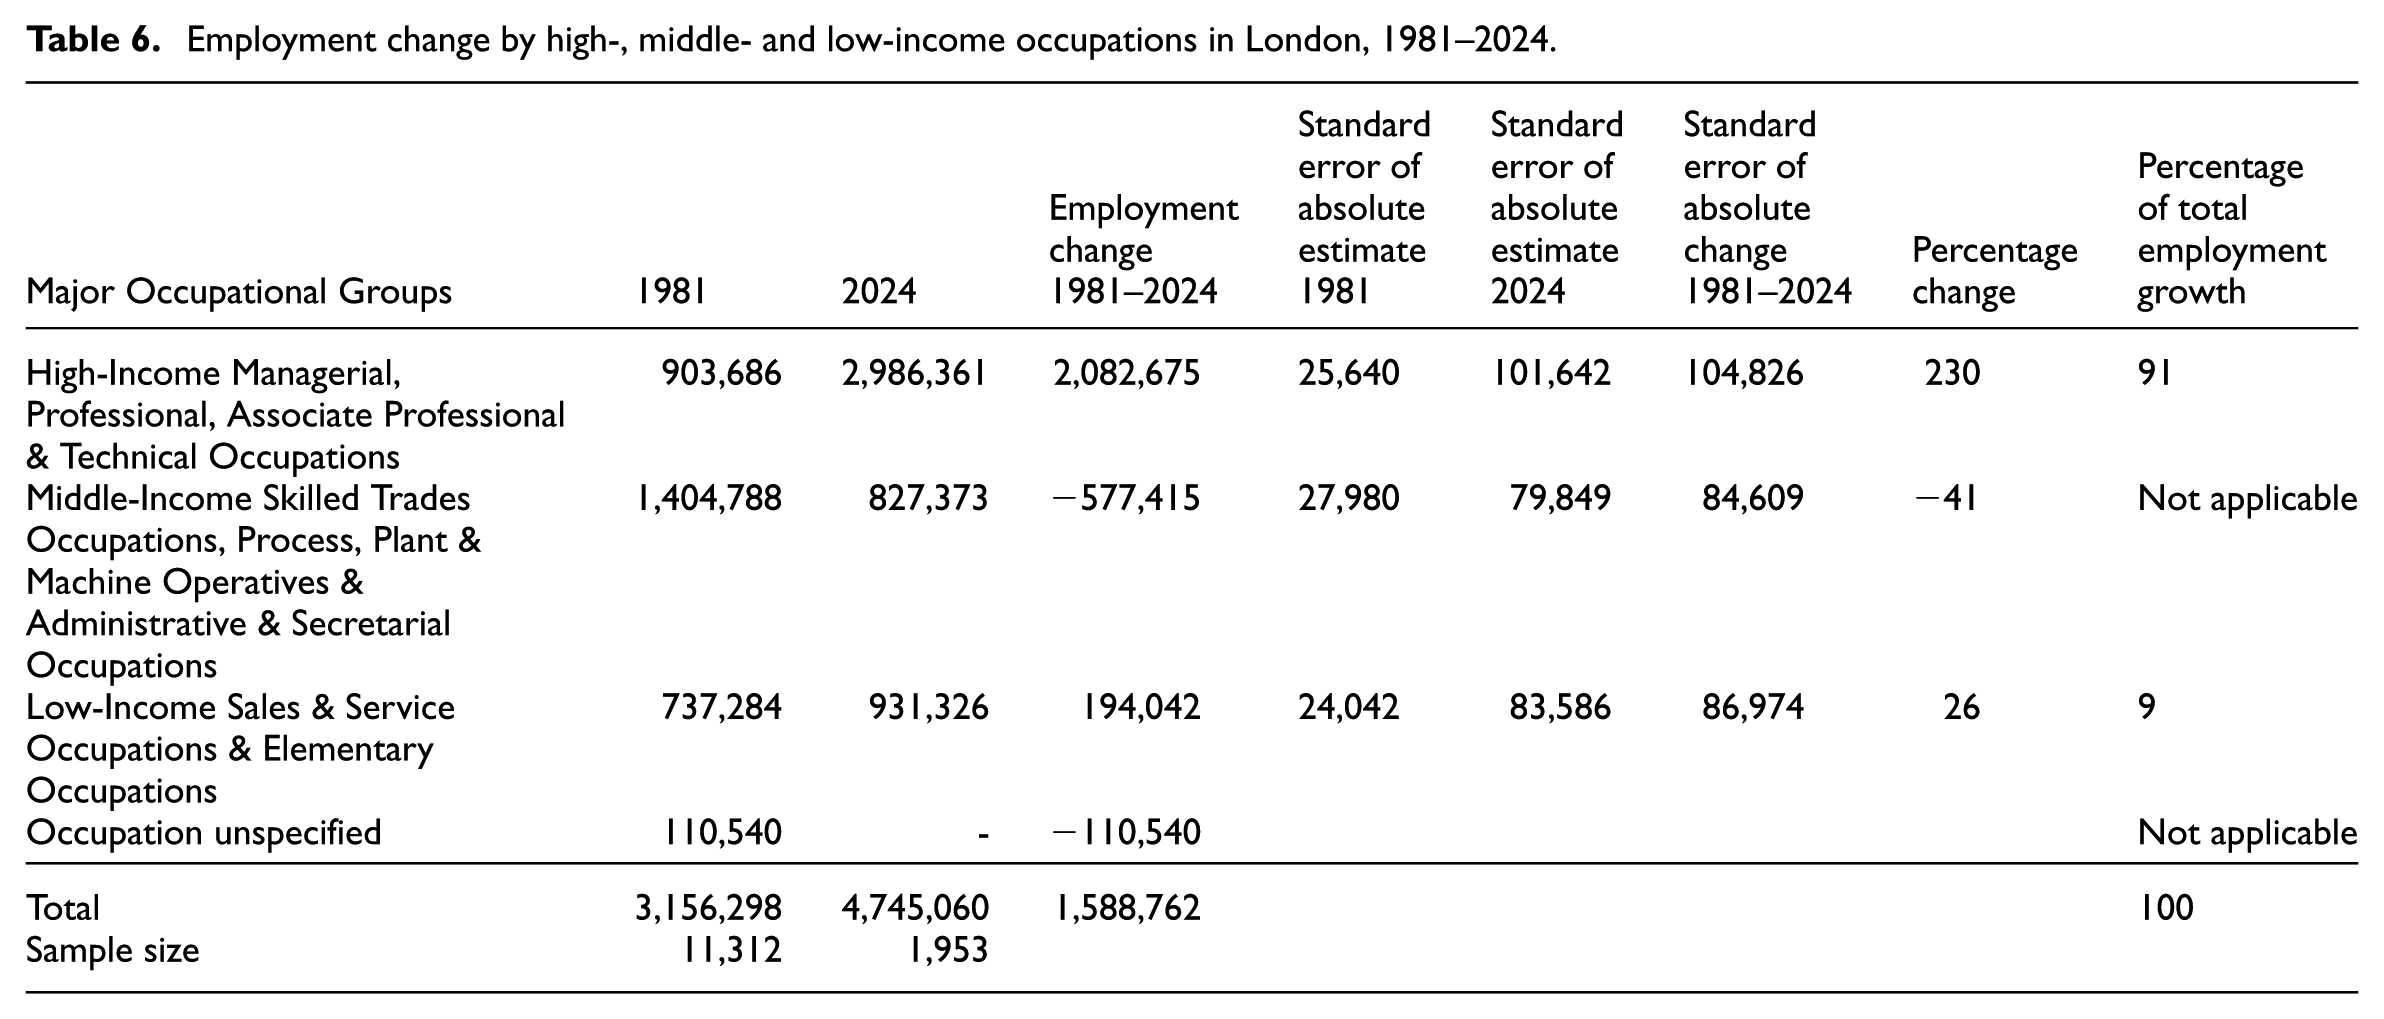
The results of our study suggest that London’s occupational structure has undergone a highly asymmetrical form of social polarisation (Figure 2 and Tables 4 and 5). However, these results do not substantially contradict Hamnett’s professionalisation theory concerning London. The reason for this is that although these results show a marginally polarising trend, it is highly asymmetrical in the sense that 91% of all employment growth took place in high-income occupations and only 9% was in low-income employment (Table 5). Putting it differently, between 1981 and 2024, high-income jobs grew by 230%, whereas low-income jobs grew by only 26% (Table 5). Measured in terms of absolute employment, high-income jobs grew from 903,686 in 1981 to 2,986,361 in 2024, which was an increase of 2,082,675 jobs. By contrast, employment in low-income jobs grew by only 194,042, from 737,284 in 1981 to 931,326 in 2024 (Figure 3 and Table 5).
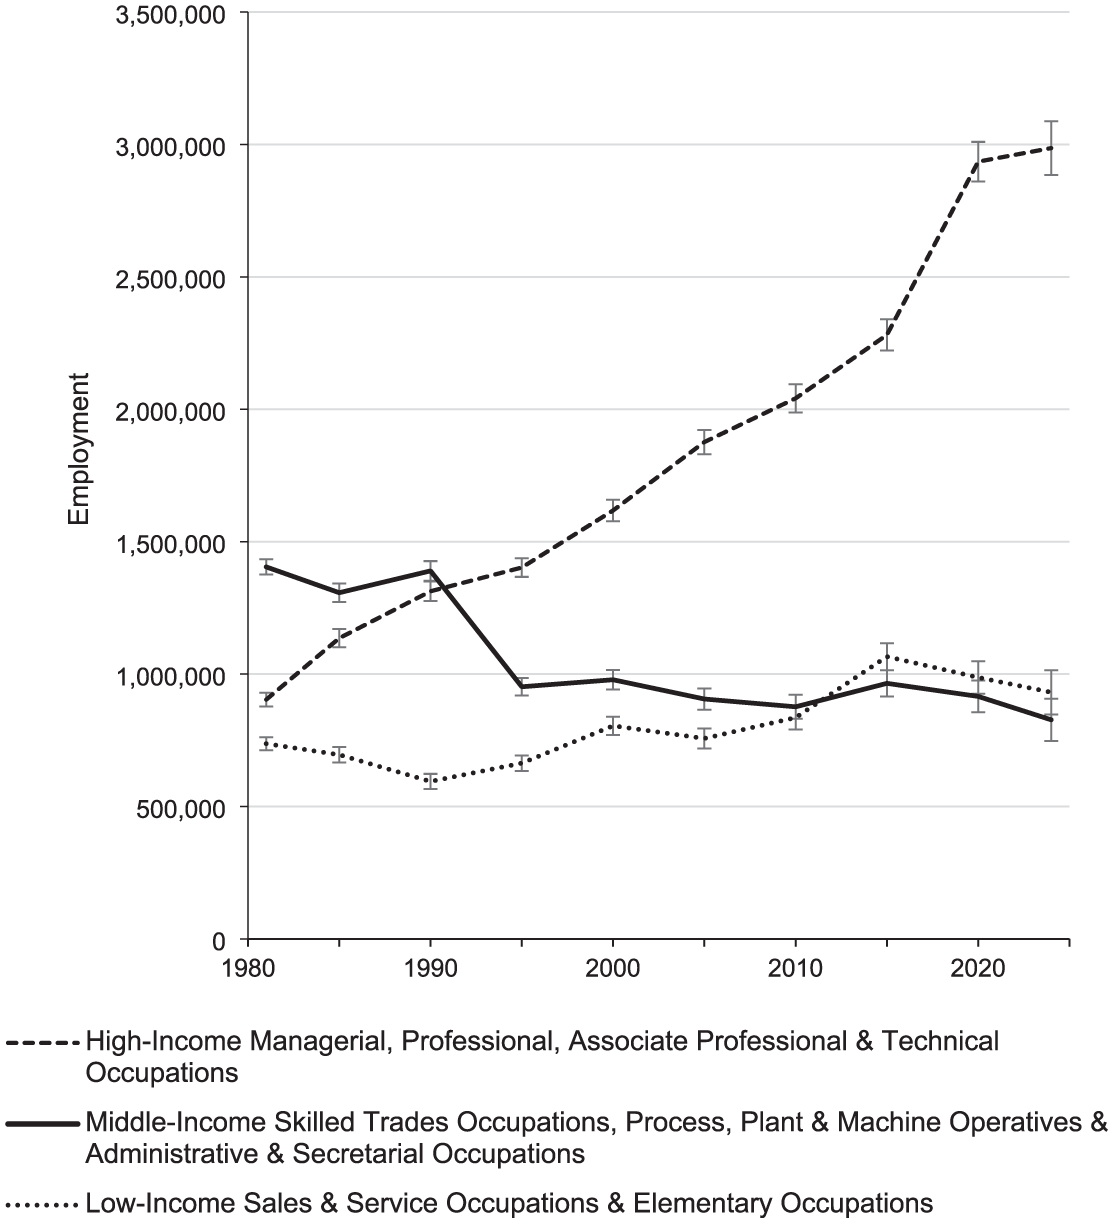
Employment by high-, middle- and low-income occupations in London, 1981–2024.
Employment of London residents by major occupational group, 1981–2024.

Employment by high-, middle- and low-income occupations in London, 1981–2024.
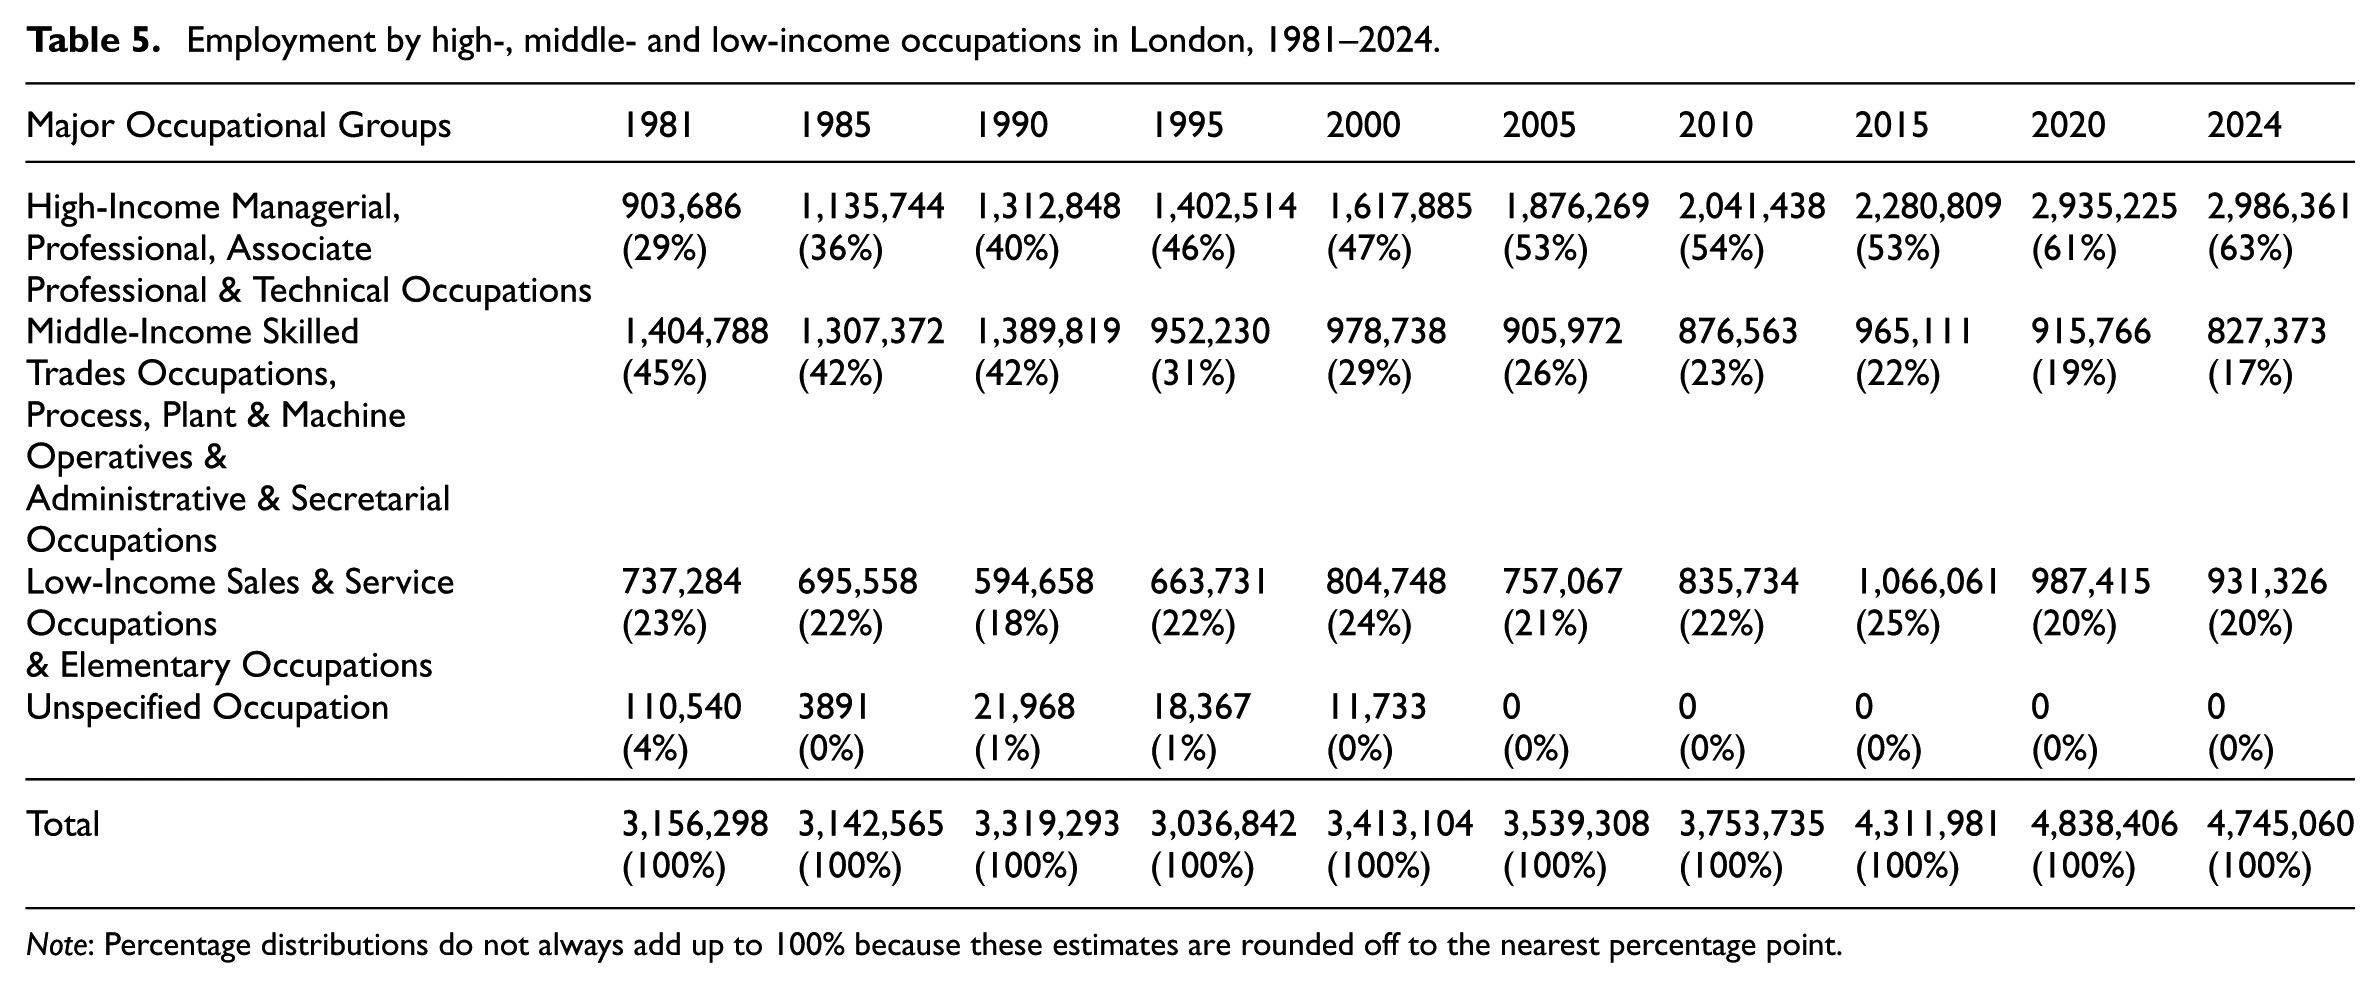
Note: Percentage distributions do not always add up to 100% because these estimates are rounded off to the nearest percentage point.
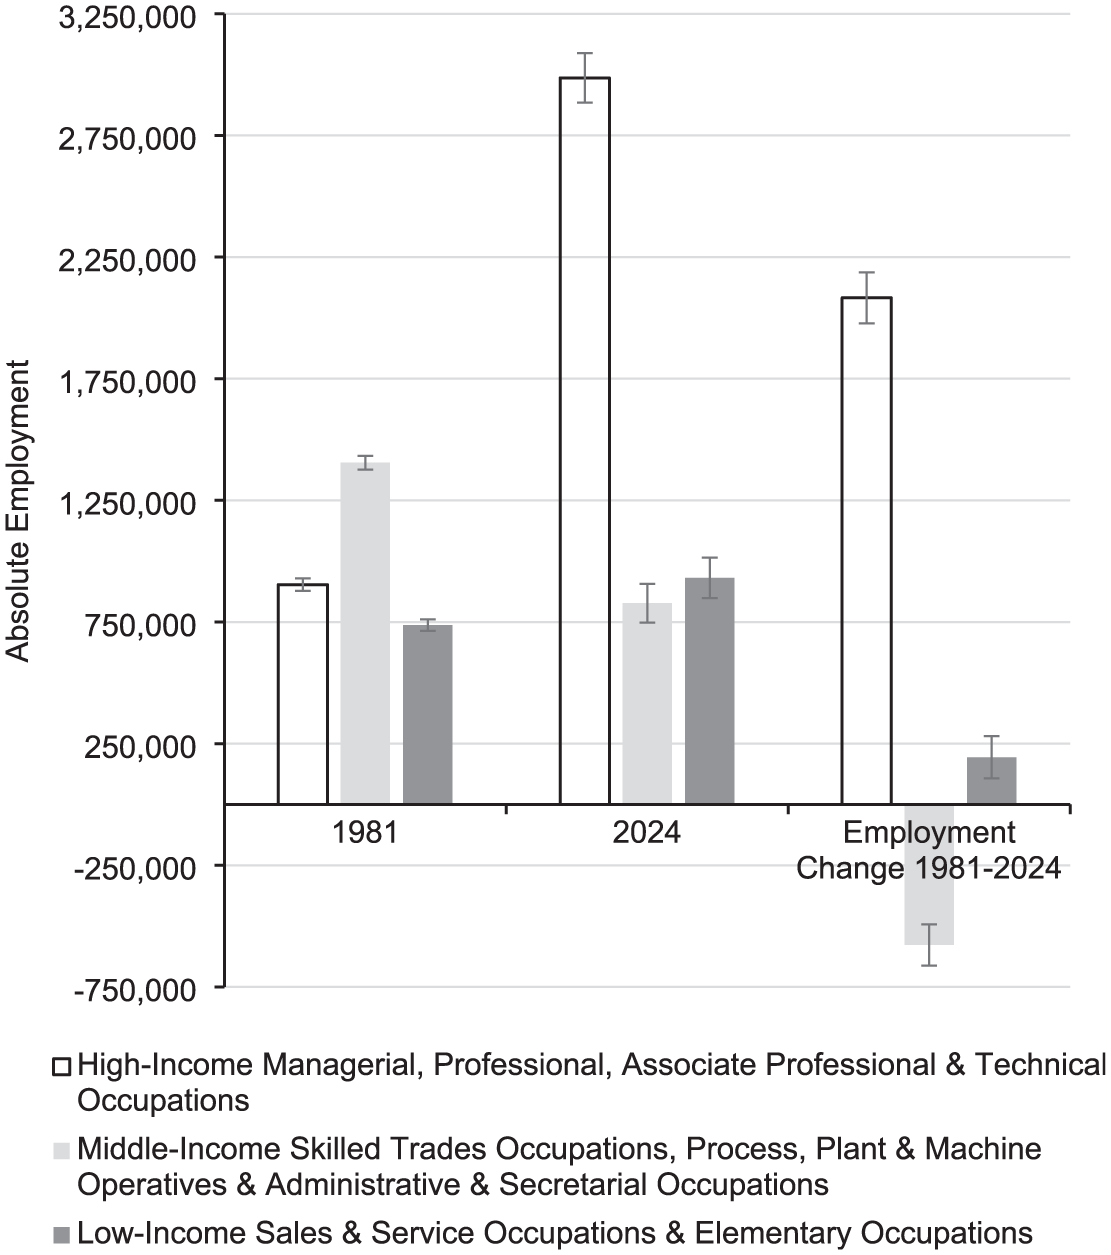
Employment change by high-, middle- and low-income occupations in London, 1981–2024.
The overall nature of these changes in the occupational structure can be described in the following terms: In 1981, 45% of all workers were employed in middle-income manual and administrative jobs and only 29% were employed in high-income managerial, professional and technical jobs (Table 5). By 2024, high-income jobs had grown to 63% and the percentage of middle-income workers had declined to only 17% of all employment. The percentage of low-income jobs changed only slightly, declining from 23% to 20% of all employment (Table 6).
Employment change by high-, middle- and low-income occupations in London, 1981–2024.
Our findings are in broad agreement with the general trends produced by van Ham et al. (2020) and Hamnett (2024) in the sense that both these studies argue that there was a large increase in the numbers of high-income workers employed in managerial and professional occupations. The difference between our findings and these scholars is that our estimates of the numbers of high-income workers is much higher. The reason for this lies in the way that the occupational groups were classified into high and middle-income groups. In our classification, we based our definition of middle-income jobs on the argument by Friedmann and Wolff (1982: 320) and Sassen-Koob (1984: 146) that middle-income jobs are manual jobs, which are predominantly found in the manufacturing sector, namely the ‘Skilled Trades Occupations’ and ‘Process, Plant and Machine Operatives’. In this argument, jobs that earned wages higher than these middle-income occupations were, by definition, high-income jobs and jobs that earned less were low-income jobs. By contrast with our approach, van Ham et al. (2020) classified occupational groups into high-income and middle-income groups without any explicit reference to the social polarisation debate about the nature of middle-income jobs. The result is that they have, for specific censuses, classified ‘Associate Professionals and Technicians’ as middle-income workers, even though they earned more than middle-income workers in ‘Skilled Trades Occupations' and ‘Process, Plant and Machine Operatives' (van Ham et al., 2020: Supplemental Information, 16). Since we classified ‘Associate Professionals and Technicians' as high-income workers, our estimates of high-income employment are much higher than theirs.
Our findings agree with Hamnett’s (2024) argument that there was a small increase in the number of low-income workers. Hamnett’s argument is based on his finding that employment the NS-SEC category of ‘Routine Occupations’ increased. Because most employment in ‘Routine Occupations’ corresponds to our definition of low-income occupations based on the SOC, our results are therefore similar. However, we argue that Hamnett’s use of the category of ‘Routine Occupations’ will provide somewhat higher estimates of low-income employment because it includes the large numbers of process, plant and machine operatives in its count, which we argue should be classified as middle-income occupations (Table 2). We therefore agree with Hamnett (2024) that the general employment trend is one of a highly asymmetrical polarisation.
However, we disagree with Hamnett’s argument that the increase in employment among small employers and own account workers is a cause of employment growth in low-income jobs. In the first place, even by Hamnett’s own classification, these are middle-income jobs and not low-income jobs: he classifies them in his ‘Lower Middle Class or Intermediate Class’ rather than in his ‘Working Class’ category (Hamnett, 2024: 1672). In the second place, as we showed above, self-employed (own account) workers are not concentrated in low-income occupations. Our results show that most of them are self-employed in high and middle-income occupations (Table 2).
As a final comment on these results, we would like to note that if we classify ‘Administrative and Secretarial Occupations’ as low-income jobs instead of middle-income jobs, the result is an absolute decline in low-income jobs (−63,645) and middle-income jobs (−319,728) between 1981 and 2024. This result therefore indicates a strongly professionalising trend rather than an asymmetrical polarising trend.
Conclusion
We argue that contributions to the social polarisation debate must give greater attention to the conceptualisation, classification and measurement of occupational groups if they are to adequately test the social polarisation theory. Our main point is that the NS-SEC conflates the employment status and the occupation of workers. The result is that, in some instances, socio-economic classes of the NS-SEC comprise very different occupations with a very wide range of earnings. Specifically, the socio-economic class of ‘Small Employers and Own Account Workers’ groups together workers in high, middle and low-income occupations, which is not suitable for testing the social polarisation theory. Similarly, the socio-economic class of ‘Routine Occupations’ includes middle and low-income occupations, which makes it an unsuitable occupational category for testing the social polarisation theory. As an alternative, we propose that the SOC is a much more suitable classification because its occupational groups are more homogeneous in terms of their job descriptions and skill content. Consequently, the average earnings of these groups are a more valid measure for testing the social polarisation theory.
We therefore used the Standard Occupational Classification to define high-, middle- and low-income occupational groups. Our estimates of employment change for the period from 1981 to 2024 show that there was a trend of highly asymmetrical polarisation. Almost all (91%) of employment growth took place in high-income occupations and only 9% of employment growth was in low-income occupations. Employment in middle-income occupations declined slightly over this period.
Footnotes
Funding
The authors disclosed receipt of the following financial support for the research, authorship, and/or publication of this article: The authors would like to thank the South African National Research Foundation for Funding (Grant Reference No. RA231218201490).
Declaration of conflicting interests
The authors declared no potential conflicts of interest with respect to the research, authorship, and/or publication of this article.